HTF High/LowThis simple script draws the previous higher timeframe candle high/low to your chart.
You can also make the script paint the zone between the low/open and the high/close.
Wyszukaj w skryptach "low"

Low Latency Trendline[Geo]Low latency trendline is a better and faster indicator than MAs.
It lowes high frequency wave(noise) and echoes low frequency wave(main move trend).
You can find out trend faster and have more confidence to dicide than MA indicators.
Take your own risk to use this Indicator.
PS:
I found RMTA() to help coding.
Tradingview has a good recursive function method. And RMTA has a good licence:MIT licence. Thanks to you, Alex.

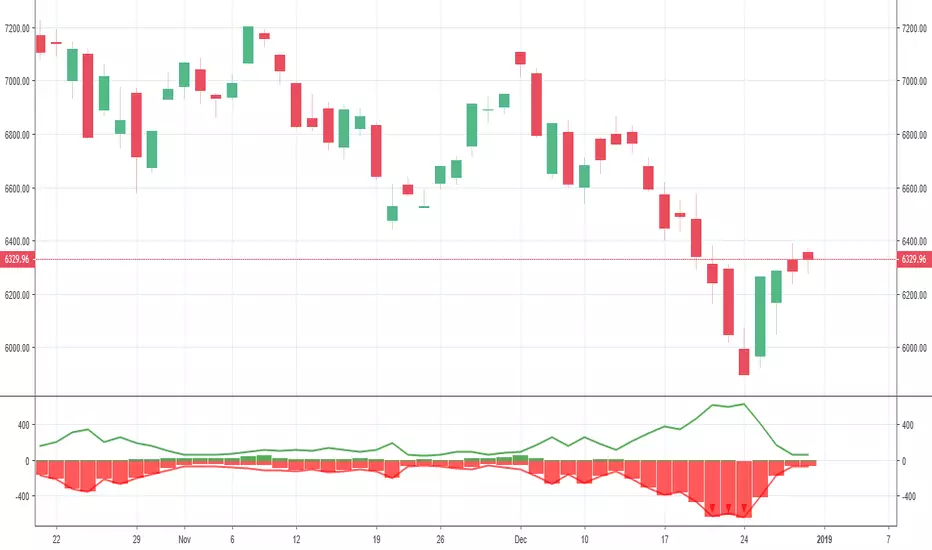
New Highs-Lows NASDAQ-Buschi
English:
This indicator shows the NASDAQ's new highs (green) and new lows (red).
Extreme trading days with more than 99 % new highs relative to new lows vice versa are marked via lines (theoretically values) and triangles (breaches).
Deutsch:
Dieser Indikator zeigt die neuen Hochs (grün) und neuen Tiefs (rot) der NASDAQ.
Extreme Handelstage mit mehr als 99 % neuen Hochs relativ zu den neuen Tiefs und andersherum sind gekennzeichnet über Linien (theoretische Werte) und Dreiecke (Überschreitungen).
New Highs-Lows NYSE-Buschi
English:
This indicator shows the NYSE's new highs (green) and new lows (red).
Extreme trading days with more than 99 % new highs relative to new lows vice versa are marked via lines (theoretically values) and triangles (breaches).
Deutsch:
Dieser Indikator zeigt die neuen Hochs (grün) und neuen Tiefs (rot) der NYSE.
Extreme Handelstage mit mehr als 99 % neuen Hochs relativ zu den neuen Tiefs und andersherum sind gekennzeichnet über Linien (theoretische Werte) und Dreiecke (Überschreitungen).

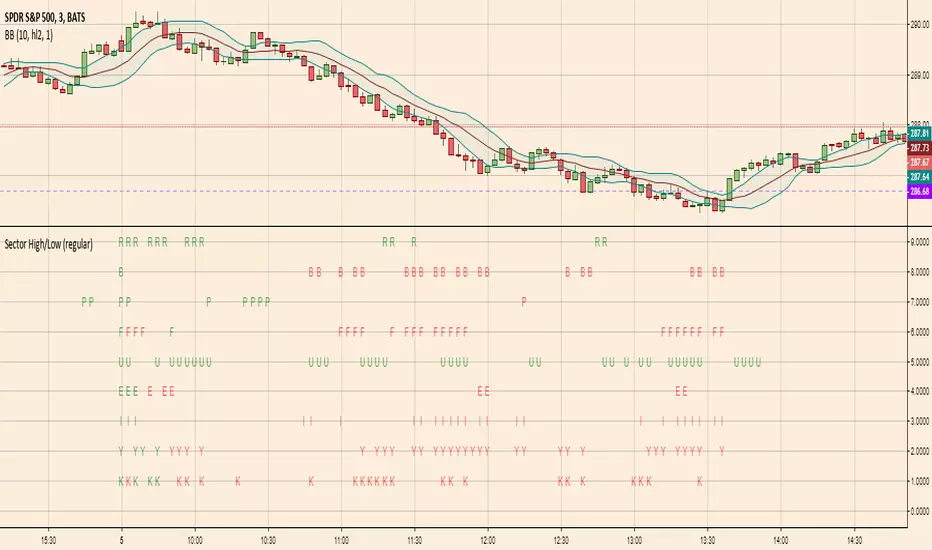
Sector High/LowHighlights which S&P SPDR Sector ETFs are at highs of day (green letter) or lows of day (red letter)
The first candle of the day is always all-green because by default the first candle of the day has the high of the day. So this indicator is more meaningful later in the day when sectors are making repeated highs/lows
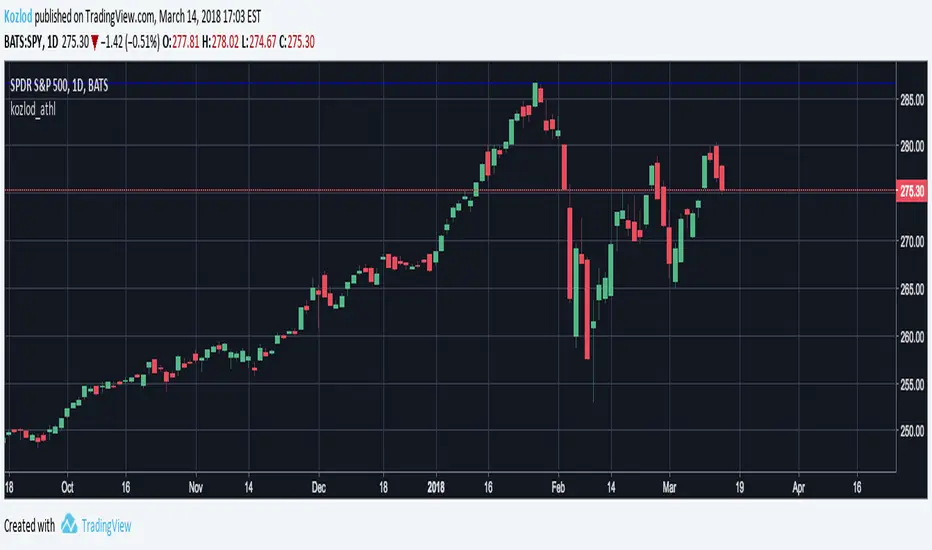
Kozlod - All-time high/low alertsA small script to track all-time high/low levels.
You can create alerts when levels will be updated.
Low SMA of SMAgain over the chart for ProfitTrailerLow SMA of SMAgain over the chart for ProfitTrailer
This script prints low SMA line over the chart.
Buy value and time frame numbers can be modified in format.
Basically this is same with previous scripts of mine.
Though this does not show the spread between the price and low SMA line (SMAgain) and buy value, you can see the buy trailing signal.
If you set buy value positive for gain starategy, the buy trailing will start from the time point indicated by "▲".
If you set buy value negative for gain starategy, the buy trailing will start from the time point indicated by "▼".
This script is to help myself understand the buy strategies of ProfitTrailer.
Any comments and suggestions are welcome.

DayLow - Chart the Moving Average of the DAILY LOW PriceThis is a moving average of the Daily LOW Price over a short period of time (i.e. 3 day low moving average, etc...) Great for tracking trailing stops for a stock on an up swing.

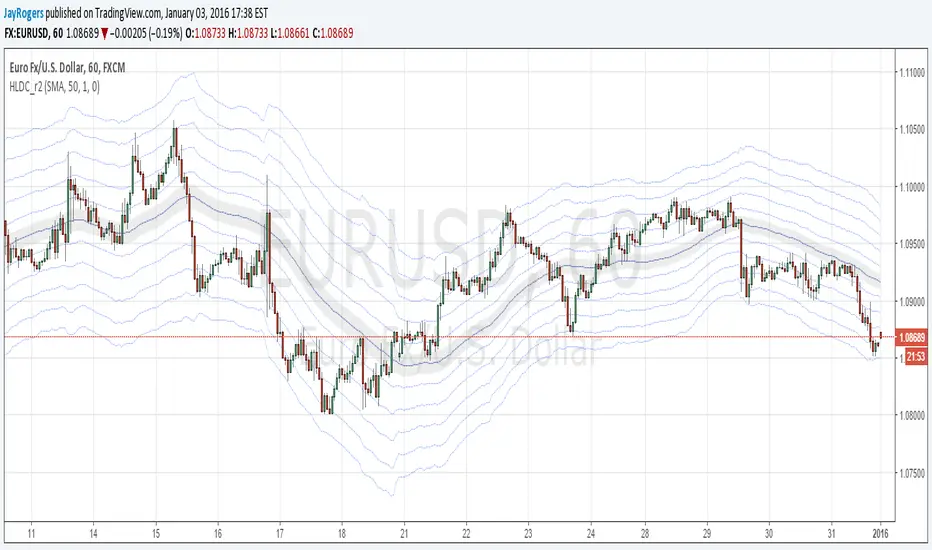
High-Low Difference Channels r2About:
I developed the original as an experiment to potentially replace or augment my BB and RSI based strategies. After some back-testing I could see some really interesting results but it wasn't quite where I wanted it, so after some tweaking and further back-testing, and adding in more MA options, here we are. Mostly tested on 1h and greater time-frames using default settings.
Description / Usage:
Adjust length and multiplier much the same way you would expect with Bollinger Bands.
Multiplier of 1 gives you a base channel consisting of one high, and one low sourced MA
The outer channels are increments of the base high-low channel width, away from the hl2 sourced MA
r2 Changes:
Increased amount of up/down channels to 5, and lowered multiplier default to 1 (previously 1.5)
Tweaked default colour scheme.
Pick your MA poison of choice! Added choices for all your common MA variants.
Issues:
VWMA bugs out and refuses to draw sometimes - no idea why.
Additional Notes:
All MA variants available in this script were derived directly from the sources of those available within the pine editor. I have been fairly diligent trying to ensure they all function correctly, but I can't 100% guarantee it, so if anyone gives the script a try, or dives into the code and see's something odd - don't hesitate to let me know!
It would also be fantastic to hear feedback from anyone who finds use for this, to augment an existing strategy/idea, or develop something new. :)
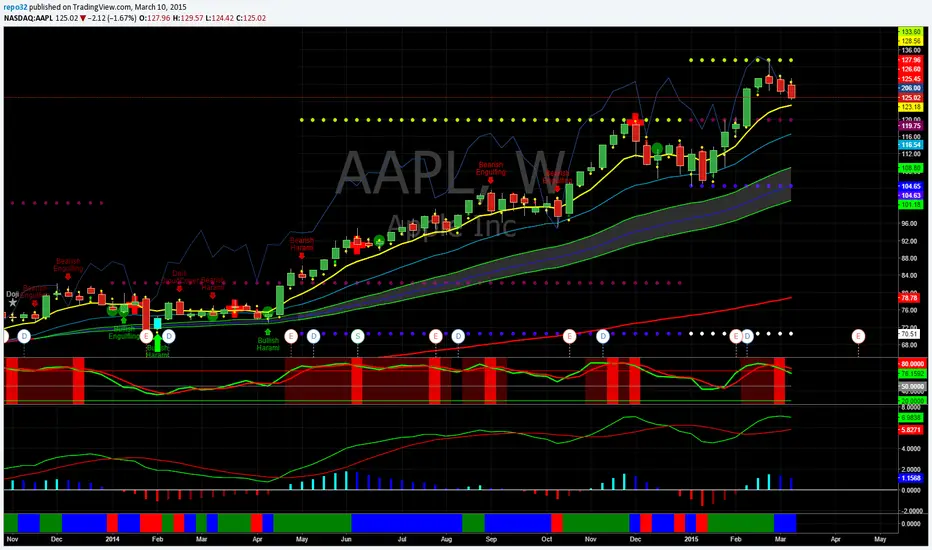
High Low YearlySorry for the mess above. Not sure how to remove it. It was not what I was looking to post. I added the the clean chart below.
This was requested by "N". It displays the current yearly highs and lows along with the previous years highs and lows. Just a nice way to see the support resistance in all time frames.
WLI Swing High/Low advnc indicatorfor Class members
else
label.set_xy(lowMsg, bar_index, close)
label.set_text(lowMsg, "making New Low")
label.set_color(lowMsg, newSwingLowColor)
label.set_textcolor(lowMsg, color.white)
else
if not na(lowMsg)
label.delete(lowMsg)
lowMsg := na

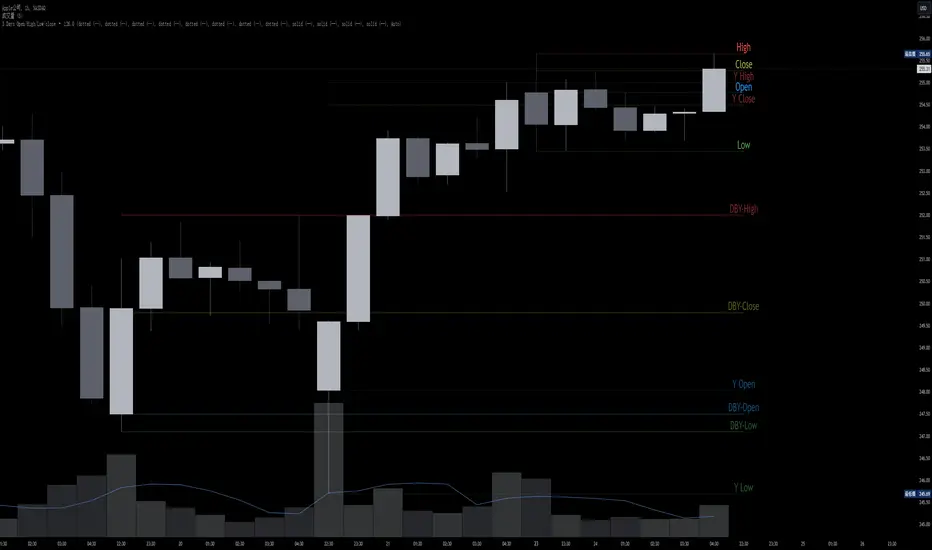
[ttcHugo] 3 Days OPEN/HIGH/LOW LINES It's a simple and basic tool for OPEN/HIGH/LOW lines in each day of recently 3 days. I will build more tools in the future. If you find it is useful for you please follow me and have any advise please contact me thank you.
Draw Line For High Low Custom Range Interactive█ OVERVIEW
This indicator is an educational indicator to make pine coders easier to how to use interactive inputs with User-Defined Type (UDT) especially when dealing input.time.
█ NOTES
This indicator is not perfect but it is a good starting point or template to start develop custom range interactive indicator.
█ INSPIRATIONS
ABC 123 Harmonic Ratio Custom Range Interactive
XABCD Harmonic Pattern Custom Range Interactive
PriceTimeInteractive
█ CREDITS
CAGR Custom Range
Pine scripts are now interactive
█ FEATURES
1. High Low points are determined based on points selected.
2. Line will be drawn after points are correctly arranged.
3. Label show error once wrong point is selected, move the point as instructed in example.
█ EXAMPLES / USAGE

Asymmetric Dispersion High Lowdear fellows,
this indicator is an effort to determine the range where the prices are likely to fall within in the current candle.
how it is calculated
1. obtain
a. gain from the open to the high
b. loss from the open to the low
in the last 20 (by default) candles and
in the last 200 (10*20 by default) candles
2. perform
a. the geometric average (sma of the log returns) over these gains and losses
b. their respective standard deviation
3. plot from the open of each candle
a. the average + 2 standard deviations (2 by default) of the short window size
b. same for the long window size (which is overlapped)
what it shows
1. where the current candle is likely to move with 95% likelyhood
how it can be interpreted
1. a gauge for volatility in the short and long term
2. a visual inbalance between likelyhood to go up or down according to dispersion in relation to current prices or candle open.
3. a confirmation of crossings of, for instance, support and resistances once the cloud is completely above or below.
in regard to bollinger bands (which are and excellent well proven indicator)
1. it segregates upward moves from the downward ones.
2. it is hardly crossed by prices
3. it is centered on the current candle open, instead of the moving average.
we welcome feedback and critic.
best regards and success wishes.

All-In-One Sessions, Weekly, Monday, Previous Highs/LowsWe are forever drawing key levels on our charts with saved drawing templates, but finding the levels, adding the labels, is all tedious stuff. We have indicators, but we have multiple different ones at a time.
What if you could just tick a box on/off?
Well now you can.
This all in one 'levels' indicator is designed to show all the key highs and lows from previous weeks, Monday, the current week, as well as an option to highlight the market sessions and their highs and lows.
There are lots of options available for extending lines and choosing their colors, so once you have set it up how you want, don't forget to save YOUR defaults.
Oorah.

Number of New Highs - Number of New Lows in US MarketShow numbers of new highs vs numbers of new lows for Nasdaq, NYSE and AMEA

High/Low/Open/Close Daily, Weekly, Monthly Line
I wrote this for the purpose of saving time while marking up charts by automating the process of drawing and labeling lines at areas of interest on larger
timeframes while still having the option to change the style and size of the lines and labels to adjust for any timeframe and avoid a messy chart.
I also used this as an exercise in menu organization giving users every imaginable option and producing clean readable code.
- This indicator draws a line on the Daily, Weekly, and Monthly bar at the High, Low, Open and Close of each bar as price
tends to react when revisiting these areas.
- Each set of bars has an optional identifying label with its own color set that can be shown with or without the lines
price value, and has drop down menus for size and style of each set of labels.
- Each set of lines has inputs for line/text color, line width and style, and can be hidden if the user doesn't have the need for any particular timeframe.
- Lines and Labels with delete when a new line is created.
- I recommend going into Chart Settings/Status Line and turning off indicator arguments OR moving the script to the top
of the indicator list to avoid an obstructed chart view with this indicators arguments. When Pine allows, I will update it to hide them.
Contains some public domain code from T.V. manuals and tutorial for creating drop down input menus for options.
/ ~For My Pal Jittery~
~ Who likes his clean chart and custom colors~

MTF Market Structure Highs and LowsThe indicator marks the last fractal highs and lows (W,D,4H and 1H options) to help determine current market structure. The script was created to help with directional bias but also as a MTF visual aid for stop hunts/liquidity raids.
Liquidity areas are where we assume trader's stop losses would be when buying or selling. Liquidity lies above and below swing points and institutions need liquidity to fill large orders.
Monitor price action as it hits these areas for a potential reversal trade.

Magic Band MA20 High LowMA 20 period Magic Band - based on Highs and Lows (as opposed to Close), can be used on any time frame for a better grip on price action.

Daily High & Low BoundaryDisplays the day's progressive high and low of the day colorized by the day of the week.

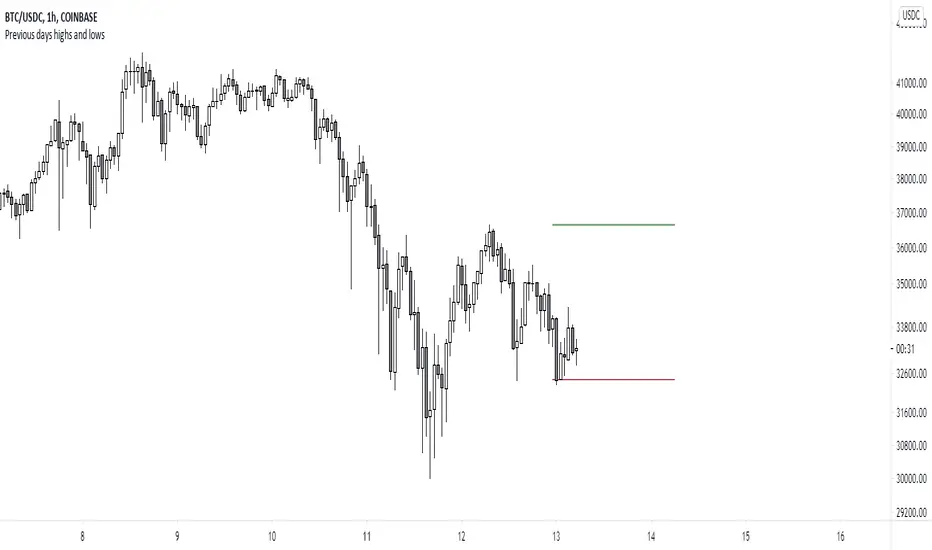
Previous days highs and lowsA script which marks a line pointing the highs and lows of the previous trading day.
High Low Rate Of ChangeAn experimental indicator using Pine Script Arrays. The indicators measures the rate of change of the highest highs and lowest lows. I call it the "High Low Rate of Change".
The H/L Rate of Change indicator finds the delta between the current highest high and previous highest high and after some filtering places these values into an array.
Same goes for the lowest lows.
In the end Sum it all up into the Histogram with optional smoothing using Exponential moving average (EMA).
==Colors==
Green: Up Trending.
Light Green: Weakening up trend.
Red: Down Trending.
Light Red Weakening Down Trending.
==Notes==
Bar colors are disabled by default.
Supports EMA smoothing (enabled by default).
Like if you Like and Enjoy!
Follow up for upcoming indicators: www.tradingview.com

Pivots High Low (HH/HL/LH/LL)/Trend [Anan] Hello Friends,,
This is pivot points high low with pivot trend to define the trend direction.
Pivot trend is the pivot points average.
Options:
- Pivot Point Period
- Show/hide Pivot Points Labels
- Show/hide Bull/Bear Labels ( depends on pivot trend)
- Show/hide Pivot Center Line (Bull>Center, Bear
