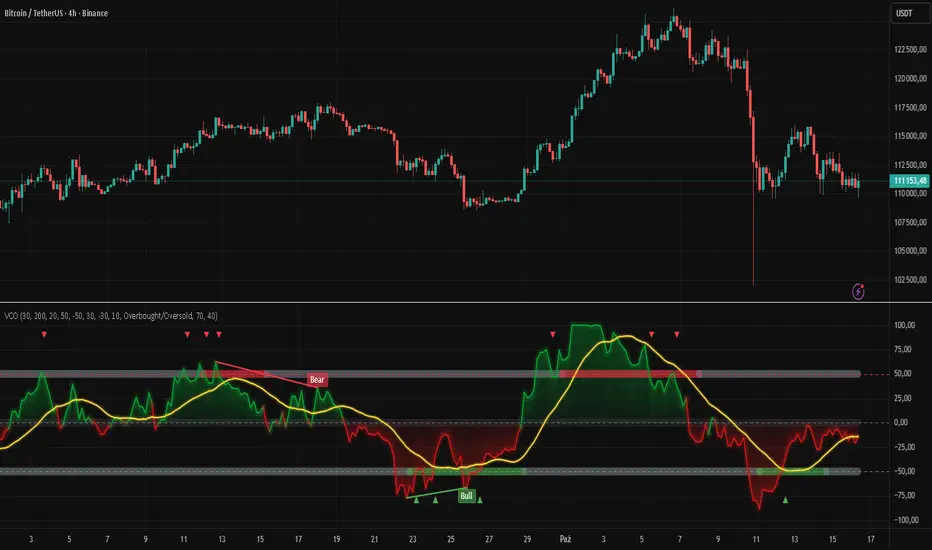
Volatility Channel Oscillator█ OVERVIEW
"Volatility Channel Oscillator" is a technical indicator that analyzes price volatility relative to dynamic price channels, displaying an oscillator, its moving average, and signals based on crossovers and divergences. The indicator offers customizable overbought and oversold levels, gradient visualization, and divergence detection, supported by alerts for key signals.
█ CONCEPTS
The VCO indicator creates dynamic price channels based on a moving average of the price (calculated as the arithmetic mean of the high and low prices: (high + low) / 2) and market volatility (measured as the average candle range and body size). These channels are not displayed on the chart but are used to calculate the oscillator value, which reflects the position of the closing price relative to the channel width, scaled to a range from -100 to +100, with the zero line as the central point. A moving average of the oscillator (SMA) smooths its values, enabling signals based on crossovers with the zero line or overbought/oversold levels. The indicator also detects divergences between price and the oscillator, which may indicate potential trend reversals. VCO is useful for identifying market momentum, reversal points, and trend confirmation, especially when combined with other technical analysis tools.
█ FEATURES
- Volatility Channels: Calculates invisible chart boundaries based on a simple moving average (SMA) of the price (high + low) / 2 and volatility (average candle range and body). The length parameter (default 30) sets the SMA length, and scale (default 200%) adjusts the channel width.
- Oscillator: Determines the oscillator value in the range of -100 to +100, indicating the closing price's position relative to the volatility channel. Displayed with dynamic coloring (green for positive values, red for negative).
- Oscillator Moving Average: A simple moving average (SMA) of the oscillator values, smoothing its movements. The signalLength parameter (default 20) defines the SMA length. Displayed in yellow with an optional gradient.
- Overbought/Oversold Levels: Configurable thresholds for the oscillator (overbought, default 50; oversold, default -50) and its moving average (maOverbought, default 30; maOversold, default -30), shown as horizontal lines with optional gradients. Band colors change dynamically (red for overbought, green for oversold, gray for neutral) based on the moving average's position relative to maOverbought/maOversold, reinforcing other signals.
- Divergences: Detects bullish (price forms a lower low, oscillator a higher low) and bearish (price forms a higher high, oscillator a lower high) divergences using pivots (pivotLength, default 2). Divergences are displayed with a delay equal to the pivot length; larger lengths increase reliability but delay signals. Use as additional confirmation.
Signals:
- Overbought/Oversold Crossovers: Green triangles (buy) when the oscillator crosses above the oversold level, red triangles (sell) when it crosses below the overbought level.
- Zero Line Crossovers: Buy/sell signals when the oscillator crosses the zero line upward (buy) or downward (sell).
- Moving Average Crossovers: Buy/sell signals when the oscillator's moving average crosses the zero line or the maOverbought/maOversold levels. Dynamic band color changes (red/green) at these crossovers reinforce other signals.
- Visualization: Gradient lines for the oscillator, its moving average, overbought/oversold levels, and zero line, with adjustable transparency. Gradient fill between the oscillator and zero line.
Divergence Labels: "Bull" (bullish) and "Bear" (bearish) labels with customizable color and transparency.
- Alerts: Built-in alerts for divergences, overbought/oversold crossovers, and zero line crossovers by the oscillator and its moving average.
█ HOW TO USE
Add to Chart: Apply the indicator via Pine Editor or the Indicators menu on TradingView.
Configure Settings:
- Channel and Oscillator Settings: Adjust the channel SMA length (length, default 30) and channel scaling (scale, default 200%). Increase scale for high-volatility markets.
- Threshold Levels: Set oscillator overbought (overbought, default 50) and oversold (oversold, default -50) levels, and moving average thresholds (maOverbought, default 30; maOversold, default -30).
- Divergence Settings: Enable/disable divergence detection (calculateDivergence) and set pivot length (pivotLength, default 2). Larger values increase reliability but delay signals.
- Signal Settings: Choose signal types (signalType): overbought/oversold, zero line, moving average, or all.
- Styling: Customize colors for the oscillator, moving average, horizontal levels, and divergence labels. Adjust gradient and fill transparency.
Interpreting Signals:
- Buy Signals: Green triangles below the bar when the oscillator or its moving average crosses above the oversold level or zero line.
- Sell Signals: Red triangles above the bar when the oscillator or its moving average crosses below the overbought level or zero line.
- Moving Average Signals: Green/red triangles when the moving average crosses maOverbought/maOversold levels, indicating potential reversals or trend continuation. Dynamic band color changes (red for overbought, green for oversold) at these crossovers reinforce other signals.
- Divergences: "Bull" (bullish) and "Bear" (bearish) labels indicate potential trend reversals with a delay based on pivot length. Use as confirmation.
- Overbought/Oversold Levels: Monitor price reactions in these zones as potential reversal points. Dynamic band color changes based on the moving average reinforce signals.
Signal Confirmation: Use VCO with other tools, such as pivot levels (for key turning points) or Fibonacci levels (for support/resistance zones).
█ APPLICATIONS
- Trend Trading: Zero line crossovers by the oscillator or its moving average identify momentum in uptrends or downtrends.
- Range Trading: Overbought/oversold levels help identify entry/exit points in sideways markets.
- Divergences: Use bullish/bearish divergences as additional confirmation of reversals, especially near key price levels.
- Trend Identification: To analyze trends over a longer perspective, increase the moving average length (signalLength) for more stable signals.
█ NOTES
- Test the indicator across different timeframes and markets to optimize parameters, such as length and scale, for your trading style.
- In strong trends, overbought/oversold levels may persist, requiring additional signal verification.
- Divergences are more reliable on higher timeframes (H4, D1), where market noise is reduced, but their delay requires caution.
- In low-liquidity markets, signals may be less effective, so use on high-liquidity assets is recommended.
Wyszukaj w skryptach "liquidity"
First-Move-Wrong Toolkit [CHE] First-Move-Wrong Toolkit — Session-bound sweep rejection with structure confirmation
Summary
This indicator marks potential “first move wrong” reversals during a defined trading session. It looks for a quick sweep beyond the prior day high or low, or the opening range high or low, followed by rejection and a basic structure confirmation. Optional rules require a retest and a VWAP reclaim in the direction of the trade idea. The script renders session levels as right-extended lines, signals as labels, optional SL/TP guide lines for visualization, and background tints during sweep events. Pivots are confirmed using swing width, which reduces repaint risk compared to live swings.
Motivation: Why this design?
Intraday reversals often start with a liquidity sweep around obvious highs or lows. Acting on the sweep alone can be noisy, while waiting for structure break and a retest can be slow. This tool balances both by checking a sweep and rejection at session-relevant levels, then requiring a simple structure cue and, optionally, a retest and a VWAP filter. The goal is a clear, rule-based signal layer that is easy to audit on chart without hidden state.
What’s different vs. standard approaches?
Baseline reference: Simple sweep detectors or basic CHOCH markers that ignore session context and liquidity anchors.
Architecture differences:
Session-aware opening range tracking that finalizes after the chosen minutes from session start.
Daily previous high and low pulled without lookahead, then extended forward as visual anchors.
Confirmed pivot highs and lows to avoid repaint from live, unconfirmed swings.
Optional retest rule using crossover or crossunder at the trigger level.
Optional VWAP filter to demand reclaim in the intended direction.
Global label cooldown to prevent clusters of signals.
Practical effect: Fewer one-off flips around noisy levels, clearer alignment with session structure, and compact visual feedback through lines, labels, and tints.
How it works (technical)
Levels: During the defined session, the script builds an opening range high and low until the configured minute mark after session start, then freezes those levels for the day. It also fetches the previous day high and low from the daily timeframe without lookahead and extends them forward.
Sweep and rejection: A sweep is defined as price moving beyond a target level and then rejecting back inside on the same bar. The script checks this condition separately for highs and lows against opening range and previous-day levels.
Structure validation: Confirmed pivot highs and lows are computed using a symmetric swing width. A bearish idea requires a prior sweep of a high plus a break through the last confirmed swing low. A bullish idea requires a prior sweep of a low plus a break through the last confirmed swing high.
Optional retest: If enabled, a bearish signal needs a cross under the bearish trigger level; a bullish signal needs a cross over the bullish trigger level.
VWAP filter (optional): The script requires a reclaim of VWAP in the intended direction when enabled.
State handling: Opening range values, previous-day lines, and the label cooldown timestamp are stored in persistent variables. Lines are created once and updated each bar to extend forward.
Repaint considerations: Pivots confirm only after the specified swing width, reducing repaint. The daily level request is performed without lookahead. Signals use closed-bar checks implied by crossover and crossunder logic.
Parameter Guide
Session (local) — Defines the active trading window. Default nine to seventeen. Narrower windows focus on the main session drive.
Opening Range (min) — Minutes from session start to finalize OR levels. Default fifteen. Shorter values react faster; longer values stabilize levels.
Use PrevDay H/L levels — Toggle previous-day anchors. On by default.
Use OR H/L levels — Toggle opening range anchors. On by default.
Equal H/L tolerance (ticks) — Intended tolerance for equal highs or lows. Default one. (Unknown/Optional) in current signals.
Swing width — Bars on both sides for confirmed pivots. Default two. Larger values reduce noise but confirm later.
Require CHOCH after sweep — Enforces structure break after a sweep. On by default.
Prefer retest entries — Requires crossover or crossunder of the trigger level. On by default.
VWAP filter — Demands a reclaim of VWAP in signal direction. Off by default.
TP in R (guide) — Multiplier for visual TP guides. Default one. Visualization only.
Show levels / Show signals / Show R-guides — Rendering toggles. R-guides are visual aids, not orders.
Label cooldown (bars) — Minimum bars between labels. Default five. Higher values reduce clusters.
Palette inputs — Colors and transparencies for levels, labels, VWAP, and tints.
Reading & Interpretation
Lines: Dotted lines represent opening range high and low after the OR window completes. Dashed lines represent previous-day high and low.
Signals: “Long” labels appear after a low-side sweep with rejection and structure confirmation, subject to optional retest and VWAP rules. “Short” labels mirror this on the high side.
Background tints: Red-tinted bars indicate a high-side sweep and rejection. Green-tinted bars indicate a low-side sweep and rejection.
R-guides: Circles display a visual stop level at the bar extreme and a target guide based on the selected multiple. They are informational only.
Practical Workflows & Combinations
Session reversal scans: During the first hour, watch for sweeps around previous-day or opening range levels, then wait for structure confirmation and optional retest.
Trend following with filters: Combine signals with higher-timeframe structure or a moving average regime check. Ignore signals against the dominant regime.
Exits and stops: Use the visual stop as a reference near the sweep extreme; adapt the target guide to volatility and market conditions.
Multi-asset / Multi-TF: Works on intraday timeframes for liquid futures, indices, forex, and large-cap equities. Start with default settings and adjust swing width and OR minutes to instrument volatility.
Behavior, Constraints & Performance
Repaint/confirmation: Pivots confirm after the swing window completes. Signals occur only when conditions are met on closed bars.
security()/HTF: Daily previous-day levels are requested without lookahead to reduce repaint.
Resources: Uses persistent variables and line updates per bar; no heavy loops or arrays.
Known limits: Signals can arrive later when swing width is large. Gaps around session boundaries may distort OR levels. VWAP behavior may vary with partial sessions or illiquid assets.
Sensible Defaults & Quick Tuning
Starting point: Session nine to seventeen, opening range fifteen minutes, swing width two, CHOCH required, retest on, VWAP off, cooldown five bars.
Too many flips: Increase swing width, enable VWAP filter, or raise label cooldown.
Too sluggish: Reduce swing width or shorten the opening range window.
Too many session-level hits: Disable either previous-day levels or opening range levels to simplify context.
What this indicator is—and isn’t
This is a session-aware visualization and signal layer focused on sweep-plus-structure behavior. It is not a complete trading system and does not manage orders, risk, or portfolio exposure. Use it with market structure, risk limits, and execution rules that fit your process.
Disclaimer
The content provided, including all code and materials, is strictly for educational and informational purposes only. It is not intended as, and should not be interpreted as, financial advice, a recommendation to buy or sell any financial instrument, or an offer of any financial product or service. All strategies, tools, and examples discussed are provided for illustrative purposes to demonstrate coding techniques and the functionality of Pine Script within a trading context.
Any results from strategies or tools provided are hypothetical, and past performance is not indicative of future results. Trading and investing involve high risk, including the potential loss of principal, and may not be suitable for all individuals. Before making any trading decisions, please consult with a qualified financial professional to understand the risks involved.
By using this script, you acknowledge and agree that any trading decisions are made solely at your discretion and risk.
Do not use this indicator on Heikin-Ashi, Renko, Kagi, Point-and-Figure, or Range charts, as these chart types can produce unrealistic results for signal markers and alerts.
Best regards and happy trading
Chervolino

ALMASTO – Pro Trend & Momentum (v1.1)ALMASTO — Pro Trend & Momentum Strategy
Description:
This strategy is designed for precision trading in both Forex (FX) and Crypto markets.
It combines multi-timeframe trend confirmation (EMA200), momentum filters (RSI, MACD, ADX), and ATR-based dynamic risk management.
ALMASTO — Pro Trend & Momentum Strategy automatically manages take-profit levels, stop-loss, and breakeven adjustments once TP1 is reached — providing a structured and emotion-free trading approach.
Optimal Use
Works best on lower timeframes (5m–15m) with strong liquidity sessions.
Optimized for pairs like EURUSD, XAUUSD, and BTCUSDT.
Built for trend-following setups and momentum reversals with high volatility confirmation.
Recommended Settings
🔹 Forex – 5m
EMA Fast = 34, EMA Slow = 200, HTF = 1H
RSI (14): Long ≥ 55 / Short ≤ 45
MACD (8 / 21 / 5), ADX Len 10 / Min 27
ATR Len 7, Stop Loss = ATR × 2.1
TP1 = 1.1 RR, TP2 = 2.3 RR
Session = 07:00–11:00 & 12:30–16:00 (Exchange Time)
Risk = 0.8% per trade
🔹 Forex – 15m
EMA Fast = 50, EMA Slow = 200, HTF = 4H
RSI (14): Long ≥ 53 / Short ≤ 47
MACD (12 / 26 / 9), ADX Min 24
ATR Len 10, SL = ATR × 1.9
TP1 = 1.2 RR, TP2 = 2.6 RR
Risk = 1.0% per trade
🔹 Crypto – 5m (BTC/USDT)
EMA Fast = 34, EMA Slow = 200, HTF = 4H
RSI (14): Long ≥ 56 / Short ≤ 44
MACD (8 / 21 / 5), ADX Min 30
ATR Len 7, SL = ATR × 2.2
TP1 = 1.0 RR, TP2 = 2.5 RR
Session = 00:00–06:00 & 12:00–22:00 (UTC)
Risk = 0.5% per trade
Core Features
✅ Auto breakeven after TP1
✅ Dual take-profit system (1:1 & 1:2 RR)
✅ ATR-based stop & trailing logic
✅ Filters for session time, volume, and volatility
✅ Candle-body vs ATR size filter to avoid noise
✅ Optional cooldown between trades
Important Notes
Use bar close confirmation only (barstate.isconfirmed) to avoid repainting on lower timeframes.
Adjust commission (0.01–0.03%) and slippage (1–2 ticks) in Strategy Tester for realistic results.
Avoid low-liquidity hours (after 21:00 UTC for FX / after midnight for crypto).
Backtest using realistic broker data (e.g., BlackBull Markets / Bybit / Binance Futures).
Best results occur during London & New York sessions with moderate volatility.
⚠️ Disclaimer
This script is for educational and research purposes only.
It does not constitute financial advice.
Use proper risk management and test thoroughly before using on live accounts.
Developed by KING FX Labs
Built and optimized by Yousef Almasto — combining advanced price-action logic, multi-timeframe EMA structure, and volatility-adaptive ATR management.
Tested across Forex, Gold, and Crypto markets to ensure consistent performance and minimal drawdown.
📈 “Precision Trading. Zero Emotion. Pure Momentum.”

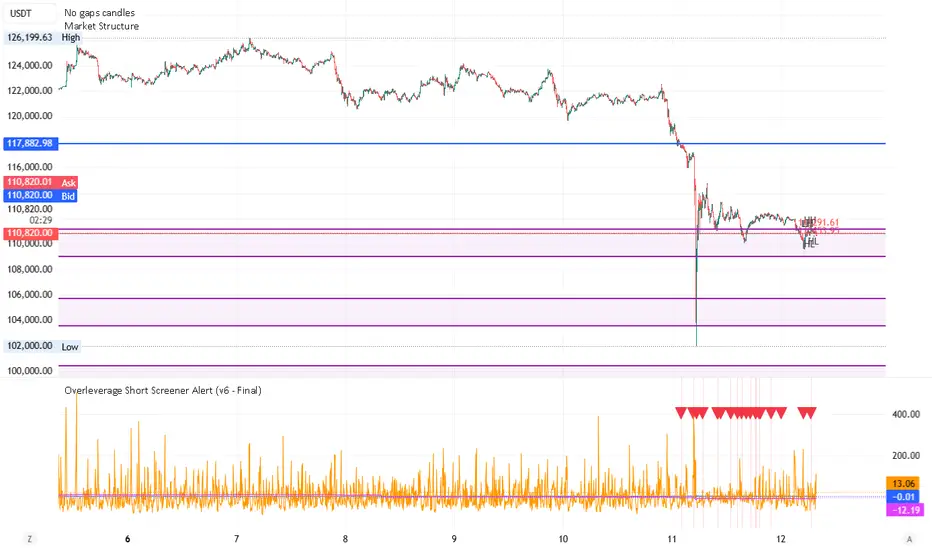
Overleverage Short Screener Alert Overleverage Short Screener Alert Guide (inspired by a posting "an on-chain trader nicknamed "Calm Order King" has reportedly made over $10 million in porfit this month - mainly by shorting BTC and SOL at precise reversal points", this script tries to guess his work.
🎯 Purpose of the Script
The script aims to identify potential **shorting opportunities** in derivatives markets (Perpetual Futures).
It looks for a setup often associated with a "long squeeze" or "blow-off top" by checking three criteria simultaneously: **High Excitement**, **Liquidity Buildup**, and the start of a **Price Dip**.
***
### 🛠️ Customize Inputs (Settings)
Access the indicator's settings window to adjust the following values:
Funding Rate Threshold (%):** Controls the required bar momentum (proxy for excitement). *Adjust between 0.01 and 0.05.*
OI MA Period:** Sets the lookback period for the Open Interest/Volume trend. *Use 7 to 14.*
OI Spike % Above MA:** Defines how far above its trend the Volume/OI must be to signal high liquidity buildup. *Try 20.0 to 50.0.*
Price Drop % From X-Period High:** Sets the minimum percentage drop required from the recent high to confirm the setup. *Use 3.0 to 7.0.*
High Timeframe:** The period used to calculate the "recent high." *Use '7D' (7 Days) or '1D' (1 Day).*
***
🔔 Reading the Signal and Setting Alerts
Visual Signal (Short\_Alert):** A **red triangle down** will appear at the top of the indicator pane when all three conditions are met. The background will also turn light red.
Signal Confirmation:**
* The **FR Proxy % (Blue Line)** must be **above** its blue threshold line.
* The **OI Spike % (Orange Line)** must be **above** its orange threshold line.
* The **Price Drop % (Fuchsia Line)** must be **below** its fuchsia threshold line.
Setting Alerts:**
1. Click the **"Alert"** button (bell icon) on the chart.
2. Set the **Condition** to the indicator's name: **"Overleverage Short Screener Alert
3. Set the specific condition to: **"Overleverage Short Alert"**.
4. The default alert message includes the current percentage values for all three factors for quick review.
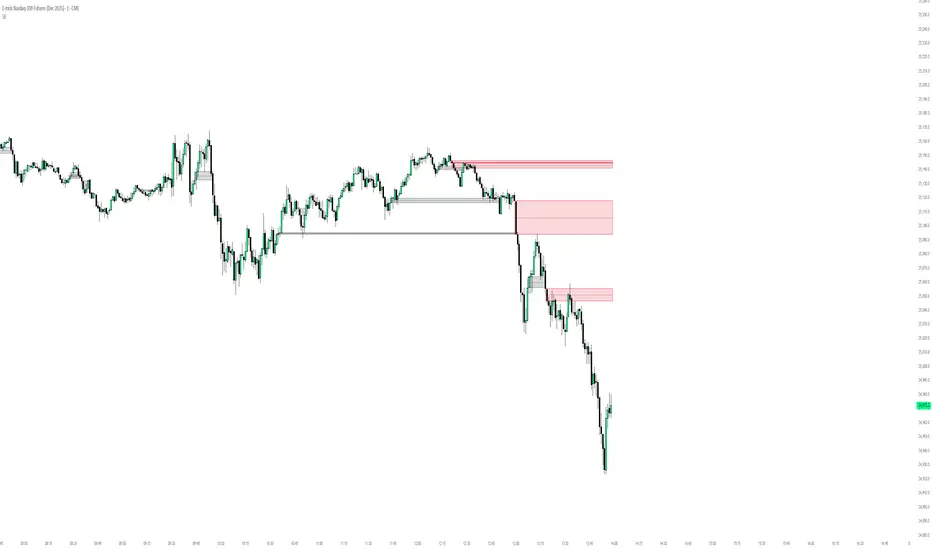
Daytrade Forex Scalper TwinPulse Auction Timer IndicatorWhat this indicator is
TwinPulse Auction Timer is a multi component execution aid designed for liquid markets. It looks for two families of opportunities
Breakouts that leave a compression area after a fresh sweep
Reversals that trigger after a sweep with strong wick polarity
It does not try to predict future prices. It measures present auction conditions with transparent rules and shows you when those conditions align. You get a simple table that says LONG SHORT or WAIT, optional session shading, clean entry and exit level visuals, and alerts you can wire to your workflow.
Why it is different
Most tools show a single signal. TwinPulse combines several independent signals into an Edge Score that you can tune. The components are
• Pulse. A signed measure of wick asymmetry with candle body direction
• Compression. Current true range compared with an average range
• Sweep timer. Bars elapsed since the most recent sweep of a prior high or low
• Bias. Direction of a higher timeframe candle
• Regime. Efficiency ratio and the relation of micro to macro volatility
• Location. Distance from the daily anchored VWAP
• Session. London and New York filter by time windows
Each component is visible in the inputs and in the table so you can understand why a suggestion appears. The script uses request.security() with lookahead off in all calls so it does not peek into the future. Shapes may move while a bar is open since price is still forming. They stop moving when the bar closes.
What you will see on the chart
• L and S shapes on entry bars
• An Exit shape at the price where a stop or the runner target would have been hit
• Four horizontal lines while a trade is active
Entry
Stop
TP1 at one R
TP2 at the runner target expressed in R
• Labels anchored to each line so you can instantly read Entry SL TP1 and TP2 with current values
• Optional shading during your session windows
• Optional daily VWAP line
The table in the top right shows
Action LONG SHORT IN LONG IN SHORT or WAIT
Session ON or OFF
Bias UP DOWN or FLAT
Pulse value
Compression value
Edge L percent and Edge S percent
How it works in detail
Pulse
For each bar the script measures up wick minus down wick divided by range and multiplies that by the sign of the candle body. The result is averaged with pulse_len. Positive numbers indicate aggressive buying. Negative numbers indicate aggressive selling. You control the minimum absolute value with pulse_thr.
Compression
Compression is the ratio of current range to an average range. You can choose the range basis. HL SMA uses simple high minus low smoothed by range_len. ATR uses classic True Range smoothed by atr_len. Values below comp_thr indicate a coil.
Sweeps and the timer
A sweep occurs when price trades beyond the highest high or lowest low seen in the previous sweep_len bars. A strict sweep requires a close back inside that prior range. The timer measures how many bars have elapsed since the last sweep. Breakout setups require the timer to exceed timer_thr.
Bias on a confirmation timeframe
A higher timeframe candle is read with confirm_tf. If close is above open bias is UP. If close is below open bias is DOWN. This keeps breakouts aligned with the prevailing drift.
Regime filters
Efficiency ratio measures the straight line change over the sum of absolute bar to bar changes over er_len. It rises in trendy conditions and falls in noise. Minimum efficiency is controlled by er_min.
Micro to macro volatility ratio compares a short lookback average range with a longer lookback average range using your chosen basis. For breakouts you usually want micro volatility to be near or above macro hence mvr_min. For reversals you often want micro volatility that is not overheated relative to macro hence mvr_max_rev.
VWAP distance gate
Daily anchored VWAP is rebuilt from the open of each session. The script computes the absolute distance from VWAP in units of your average range and requires that distance to exceed vwap_dist_thr when use_vwap_gate is true. This keeps entries away from the mean.
Edge Score
Each gate contributes a weight that you control. The script sums weights of the satisfied gates and divides by the sum of all weights to produce an Edge percent for long and an Edge percent for short. You can then require a minimum Edge percent using edge_min_pct. This turns the indicator into a step by step checklist that you can tune to your taste.
Using the indicator step by step
Choose markets and timeframes
The logic is designed for liquid instruments. Major currency pairs, index futures and cash index CFDs, and the most liquid crypto pairs work well. On intraday use one to fifteen minutes for signals and fifteen to sixty minutes for confirmation. On swing use one hour to one day for signals and one day for confirmation.
Decide on entry mode
Breakouts require a compression area and a sweep timer. Reversals require a strict sweep and a strong pulse. If you are unsure leave the default which allows both.
Pick a range basis
For FX and crypto HL SMA is often stable. For indices and single name equities with gaps ATR can adapt better. If results look too reactive increase the window. If results are too slow reduce it.
Tune regime filters
If you trade trend continuation raise er_min and mvr_min. If you trade counter rotation lower them and rely on the reversal path with the strict sweep condition.
Set the VWAP gate
Enabling it helps you avoid entries at the mean. Push the threshold higher on range bound days. Reduce it in strong trend days.
Table driven decision
Watch Action and the Edge percents. If the script says WAIT you can read Pulse and Compression to see what is missing. Often the best trades appear when both Edge percents are well separated and your session switch is ON.
Use the visuals
When a suggestion triggers you will see entry stop and targets. You can mirror the levels in your own workflow or use alerts.
Consider bar close
Signals are computed in real time. For a strict process you can wait until the bar closes to reduce noise.
Inputs explained with quick guidance
Setup
Signal TF chooses where the logic is computed. Leave blank to use the chart.
Confirm TF sets the higher timeframe for bias.
Session filter restricts signals to the London and New York windows you specify.
Invert flips long and short. It is useful on inverse instruments.
Logic options
Entry mode allows Breakouts Reversals or Both.
Average range basis selects HL SMA or ATR.
ATR length is used when ATR is selected.
Pulse source can be Regular OHLC or Heikin Ashi. Heikin Ashi smooths noisy series, but the script still runs on regular bars and you should publish and use it on standard candles to respect the platform guidance.
Core numeric settings
Sweep lookback controls the size of the liquidity pool targeted by the sweep condition.
Pulse window smooths the wick polarity measure.
Average range window controls your base range when you use HL SMA.
Pulse threshold sets the minimum polarity required.
Compression threshold sets the maximum current range relative to average to consider the market coiled.
Expansion timer bars sets how much time has passed since the last sweep before you allow a breakout.
Regime filters
Efficiency ratio length and minimum value keep you out of aimless drift.
Micro and Macro range lengths feed the micro to macro ratio.
Minimum micro to macro for breakouts and maximum micro to macro for reversals steer the two entry families.
VWAP gate and distance threshold keep you away from the mean.
Levels and trade management visuals
Runner target in R sets TP2 as a multiple of initial risk.
Stop distance as average range multiple sets initial risk size for the visuals.
Move stop to entry after one R touch turns on break even logic once price has traveled one risk unit.
Trail buffer as R fraction uses the last sweep as an anchor and keeps a dynamic stop at a chosen fraction of R beyond it.
Cooldown after exit prevents immediate re entries.
Edge Score
Weights for pulse compression timer bias efficiency ratio micro to macro VWAP gate and session let you align the checklist with your style.
Minimum Edge percent to suggest applies a final filter to LONG or SHORT suggestions.
UI
Table and markers switch the compact dashboard and the shapes.
TP and SL lines and labels draw and name each level.
TP1 partial label percent is printed in the TP1 label for clarity.
Session shading helps with focus.
Daily VWAP line is optional.
Alerts
The script provides alerts for Long Short Exit and for Edge percent crossing the threshold on either side. Use them to drive notifications or to sync with webhooks and your broker integration. Alerts trigger in real time and will repaint during a bar. For conservative use trigger on bar close.
Recommended presets
Intraday trend continuation
Confirm TF fifteen minutes
Entry mode Breakouts
Range basis HL SMA
Pulse threshold near 0.10
Compression threshold near 0.60
Timer around 18
Minimum efficiency ratio near 0.20
Minimum micro to macro near 1.00
VWAP gate enabled with distance near 0.35
Edge minimum 50 or higher
Intraday mean reversion at sweeps
Entry mode Reversals
Pulse source Regular OHLC
Compression threshold can be a little higher
Maximum micro to macro near 1.60
Efficiency ratio minimum lower near 0.12
VWAP gate enabled
Edge minimum 40 to 60
Swing trend continuation
Signal TF one hour
Confirm TF one day
Range basis ATR
ATR length around 14
Average range window 20 to 30
Efficiency ratio minimum near 0.18
Micro to macro windows 12 and 60
Edge minimum 50 to 70
These are starting points only. Your instrument and timeframe will require small adjustments.
Limitations and honest warnings
No indicator is perfect. TwinPulse will mark attractive conditions that do not always lead to profitable trades. During economic releases or very thin liquidity the assumptions behind compression and sweeps may fail. In strong gap environments the HL SMA basis may lag while ATR may overreact. Heikin Ashi pulse can help in choppy markets but it will lag during sharp reversals. Session times use the exchange time of your chart. If you switch symbol or exchange verify the windows.
Edge percent is not a probability of profit. It is the fraction of satisfied gates with your chosen weights. Two traders can set different weights and see different Edge readings on the same bar. That is the design. The score is a guide that helps you act with discipline.
This indicator does not place orders or manage real risk. The lines and labels show a model entry a model stop and two model targets built from the average range at entry and from recent swing points. Use them as references and not as hard rules. Always test on historical data and demo first. Past results do not guarantee anything in the future.
Credits and originality
All code in this publication is original and written for this indicator. The concept of the efficiency ratio originates from Perry Kaufman. The use of a daily anchored volume weighted average price is a standard industry tool. The specific combination of pulse from wick polarity strict sweep timing compression and the tunable Edge Score is unique to this script at the time of publication. If you reuse parts of the open source code in your own work remember to credit the author and contribute meaningful improvements.
How to read the table at a glance
Action reflects your current state.
IN LONG or IN SHORT appears while a trade is active.
LONG or SHORT appears when conditions for entry are met and the Edge threshold is satisfied.
WAIT appears when at least one gate is missing.
Session shows ON during your chosen windows.
Bias shows the color of the confirmation candle.
Pulse is the smoothed polarity number.
Comp shows current range divided by the average range. Values below one mean compression.
Edge L percent and Edge S percent show the long and short checklists as percents.
Final thoughts
Markets move because orders accumulate at certain prices and at certain times. The indicator tries to measure two things that often matter at those turning points. One is the existence of a hidden imbalance revealed by wick polarity and by sweeps of prior extremes. The other is the presence of energy stored in a coil that can release in the direction of a drift. Neither force guarantees profit. Together they can improve your selection and your timing.
Use the defaults for a few days so you learn the personality of the signals. After that adjust one group at a time. Start with the session filter and the Edge threshold. Then tune compression and the timer. Finally adjust the regime filters. Keep notes. You will learn which weights matter for your market and timeframe. The result is a process you can apply with consistency.
Disclaimer
This script and description are for education and analysis. They are not investment advice and they do not promise future results. Use at your own risk. Test thoroughly on historical data and in simulation before considering any live use.

ULTIMATE Smart Trading Pro 🔥
## 🇬🇧 ENGLISH
### 📊 The Most Complete All-in-One Trading Indicator
**ULTIMATE Smart Trading Pro** combines the best technical analysis tools and Smart Money Concepts into a single powerful and intelligent indicator. Designed for serious traders who want a real edge in the markets.
---
### ✨ KEY FEATURES
#### 💰 **SMART MONEY CONCEPTS**
- **Order Blocks**: Automatically detects institutional zones where "smart money" enters positions
- **Break of Structure (BOS)**: Identifies structure breaks to confirm trend changes
- **Liquidity Zones**: Spots equal highs/lows areas where institutions hunt stops
- **Market Structure**: Visually displays bullish (green background) or bearish (red background) structure
#### 📈 **ADVANCED TECHNICAL INDICATORS**
- **RSI with Auto Divergences**: Classic RSI + automatic detection of bullish and bearish divergences
- **MACD with Signals**: Identifies bullish and bearish crossovers in real-time
- **Dynamic Support & Resistance**: Adaptive zones with intelligent scoring based on volume, multiple touches, and ATR
- **Fair Value Gaps (FVG)**: Detects unfilled price gaps (imbalance zones)
#### 📐 **AUTOMATIC TOOLS**
- **Auto Fibonacci**: Automatically calculates Fibonacci retracement levels on the last major trend
- **Pivot Points**: Daily, Weekly, or Monthly pivot points (PP, R1, R2, S1, S2)
- **Pattern Finder**: Automatically detects candlestick patterns (Hammer, Shooting Star, Engulfing, Morning/Evening Star) and chart patterns (Double Top/Bottom)
---
### 🎯 HOW TO USE IT
#### Quick Setup:
1. **Add the indicator** to your chart
2. **Open Settings** and enable/disable modules as needed
3. **Adjust parameters** for your trading style (scalping, swing, day trading)
#### Optimal Trading Setup:
🔥 **ULTRA STRONG Signal** when you have:
- An institutional **Order Block**
- Aligned with a **Support/Resistance** tested 3+ times
- An unfilled **FVG** nearby
- An **RSI divergence** confirming the reversal
- On a key **Fibonacci** level (50%, 61.8%, or 78.6%)
- Favorable market structure (green background for buys, red for sells)
---
### 💡 UNIQUE ADVANTAGES
✅ **Adaptive Intelligence**: Automatically adjusts to market volatility (ATR)
✅ **Volume Filters**: Validates important levels with volume confirmation
✅ **Multi-Timeframe Ready**: Works on all timeframes (1m to 1M)
✅ **Complete Alerts**: Notifications for all important signals
✅ **Clear Interface**: Emojis and colored labels for quick identification
✅ **Intelligent Scoring**: Levels ranked by importance (🔴🔴🔴 = very strong)
✅ **100% Customizable**: Enable only what you need
---
### 🎨 SYMBOL LEGEND
**Smart Money:**
- 🟢 OB = Bullish Order Block
- 🔴 OB = Bearish Order Block
- BOS ↑/↓ = Break of Structure
- 💧 LIQ = Liquidity Zone
**Candlestick Patterns:**
- 🔨 = Hammer (bullish signal)
- ⭐ = Shooting Star (bearish signal)
- 📈 = Bullish Engulfing
- 📉 = Bearish Engulfing
- 🌅 = Morning Star (bullish reversal)
- 🌆 = Evening Star (bearish reversal)
**Indicators:**
- 🚀 MACD ↑ = Bullish crossover
- 📉 MACD ↓ = Bearish crossover
- ⚠️ DIV = Bearish RSI divergence
- ✅ DIV = Bullish RSI divergence
**Support & Resistance:**
- 🟢/🔴 S1, R1 = Support/Resistance
- 🟢🟢🟢/🔴🔴🔴 = VERY strong level (3+ touches)
- (×N) = Number of times touched
---
### ⚙️ RECOMMENDED SETTINGS
**For Scalping (1m - 5m):**
- SR Lookback: 15
- Structure Strength: 3
- RSI: 14
- Volume Filter: ON
**For Day Trading (15m - 1H):**
- SR Lookback: 20
- Structure Strength: 5
- RSI: 14
- All filters: ON
**For Swing Trading (4H - Daily):**
- SR Lookback: 30
- Structure Strength: 7
- Pattern Lookback: 100
- Fibonacci: ON
---
### 🚨 DISCLAIMER
This indicator is a decision support tool. It does not guarantee profits and does not constitute financial advice. Always test on a demo account before real use. Trading involves significant risks.
---
## 📞 SUPPORT & UPDATES
For questions, suggestions, or bug reports, please comment below or contact the author.
**Version:** 1.0
**Last Updated:** October 2025
**Compatible:** TradingView Pine Script v6
---
### 🌟 If you find this indicator useful, please give it a 👍 and share it with other traders!
**Happy Trading! 🚀📈**

ICT Suspension BlocksICT Suspension Block (SB) Indicator
The ICT Suspension Block (SB) is a three-candle price action pattern that often act as support or resistance zones. A Suspension Block is a three-candle pattern showing a brief pause in price efficiency before continuation. These zones frequently serve as areas where price may later return, offering traders potential trading opportunities.
Pattern Definition
A Suspension Block forms when three consecutive candles move in the same direction but leave behind a specific body-to-body imbalance. (a gap between the bodies of consecutive candles).
Bullish Suspension Block (+SB):
All three candles are bullish (close > open).
Candle 1 close < Candle 2 open.
Candle 2 close < Candle 3 open.
Zone = from Candle 1 close to Candle 3 open.
Bearish Suspension Block (-SB):
All three candles are bearish (close < open).
Candle 1 close > Candle 2 open.
Candle 2 close > Candle 3 open.
Zone = from Candle 1 close to Candle 3 open.
These zones mark areas where price was temporarily imbalanced. Price often “respects” these levels later, either bouncing from them or breaking through them, which can provide valuable trade context.
Application
Suspension Blocks are used to mark areas where price may later react:
A Bullish SB can act as potential support.
A Bearish SB can act as potential resistance.
The significance of a block depends on market context. Blocks formed during strong, impulsive moves tend to be more meaningful than those in consolidation.
How the Indicator Works
Identifies bullish and bearish suspension blocks using body gap imbalances.
Draws colored zones (green = bullish, red = bearish) directly on the chart.
Extends zones forward until they are inversed by price action.
Once inversed, zones switch to a neutral color, allowing traders to annotate/extend them manually if desired.
Includes Consequent Encroachment (CE) lines (the 50% equilibrium of the block), which many traders use as reaction levels.
Features
Customizable colors for bullish, bearish, and inversed zones
Extend blocks indefinitely forward or limit them to a set number of bars
Adjustable maximum number of displayed blocks for performance control
Consequent Encroachment (CE) (Middle Point, 50%, Equilibrium) line feature
Configurable CE line style, color, and width
How to Use It
Trend Following: Blocks forming in the direction of trend can act as continuation zones.
Reversals: Opposite-direction blocks may signal exhaustion and potential turning points.
Liquidity Levels: CE lines (50% of block) often serve as reaction levels for entries, partials, or stop placement.
Context is Key: Suspension Blocks should not be used in isolation. Combine them with market structure, liquidity pools, or other confluence factors for best results.
Notes
This indicator is intended for technical analysis and research.
It should always be combined with proper risk management and a complete trading plan.
Past market behavior does not guarantee future results.
High Time Frame (HTF) Swing PointsIdentify and display swing highs and lows across multiple higher timeframes on a chart, overlaying horizontal lines and customizable labels at these swing points.
Timeframes
Five user-defined higher timeframes (default settings: 5-minute, 15-minute, 1-hour, 4-hour, and daily)
Manually show/hide individual timeframes
When chart’s timeframe is set higher than one of the five configured, the indicator will automatically hide it. This helps to prevent clutter when navigating between timeframes on the chart
Swing Levels
Configure the line color, opacity, width and weather it’s solid/dotted/dashed
Once swing levels are identified, the indicator will look for the chart candle where the line starts
When price crosses the swing level, the line will be terminated
Tags
Customize the tag text for each individual timeframe, using blank if a tag is not desired for that timeframe
A tag text color can be set for all tags or base it on the line color
Set tag text size based on: Auto, Tiny, Small, Normal, Large
Choose how far to the right of the line the tag text should appear, as an integer representing the size of a candle
Choose to clear the tag or leave it in place after price crosses a swing level
Use Cases
Visualize key swing points from higher timeframes to identify potential reversal or breakout zones
Identify possible low resistance liquidity run (LRLR) areas
Use swing points for stop placement or as targets or draws on liquidity

Dynamic Volume Trace Profile [ChartPrime]⯁ OVERVIEW
Dynamic Volume Trace Profile is a reimagined take on volume profile analysis. Instead of plotting a static horizontal histogram on the side of your chart, this indicator projects dynamic volume trace lines directly onto the price action. Each bin is color-graded according to its relative strength, creating a living “volume skeleton” of the market. The orange trace highlights the current Point of Control (POC)—the price level with maximum historical traded volume within the lookback window. On the right side, the tool builds a mini profile, showing absolute volume per bin alongside its percentage share, where the POC always represents 100% strength .
⯁ KEY FEATURES
Dynamic On-Chart Bins:
The range between highest high and lowest low is split into 25 bins. Each bin is drawn as a horizontal trace line across the lookback chart period.
Gradient Color Encoding:
Trace lines fade from transparent to teal depending on relative volume size. The more intense the teal, the stronger the historical traded activity at that level.
Automatic POC Highlight:
The bin with the highest aggregated volume is flagged with an orange line . This POC adapts bar-by-bar as volume distribution shifts.
Right-Side Volume Profile:
At the chart’s right edge, the script prints a box-style profile. Each bin shows:
• Total volume (absolute units).
• Percentage of max volume, in parentheses (POC bin = 100%).
This gives both raw and normalized context at a glance.
Adjustable Lookback Window:
The lookback defines how many bars feed the profile. Increase for stable HTF zones or decrease for responsive intraday distributions.
POC Toggle & Styling:
Optionally toggle POC highlighting on/off, adjust colors, and set line thickness for better integration with your chart theme.
⯁ HOW IT WORKS (UNDER THE HOOD)
Step Sizing:
over last 100 bars is divided by to calculate bin height.
Volume Aggregation:
For each bar in the , the script checks which bin the close falls into, then adds that bar’s volume to the bin’s counter.
Gradient Mapping:
Bin volume is normalized against the max volume across all bins. That value is mapped onto a gradient from transparent → teal.
POC Logic:
The bin with highest volume is colored orange both on the dynamic trace and in the right-side profile.
Right-Hand Profile:
Boxes are drawn for each bin proportional to volume / maxVolume × 50 units, with text labels showing both absolute volume and normalized %.
⯁ USAGE
Use the orange trace as the dominant “magnet” level—price often gravitates to the POC.
Watch for clusters of strong teal traces as areas of high acceptance; thin or faint zones mark low-liquidity gaps prone to fast moves.
On intraday charts, tighten lookback to reveal session-based distributions . For swing or position trading, expand lookback to surface more durable volume shelves.
Compare the right-side profile % to judge how “top-heavy” or “bottom-heavy” the current distribution is.
Use bright, intense color traces as context for confluence with structure, OBs, or liquidity hunts.
⯁ CONCLUSION
Dynamic Volume Trace Profile takes the traditional volume profile and fuses it into the body of price itself. Instead of a fixed sidebar, you see gradient traces layered directly on the chart, giving real-time context of where volume concentrated and where price may be drawn. With built-in POC highlighting, normalized % readouts, and an adaptive right-side profile, it offers both precision levels and market structure awareness in a cleaner, more intuitive form.

Volume Profile 3D (Zeiierman)█ Overview
Volume Profile 3D (Zeiierman) is a next-generation volume profile that renders market participation as a 3D-style profile directly on your chart. Instead of flat histograms, you get a depth-aware profile with parallax, gradient transparency, and bull/bear separation, so you can see where liquidity stacked up and how it shifted during the move.
Highlights:
3D visual effect with perspective and depth shading for clarity.
Bull/Bear separation to see whether up bars or down bars created the volume.
Flexible colors and gradients that highlight where the most significant trading activity took place.
This is a state-of-the-art volume profile — visually powerful, highly flexible, and unlike anything else available.
█ How It Works
⚪ Profile Construction
The price range (from highest to lowest) is divided into a number of levels (buckets). Each bar’s volume is added to the correct level, based on its average price. This builds a map of where trading volume was concentrated.
You can choose to:
Aggregate all volume at each level, or
Split bullish vs. bearish volume , slightly offset for clarity.
This creates a clear view of which price zones matter most to the market.
⚪ 3D Effect Creation
The unique part of this indicator is how the 3D projection is built. Each volume block’s width is scaled to its relative size, then tilted with a slope factor to create a depth effect.
maxVol = bins.bu.max() + bins.be.max()
width = math.max(1, math.floor(bucketVol / maxVol * ((bar_index - start) * mult)))
slope = -(step * dev) / ((bar_index - start) * (mult/2))
factor = math.pow(math.min(1.0, math.abs(slope) / step), .5)
width → determines how far the volume extends, based on relative strength.
slope → creates the angled projection for the 3D look.
factor → adjusts perspective to make deeper areas shrink naturally.
The result is a 3D-style volume profile where large areas pop forward and smaller areas fade back, giving you immediate visual context.
█ How to Use
⚪ Support & Resistance Zones (HVNs and Value Area)
Regions where a lot of volume traded tend to act like walls:
If price approaches a high-volume area from above, it may act as support.
From below, it may act as resistance.
Traders often enter or exit near these zones because they represent strong agreement among market participants.
⚪ POC Rejections & Mean Reversions
The Point of Control (POC) is the single price level with the highest volume in the profile.
When price returns to the POC and rejects it, that’s often a signal for reversal trades.
In ranging markets, price may bounce between edges of the Value Area and revert to POC.
⚪ Breakouts via Low-Volume Zones (LVNs)
Low volume areas (gaps in the profile) offer path of least resistance:
Price often moves quickly through these thin zones when momentum builds.
Use them to spot breakouts or continuation trades.
⚪ Directional Insight
Use the bull/bear separation to see whether buyers or sellers dominated at key levels.
█ Settings
Use Active Chart – Profile updates with visible candles.
Custom Period – Fixed number of bars.
Up/Down – Adjust tilt for the 3D angle.
Left/Right – Scale width of the profile.
Aggregated – Merge bull/bear volume.
Bull/Bear Shift – Separate bullish and bearish volume.
Buckets – Number of price levels.
Choose from templates or set custom colors.
POC Gradient option makes high volume bolder, low volume lighter.
-----------------
Disclaimer
The content provided in my scripts, indicators, ideas, algorithms, and systems is for educational and informational purposes only. It does not constitute financial advice, investment recommendations, or a solicitation to buy or sell any financial instruments. I will not accept liability for any loss or damage, including without limitation any loss of profit, which may arise directly or indirectly from the use of or reliance on such information.
All investments involve risk, and the past performance of a security, industry, sector, market, financial product, trading strategy, backtest, or individual's trading does not guarantee future results or returns. Investors are fully responsible for any investment decisions they make. Such decisions should be based solely on an evaluation of their financial circumstances, investment objectives, risk tolerance, and liquidity needs.

ATR Regime Study [CHE] ATR Regime Study — ATR percentile regimes with clear bands, table and live label
Summary
This study classifies volatility into five regimes by converting ATR into a percentile rank over a rolling window, plotted on a standardized scale between zero and one hundred. Colored bands mark regime thresholds, while a compact table and an optional label report the current percentile and regime. The standardized scale makes symbols and timeframes easier to compare than raw ATR values. Implemented in Pine v6 as a separate pane (overlay set to false), it is a context tool to adapt tactics and risk handling to the prevailing volatility environment.
Motivation: Why this design?
Raw ATR varies with price scale and asset characteristics, which makes regime comparison inconsistent and leads to poor transfer of settings across symbols and timeframes. The core idea is to transform ATR into a percentile rank within a user-defined lookback, then map it into discrete regimes. This yields a stable, interpretable context signal that shifts slower than raw ATR while still responding to genuine volatility changes.
What’s different vs. standard approaches?
Reference baseline: Traditional ATR plots or ATR bands using fixed multipliers.
Architecture differences:
Percentile ranking of ATR within a rolling window.
Five discrete regimes with fixed thresholds at ninety, seventy, thirty, and ten.
Visual fills between thresholds plus a live table and a last-bar label.
Practical effect: You read a single normalized line between zero and one hundred with consistent thresholds. This improves cross-asset comparison and makes regime shifts obvious at a glance.
How it works (technical)
The script computes ATR over a configurable length, then converts that series to a percentile rank over a configurable number of bars. The percentile is naturally scaled and limited between zero and one hundred. That value is mapped to one of five regimes: above ninety (Extreme), between seventy and ninety (Elevated), between thirty and seventy (Normal), between ten and thirty (Calm), and below ten (Squeeze). Horizontal guide lines mark the thresholds, and fills shade the regions. A table is created once and updated on each bar to show regime definitions and highlight the current row. An optional label on the last bar displays the current percentile and regime. No higher-timeframe requests are used, so repaint risk is limited to normal live-bar fluctuation until the bar closes.
Parameter Guide
ATR length — Effect: Controls how fast ATR reacts to new ranges. Default: fourteen. Trade-offs/Tips: Increase to reduce noise in choppy markets; decrease to react faster during regime changes.
Percentile window (bars) — Effect: Number of bars used for the percentile ranking. Default: two hundred fifty-two. Trade-offs/Tips: Larger windows stabilize the percentile but slow adaptation after structural regime shifts; smaller windows adapt faster but may flip more often.
Table › Show — Effect: Toggles the regime overview table. Default: enabled. Trade-offs/Tips: Disable on constrained layouts to reduce visual clutter.
Table › Position — Effect: Anchors the table in a chart corner. Default: Top Right. Trade-offs/Tips: Choose a corner that avoids overlapping other panels or drawings.
Label › Show — Effect: Toggles a last-bar label with current percentile and regime. Default: enabled. Trade-offs/Tips: Useful for quick reads; disable if it obscures other annotations.
Reading & Interpretation
The white line shows ATR percentile between zero and one hundred. Crossing above seventy signals an elevated volatility environment; above ninety indicates event-driven extremes. Between thirty and seventy represents typical conditions. Between ten and thirty indicates calm conditions that often suit mean reversion. Below ten reflects compression, where breakout probability often increases. The colored bands visually reinforce these ranges. The table summarizes regime definitions and highlights the current state. The last-bar label mirrors the current percentile and regime for quick inspection.
Practical Workflows & Combinations
Trend following: Prefer continuation tactics when the percentile holds in the Normal or Elevated bands and structure confirms higher highs and higher lows. Consider wider stops and partial position sizing as percentile rises.
Mean reversion: Favor fades in Calm regimes within defined ranges; use structure filters and time-of-day constraints to avoid low-liquidity whipsaws.
Breakout preparation: Track compressions below ten; plan entries only with structure confirmation and risk caps, since compressions can persist.
Multi-asset/Multi-TF: Defaults travel well on daily charts. For intraday, reduce the percentile window to align with session dynamics. Combine with trend or market structure tools for confirmation.
Behavior, Constraints & Performance
Repaint/confirmation: The percentile updates during live bars and stabilizes on close; closed bars do not repaint.
security/HTF: Not used. If you add higher-timeframe aggregation externally, account for standard repaint caveats.
Resources: Declared maximum bars back is two thousand; limits for lines and labels are five hundred each. A short loop updates the table rows; arrays are used for table content only.
Known limits: Regime boundaries are fixed; assets with persistent volatility shifts may require window retuning. Low-liquidity periods and gaps can produce abrupt percentile changes. ATR is direction-agnostic and should be paired with trend or structure context.
Sensible Defaults & Quick Tuning
Start with ATR length fourteen and percentile window two hundred fifty-two on daily charts.
Too many flips: Increase ATR length or increase the percentile window.
Too sluggish: Decrease the percentile window or reduce ATR length.
Intraday noise: Keep ATR length moderate and reduce the window to a session-appropriate size; optionally hide the label to declutter.
Compressed markets: Maintain defaults but rely more on structure and volume filters before acting.
What this indicator is—and isn’t
This is a volatility regime context layer that standardizes ATR into interpretable regimes. It is not a complete trading system, not predictive, and not a stand-alone entry signal. Use it alongside structure analysis, confirmation tools, and disciplined risk management.
Disclaimer
The content provided, including all code and materials, is strictly for educational and informational purposes only. It is not intended as, and should not be interpreted as, financial advice, a recommendation to buy or sell any financial instrument, or an offer of any financial product or service. All strategies, tools, and examples discussed are provided for illustrative purposes to demonstrate coding techniques and the functionality of Pine Script within a trading context.
Any results from strategies or tools provided are hypothetical, and past performance is not indicative of future results. Trading and investing involve high risk, including the potential loss of principal, and may not be suitable for all individuals. Before making any trading decisions, please consult with a qualified financial professional to understand the risks involved.
By using this script, you acknowledge and agree that any trading decisions are made solely at your discretion and risk.
Best regards and happy trading
Chervolino

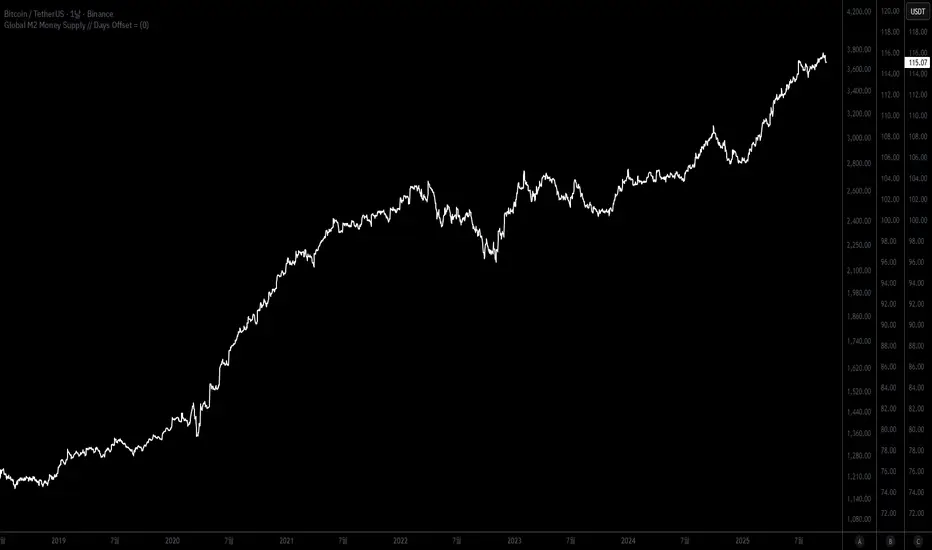
Global M2 Money SupplyThis indicator calculates and plots an aggregated estimate of the Global M2 money supply, expressed in U.S. dollar terms. It combines M2 data from major economies and regions—including the U.S., Eurozone, Canada, the U.K., Switzerland, China, Japan, India, Brazil, and others—and adjusts each by its respective FX rate to USD. By summing these series, the script provides a broad view of worldwide liquidity conditions in one line.
A user-defined offset in days allows you to shift the global M2 line forward or backward, making it easier to visually compare liquidity trends against asset prices such as Bitcoin, gold, or equities. This tool is designed for traders and macro observers who want to study how global money supply growth or contraction correlates with financial markets over time.
이 지표는 전 세계 주요 국가와 지역의 M2 통화량을 달러 기준으로 합산하여 글로벌 유동성 지표로 보여줍니다. 미국, 유로존, 캐나다, 영국, 스위스, 중국, 일본, 인도, 브라질 등 여러 지역의 M2 데이터를 각 통화의 환율(USD 환산)로 조정한 뒤 합산해 하나의 흐름으로 표현합니다. 이를 통해 글로벌 차원의 통화 공급 변화를 한눈에 파악할 수 있습니다.
또한 사용자가 지정한 일 단위 오프셋 기능을 통해 글로벌 M2 라인을 앞뒤로 이동시켜, 비트코인·금·주식 등 다양한 자산 가격과의 시차적 관계를 직관적으로 비교할 수 있습니다. 거시경제 환경과 자산시장 간의 상관성을 연구하거나 시장 유동성 추이를 모니터링하려는 투자자에게 유용한 도구입니다.
Initial Balance SMC-V3
Initial Balance SMC-V3 – An Advanced Mean Reversion Indicator for Index Markets
The Initial Balance SMC-V3 indicator is the result of continuous refinement in mean reversion trading, with a specific focus on index markets (such as DAX, NASDAQ, S&P 500, etc.). Designed for high-liquidity environments with controlled volatility, it excels at precisely identifying value zones and statistical reversal points within market structure.
🔁 Mean Reversion at Its Core
At the heart of this indicator lies a robust mean reversion logic: rather than chasing extreme breakouts, it seeks returns toward equilibrium levels after impulsive moves. This makes it especially effective in ranging markets or corrective phases within broader trends—situations where many traders get caught in false breakouts.
🎯 Signals Require Breakout + Confirmation
Signals are never generated impulsively. Instead, they require a clear sequence of confirmations:
Break of a key level (e.g., Initial Balance high/low or an SMC zone);
Price re-entry into the range accompanied by a crossover of customizable moving averages (SMA, EMA, HULL, TEMA, etc.);
RSI filter to avoid entries in overbought/oversold extremes;
Volatility filter (ATR) to skip low-volatility, choppy conditions.
This multi-layered approach drastically reduces false signals and significantly improves trade quality.
📊 Built-in Multi-Timeframe Analysis
The indicator features native multi-timeframe logic:
H1 / 15-minute charts: for structural analysis and identification of Supply & Demand zones (SMC);
M1 / M5 charts: for precise trade execution, with targeted entries and dynamic risk management.
SMC zones are calculated on higher timeframes (e.g., 4H) to ensure structural reliability, while actual trade signals trigger on lower timeframes for maximum precision.
⚙️ Advanced Customization
Full choice of moving average type (SMA, EMA, WMA, RMA, VWMA, HULL, TEMA, ZLEMA, etc.);
Revenge Trading logic: after a stop loss is hit without reaching the 1:1 breakeven level, the indicator automatically prepares for a counter-trade;
Dynamic ATR-based stop loss with customizable multiplier;
Session filters to trade only during optimal liquidity windows (e.g., European session).
🧠 Who Is It For?
This indicator is ideal for traders who:
Primarily trade indices;
Prefer mean reversion strategies over pure trend-following;
Seek a disciplined, rule-based system with multiple confluence filters;
Use a multi-timeframe approach to separate analysis from execution.
In short: Initial Balance SMC-V3 is more than just an indicator—it’s a complete trading framework for mean reversion on index markets, where every signal emerges from a confluence of statistical, structural, and temporal factors.
Happy trading! 📈

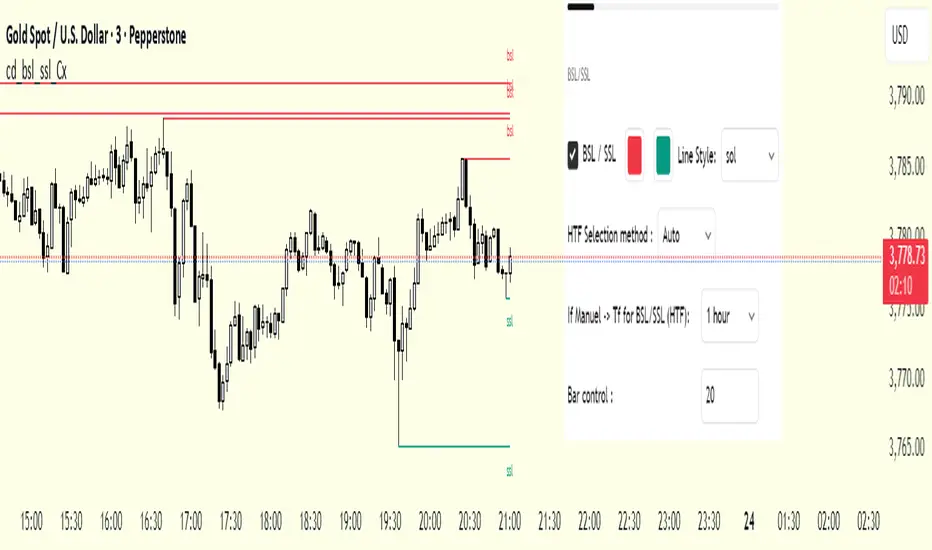
cd_bsl_ssl_CxGeneral
This indicator is designed to show the levels where stop-loss orders from buyers and sellers are most likely clustered.
Swing levels formed on the aligned higher time frame (HTF) are displayed on the chart as Buy Side Liquidity (BSL) and Sell Side Liquidity (SSL).
________________________________________
Menu & Usage
• HTF Selection:
o In “Auto” mode, the HTF is selected automatically.
o In “Manual” mode, the user can choose the HTF themselves.
• Bar Control:
By adjusting the bar control value, the user can define the number of bars required for a valid BSL or SSL sweep.
This option helps keep the number of alerts under control.
________________________________________
I’d be happy to hear your feedback and suggestions.
Happy trading! 🎉
SuperSmoother MA OscillatorSuperSmoother MA Oscillator - Ehlers-Inspired Lag-Minimized Signal Framework
Overview
The SuperSmoother MA Oscillator is a crossover and momentum detection framework built on the pioneering work of John F. Ehlers, who introduced digital signal processing (DSP) concepts into technical analysis. Traditional moving averages such as SMA and EMA are prone to two persistent flaws: excessive lag, which delays recognition of trend shifts, and high-frequency noise, which produces unreliable whipsaw signals. Ehlers’ SuperSmoother filter was designed to specifically address these flaws by creating a low-pass filter with minimal lag and superior noise suppression, inspired by engineering methods used in communications and radar systems.
This oscillator extends Ehlers’ foundation by combining the SuperSmoother filter with multi-length moving average oscillation, ATR-based normalization, and dynamic color coding. The result is a tool that helps traders identify market momentum, detect reliable crossovers earlier than conventional methods, and contextualize volatility and phase shifts without being distracted by transient price noise.
Unlike conventional oscillators, which either oversimplify price structure or overload the chart with reactive signals, the SuperSmoother MA Oscillator is designed to balance responsiveness and stability. By preprocessing price data with the SuperSmoother filter, traders gain a signal framework that is clean, robust, and adaptable across assets and timeframes.
Theoretical Foundation
Traditional MA oscillators such as MACD or dual-EMA systems react to raw or lightly smoothed price inputs. While effective in some conditions, these signals are often distorted by high-frequency oscillations inherent in market data, leading to false crossovers and poor timing. The SuperSmoother approach modifies this dynamic: by attenuating unwanted frequencies, it preserves structural price movements while eliminating meaningless noise.
This is particularly useful for traders who need to distinguish between genuine market cycles and random short-term price flickers. In practical terms, the oscillator helps identify:
Early trend continuations (when fast averages break cleanly above/below slower averages).
Preemptive breakout setups (when compressed oscillator ranges expand).
Exhaustion phases (when oscillator swings flatten despite continued price movement).
Its multi-purpose design allows traders to apply it flexibly across scalping, day trading, swing setups, and longer-term trend positioning, without needing separate tools for each.
The oscillator’s visual system - fast/slow lines, dynamic coloration, and zero-line crossovers - is structured to provide trend clarity without hiding nuance. Strong green/red momentum confirms directional conviction, while neutral gray phases emphasize uncertainty or low conviction. This ensures traders can quickly gauge the market state without losing access to subtle structural signals.
How It Works
The SuperSmoother MA Oscillator builds signals through a layered process:
SuperSmoother Filtering (Ehlers’ Method)
At its core lies Ehlers’ two-pole recursive filter, mathematically engineered to suppress high-frequency components while introducing minimal lag. Compared to traditional EMA smoothing, the SuperSmoother achieves better spectral separation - it allows meaningful cyclical market structures to pass through, while eliminating erratic spikes and aliasing. This makes it a superior preprocessing stage for oscillator inputs.
Fast and Slow Line Construction
Within the oscillator framework, the filtered price series is used to build two internal moving averages: a fast line (short-term momentum) and a slow line (longer-term directional bias). These are not plotted directly on the chart - instead, their relationship is transformed into the oscillator values you see.
The interaction between these two internal averages - crossovers, separation, and compression - forms the backbone of trend detection:
Uptrend Signal : Fast MA rises above the slow MA with expanding distance, generating a positive oscillator swing.
Downtrend Signal : Fast MA falls below the slow MA with widening divergence, producing a negative oscillator swing.
Neutral/Transition : Lines compress, flattening the oscillator near zero and often preceding volatility expansion.
This design ensures traders receive the information content of dual-MA crossovers while keeping the chart visually clean and focused on the oscillator’s dynamics.
ATR-Based Normalization
Markets vary in volatility. To ensure the oscillator behaves consistently across assets, ATR (Average True Range) normalization scales outputs relative to prevailing volatility conditions. This prevents the oscillator from appearing overly sensitive in calm markets or too flat during high-volatility regimes.
Dynamic Color Coding
Color transitions reflect underlying market states:
Strong Green : Bullish alignment, momentum expanding.
Strong Red : Bearish alignment, momentum expanding.
These visual cues allow traders to quickly gauge trend direction and strength at a glance, with expanding colors indicating increasing conviction in the underlying momentum.
Interpretation
The oscillator offers a multi-dimensional view of price dynamics:
Trend Analysis : Fast/slow line alignment and zero-line interactions reveal trend direction and strength. Expansions indicate momentum building; contractions flag weakening conditions or potential reversals.
Momentum & Volatility : Rapid divergence between lines reflects increasing momentum. Compression highlights periods of reduced volatility and possible upcoming expansion.
Cycle Awareness : Because of Ehlers’ DSP foundation, the oscillator captures market cycles more cleanly than conventional MA systems, allowing traders to anticipate turning points before raw price action confirms them.
Divergence Detection : When oscillator momentum fades while price continues in the same direction, it signals exhaustion - a cue to tighten stops or anticipate reversals.
By focusing on filtered, volatility-adjusted signals, traders avoid overreacting to noise while gaining early access to structural changes in momentum.
Strategy Integration
The SuperSmoother MA Oscillator adapts across multiple trading approaches:
Trend Following
Enter when fast/slow alignment is strong and expanding:
A fast line crossing above the slow line with expanding green signals confirms bullish continuation.
Use ATR-normalized expansion to filter entries in line with prevailing volatility.
Breakout Trading
Periods of compression often precede breakouts:
A breakout occurs when fast lines diverge decisively from slow lines with renewed green/red strength.
Exhaustion and Reversals
Oscillator divergence signals weakening trends:
Flattening momentum while price continues trending may indicate overextension.
Traders can exit or hedge positions in anticipation of corrective phases.
Multi-Timeframe Confluence
Apply the oscillator on higher timeframes to confirm the directional bias.
Use lower timeframes for refined entries during compression → expansion transitions.
Technical Implementation Details
SuperSmoother Algorithm (Ehlers) : Recursive two-pole filter minimizes lag while removing high-frequency noise.
Oscillator Framework : Fast/slow MAs derived from filtered prices.
ATR Normalization : Ensures consistent amplitude across market regimes.
Dynamic Color Engine : Aligns visual cues with structural states (expansion and contraction).
Multi-Factor Analysis : Combines crossover logic, volatility context, and cycle detection for robust outputs.
This layered approach ensures the oscillator is highly responsive without overloading charts with noise.
Optimal Application Parameters
Asset-Specific Guidance:
Forex : Normalize with moderate ATR scaling; focus on slow-line confirmation.
Equities : Balance responsiveness with smoothing; useful for capturing sector rotations.
Cryptocurrency : Higher ATR multipliers recommended due to volatility.
Futures/Indices : Lower frequency settings highlight structural trends.
Timeframe Optimization:
Scalping (1-5min) : Higher sensitivity, prioritize fast-line signals.
Intraday (15m-1h) : Balance between fast/slow expansions.
Swing (4h-Daily) : Focus on slow-line momentum with fast-line timing.
Position (Daily-Weekly) : Slow lines dominate; fast lines highlight cycle shifts.
Performance Characteristics
High Effectiveness:
Trending environments with moderate-to-high volatility.
Assets with steady liquidity and clear cyclical structures.
Reduced Effectiveness:
Flat/choppy conditions with little directional bias.
Ultra-short timeframes (<1m), where noise dominates.
Integration Guidelines
Confluence : Combine with liquidity zones, order blocks, and volume-based indicators for confirmation.
Risk Management : Place stops beyond slow-line thresholds or ATR-defined zones.
Dynamic Trade Management : Use expansions/contractions to scale position sizes or tighten stops.
Multi-Timeframe Confirmation : Filter lower-timeframe entries with higher-timeframe momentum states.
Disclaimer
The SuperSmoother MA Oscillator is an advanced trend and momentum analysis tool, not a guaranteed profit system. Its effectiveness depends on proper parameter settings per asset and disciplined risk management. Traders should use it as part of a broader technical framework and not in isolation.

Price Level Highlighter [ldlwtrades]This indicator is a minimalist and highly effective tool designed for traders who incorporate institutional concepts into their analysis. It automates the identification of key psychological price levels and adds a unique, dynamic layer of information to help you focus on the most relevant area of the market. Inspired by core principles of market structure and liquidity, it serves as a powerful visual guide for anticipating potential support and resistance.
The core idea is simple: specific price points, particularly those ending in round numbers or common increments, often act as magnets or barriers for price. While many indicators simply plot static lines, this tool goes further by intelligently highlighting the single most significant level in real-time. This dynamic feature allows you to quickly pinpoint where the market is currently engaged, offering a clear reference point for your trading decisions. It reduces chart clutter and enhances your focus on the immediate price action.
Features
Customizable Price Range: Easily define a specific Start Price and End Price to focus the indicator on the most relevant area of your chart, preventing unnecessary clutter.
Adjustable Increment: Change the interval of the lines to suit your trading style, from high-frequency increments (e.g., 10 points) for scalping to wider intervals (e.g., 50 or 100 points) for swing trading.
Intelligent Highlighting: A key feature that automatically identifies and highlights the single horizontal line closest to the current market price with a distinct color and thickness. This gives you an immediate visual cue for the most relevant price level.
Highly Customizabile: Adjust the line color, style, and width for both the main lines and the highlighted line to fit your personal chart aesthetic.
Usage
Apply the indicator to your chart.
In the settings, input your desired price range (Start Price and End Price) to match the market you are trading.
Set the Price Increment to your preferred density.
Monitor the chart for the highlighted line. This is your active price level and a key area of interest.
Combine this tool with other confirmation signals (e.g., order blocks, fair value gaps, liquidity pools) to build higher-probability trade setups.
Best Practices
Pairing: This tool is effective across all markets, including stocks, forex, indices, and crypto. It is particularly useful for volatile markets where price moves rapidly between psychological levels.
Mindful Analysis: Use the highlighted level as a reference point for your analysis, not as a standalone signal. A break above or below this level can signify a shift in market control.
Backtesting: Always backtest the indicator on your preferred market and timeframe to understand how it performs under different conditions.

Weekend Hunter Ultimate v6.2 Weekend Hunter Ultimate v6.2 - Automated Crypto Weekend Trading System
OVERVIEW:
Specialized trading strategy designed for cryptocurrency weekend markets (Saturday-Sunday) when institutional traders are typically offline and market dynamics differ significantly from weekdays. Optimized for 15-minute timeframe execution with multi-timeframe confluence analysis.
KEY FEATURES:
- Weekend-Only Trading: Automatically activates during configurable weekend hours
- Dynamic Leverage: 5-20x leverage adjusted based on market safety and signal confidence
- Multi-Timeframe Analysis: Combines 4H trend, 1H momentum, and 15M execution
- 10 Pre-configured Crypto Pairs: BTC, ETH, LINK, XRP, DOGE, SOL, AVAX, PEPE, TON, POL
- Position & Risk Management: Max 4 concurrent positions, -30% account protection
- Smart Trailing Stops: Protects profits when approaching targets
RISK MANAGEMENT:
- Maximum daily loss: 5% (configurable)
- Maximum weekend loss: 15% (configurable)
- Per-position risk: Capped at 120-156 USDT
- Emergency stops for flash crashes (8% moves)
- Consecutive loss protection (4 losses = pause)
TECHNICAL INDICATORS:
- CVD (Cumulative Volume Delta) divergence detection
- ATR-based dynamic stop loss and take profit
- RSI, MACD, Bollinger Bands confluence
- Volume surge confirmation (1.5x average)
- Weekend liquidity adjustments
INTEGRATION:
- Designed for Bybit Futures (0.075% taker fee)
- WunderTrading webhook compatibility via JSON alerts
- Minimum position size: 120 USDT (Bybit requirement)
- Initial capital: $500 recommended
TARGET METRICS:
- Win rate target: 65%
- Average win: 5.5%
- Average loss: 1.8%
- Risk-reward ratio: ~3:1
IMPORTANT DISCLAIMERS:
- Past performance does not guarantee future results
- Leveraged trading carries substantial risk of loss
- Weekend crypto markets have 13% of normal liquidity
- Not suitable for traders who cannot afford to lose their entire investment
- Requires continuous monitoring and adjustment
USAGE:
1. Apply to 15-minute charts only
2. Configure weekend hours for your timezone
3. Set up webhook alerts for automation
4. Monitor performance table in top-right corner
5. Adjust parameters based on your risk tolerance
This is an experimental strategy for educational purposes. Always test with small amounts first and never invest more than you can afford to lose completely.

Flux Power Dashboard (Updated and Renamed)Flux Power Dashboard is a compact market-state heads-up display for TradingView. It blends trend, momentum, and volume-flow into a single on-chart panel with color-coded cues and minimal lag. You get:
Clean visual trend via fast/slow MA with slope/debounce filters
MACD state and most recent cross (with “freshness” tint)
OBV confirmation and gating to reduce noise
Session awareness (Asia/London/New York + pre-sessions + overlap)
Optional HTF Regime row and regime gate to align signals to higher-timeframe bias
Context from VIX/VXN (volatility regime)
A single Flux Score (0–100) as a top-level read
It is deliberately “dashboard-first”: fast to read, consistent between symbols/timeframes, and designed to limit overtrading in chop.
What it can do (capabilities)
Signal gating: You can require multiple pillars to agree (Trend, MACD, OBV) before a “strong” bias is shown.
Debounced trend: Uses slope + confirmation bars to avoid flip-flopping.
Session presets: Auto-adjust the minimum confirmation bars by session (e.g., NY vs London vs Asia) to better match liquidity/volatility.
MACD presets: Quick switch between Scalp / Classic / Slow or roll your own custom speeds.
OBV confirmation: Volume flow must agree for trend/entries to “count” (optional).
HTF Regime awareness: Shows the higher-timeframe backdrop and (optionally) gates signals so you don’t fight the dominant trend.
Volatility context: VIX/VXN auto-colored cells based on your thresholds.
Top-center Session Title: Broadcasts the active session (or Overlap) with a matched background color.
Customizable UI: Column fonts, params font, transparency, dashboard corner, marker styles, colors, widths—tune it to your chart.
Practical use: Start with Flux Score + Summary for a snapshot, confirm with Trend & MACD, check OBV agreement (implicit in signal strength), glance at Regime to avoid counter-trend trades, and use Session + VIX/VXN for timing and risk context.
How it avoids common pitfalls
Repaint-aware: “Confirm on Close” can be enabled to read prior bar states, reducing intrabar noise.
Auto MA sanity: If fast ≥ slow length, it auto-swaps under the hood to keep calculations valid.
Debounce & confirm: Trend flips only after X bars satisfy conditions, cutting false flips in chop.
Freshness tint: New Cross/Signal rows tint slightly brighter for a few bars, so you can spot recency at a glance.
Every line of the dashboard (what it shows, how it’s colored)
Flux Score
What: Composite 0–100 built from three pillars: Trend (40%), MACD (30%), OBV (30%).
Read: ≥70 Bullish, ≤30 Bearish, else Neutral.
Use: Quick “state of play” gauge—stronger alignment pushes the score toward extremes.
Regime (optional row)
What: Higher-timeframe (your Regime TF) backdrop using the same MA pair with HTF slope/ATR buffer.
Values: Bull / Bear / Range.
Gate (optional): If Regime Gate is ON, Trend/Signals only go directional when HTF agrees.
Summary
What: One-line narrative combining the three pillars: MACD (up/down/flat), OBV (up/down/flat), Trend (up/down/flat).
Use: Human-readable cross-check; should rhyme with Flux Score.
Trend
What: Debounced MA relationship on the current chart.
Strict: needs fast > slow and slow rising (mirror for down) + slope debounce + confirmation bars.
Lenient: allows fast > slow or slow rising (mirror for down) with the same debounce/confirm.
Color: Green = UP, Red = DOWN, Gray = FLAT.
Use: Your structural bias on the trading timeframe.
MACD
What: Current MACD line vs signal, using your selected preset (or custom).
Values: Bull (line above), Bear (below), Flat (equal/indeterminate).
Color: Green/Red/Gray.
Cross
What: Most recent MACD cross and how many bars ago it occurred (e.g., “MACD XUP | 3 bars”).
Freshness: If the cross happened within Fresh Signal Tint bars, the cell brightens slightly.
Use: Timing helper for inflection points.
Signal
What: Latest directional shift (from short-bias to long-bias or vice versa) and age in bars.
Strength:
Strong = Trend + MACD + OBV all align
Weak = partial alignment (e.g., Trend + MACD, or Trend + OBV)
Color: Green for long bias, Red for short bias; fresh signals tint brighter.
Use: Action cue—treat Strong as higher quality; Weak as situational.
MA
What: Your slow MA type and length, plus slope direction (“up”/“down”).
Use: Context even when Trend is FLAT; slope often turns before full trend flips.
Session
What: Current market session by Eastern Time: New York / London / Asia, Pre- windows, Overlap, or Off-hours.
Logic: If ≥2 main sessions are active, shows Overlap (and grays the top title background).
Use: Timing and expectations for liquidity/volatility; also drives session-based confirmation presets if enabled.
VIX
What: Real-time CBOE:VIX on your chosen TF.
Auto-color (if on):
Calm (< Calm) → Green
Watch (< Watch) → Yellow
Elevated (< Elevated) → Orange
Very High (≥ Elevated) → Red
Use: Equity market–wide risk mood; higher = bigger moves, lower = quieter.
VXN
What: CBOE:VXN (Nasdaq volatility index) on your chosen TF.
Auto-color thresholds like VIX.
Use: Tech-heavy risk mood; helpful for growth/QQQ/NDX names.
Footer (params row, bottom-right)
What: Key live settings so you always know the context:
P= Trend Confirmation Bars
O= OBV Confirmation Bars
Strict/Lenient (trend mode)
MACD preset (or “Custom”)
swap if MA lengths were auto-swapped for validity
Regime gate if enabled
Candles for clarity
Use: Quick integrity check when comparing charts/screenshots or changing presets.
Recommended workflow
Start at Flux Score & Summary → snapshot of alignment.
Check Trend (color) and MACD (Bull/Bear).
Look at Signal (Strong vs Weak, and age).
Glance at Regime (and use gate if you’re trend-following).
Use Session + VIX/VXN to adjust expectations (breakout vs mean-revert, risk sizing, patience).
Keep Confirm on Close ON when you want stability; turn it OFF for faster (but noisier) reads.
Notes & limitations
Not advice: This is an informational tool; always combine with your own risk rules.
Repaint vs responsiveness: With “Confirm on Close” OFF you’ll see faster state changes but may get more churn intrabar.
Presets matter: Scalp MACD reacts fastest; Slow reduces whipsaw. Choose for your timeframe.
Session windows depend on the strings you set; adjust if your broker’s feed or DST handling needs tweaks.

Strong Candle Detector (Candles Close UP/DOWN)The Strong Candle Detector highlights candles that close decisively above or below the previous candle’s range, which means the resting liquidity of the previous candle has been entirely absorbed.
How it works:
A candle is considered Bullish (UP) when its close is higher than the previous candle’s high.
A candle is considered Bearish (DOWN) when its close is lower than the previous candle’s low.
This tool helps traders:
Spot strong breakouts or breakdowns.
Know when a liquidity sweep of a previous candle's extremes has failed
Quickly identify potential momentum continuation or reversal points.
Improve chart clarity by emphasizing only significant candles.
⚠️ Note: This indicator does not provide buy/sell signals. It is meant as a visual aid to support your trading strategy.

MTF Levels [OmegaTools]📖 Introduction
The Ω Levels Indicator is a complete market structure and level-mapping framework designed to help traders identify key zones where price is likely to react.
It blends classic technical anchors (VWAP, pivots, means, standard deviations) with modern statistical pattern recognition to dynamically project areas of manipulation, extension, and equilibrium.
At its core, Ω Levels creates an evolving map of market balance vs. imbalance, showing traders where liquidity is most likely to build and where price could pivot or accelerate.
But what makes it truly unique is the Pivot Forecaster — an embedded predictive engine that applies machine-learning inspired logic to recognize conditions that historically precede market turning points.
🔎 Key Features
Customizable Levels Framework
Define up to three levels (manipulation, extensions, VWAP, pivots, stdev bands, or prior extremes).
Choose mean references such as Open, VWAP, Pivot Mean, or Previous Session Mean.
Style controls (solid, dotted, dashed) and fill modes (internal, external, ranges) allow you to adapt the chart to your visual workflow.
Dynamic Zone Highlighting
Automatic fills between internal/external levels, or between specific level pairs (1–2, 1–3, 2–3).
Makes it easy to visualize value areas, expansions, and compression zones at a glance.
Multi-Timeframe Anchoring
Works on any timeframe, but calculations can be anchored to a higher timeframe (e.g., show daily VWAP & pivots on a 15m chart).
This allows traders to align intraday execution with higher timeframe context.
Pivot Forecaster (Machine Learning / Pattern Recognition)
This is the advanced predictive component.
The algorithm collects historical conditions observed around pivot highs and lows (volume state, ATR state, % candle expansion, oscillator conditions).
It then builds statistical “profiles” of typical pivot behavior and compares them in real-time against current market conditions.
When conditions match the “signature” of a pivot, the indicator highlights a Forecast Pivot High or Forecast Pivot Low (displayed as small diamond markers).
This functions as a pattern-recognition system, effectively learning from past pivots to anticipate where the next turning point is more likely to occur.
⚡ How Traders Can Use It
Intraday Execution: Use VWAP, manipulation, and extension levels to frame trades around liquidity zones.
Swing Context: Overlay higher timeframe pivots and means to guide medium-term positioning.
Fade Setups: Forecasted pivots often coincide with exhaustion zones where fading momentum carries edge.
Breakout Validation: When price breaks a structural level but the forecaster does not confirm a pivot, continuation probability is higher.
Risk Management: Levels provide natural stop/target placements, while pivot forecasts serve as warning signals for potential reversals.
⚙️ Settings Overview
Timeframe: Choose the anchor timeframe for calculations (default: Daily).
Means: Two selectable mean references (Open, VWAP, Pivot Point, Previous Mean).
Levels: Three levels can be customized (Manipulation, Extension, 1–2 StDev, Pivot Point, VWAP, Previous Extremes).
Fill Modes: Highlight zones between internal/external levels or custom ranges.
Visual Customization: Colors, line styles, fill opacity, and toggle for old levels.
Pivot Forecaster: Fully automated — no settings required, it adapts to instrument and timeframe.
🧭 Best Practices
Align Levels With Market Profile: Treat the levels as dynamic S/R zones and watch how price interacts with them.
Use Forecaster as Confirmation: The diamonds are not standalone signals; they are context filters that help you decide whether a move has higher reversal odds.
Higher Timeframe Anchoring: On intraday charts, set the timeframe to Daily or Weekly to trade with institutional levels.
Combine With ATR: Pair with the Ω ATR Indicator to size positions according to volatility while Ω Levels provides the structural roadmap.
📌 Summary
The Ω Levels Indicator is more than a level plotter — it’s a market map + predictive engine.
By combining traditional levels with an intelligent pivot forecaster, it gives traders both the static structure of where price should react, and the dynamic signal of where it is likely to react next.
This dual-layer approach — structural + predictive — makes it an invaluable tool for discretionary intraday traders, swing traders, and anyone who wants to anticipate price behavior instead of just reacting to it.

Trading Activity Index (Zeiierman)█ Overview
Trading Activity Index (Zeiierman) is a volume-based market activity meter that transforms dollar-volume into a smooth, normalized “activity index.”
It highlights when market participation is unusually low or high with a dynamic color gradient:
Light Blue → Low Activity (thin participation, low liquidity conditions)
Red/Orange → High Activity (active markets, large trades flowing in)
Additional percentile bands (20/40/60/80%) give context, helping you see whether the current activity level is in the bottom quintile, mid-range, or near historical extremes.
█ How It Works
⚪ Dollar Volume Transformation
Each bar, dollar volume is computed:
float dlrVol = close * volume
float dlrVolAvg = ta.sma(dlrVol, len_form)
Dollar volume = price × volume, smoothed by a configurable SMA window.
The result is log-transformed, compressing large outliers for a more stable signal.
⚪ Rolling Percentiles & Ranking
The log-dollar-volume series is compared to its rolling history (len_hist bars):
float p20 = ta.percentile_linear_interpolation(vscale, len_hist, 20)
float p40 = ta.percentile_linear_interpolation(vscale, len_hist, 40)
float p60 = ta.percentile_linear_interpolation(vscale, len_hist, 60)
float p80 = ta.percentile_linear_interpolation(vscale, len_hist, 80)
A normalized rank (0–1) is produced to color the main Trading Activity line.
█ How to Use
⚪ Detect High-Impact Sessions
Quickly see if today’s session is active or quiet relative to its own history — great for filtering setups that need activity.
⚪ Spot Breakouts & Traps
Combine with price action:
High activity near breakouts = strong follow-through likely.
Low activity breakouts = vulnerable to fake-outs.
⚪ Market Regime Context
Percentile bands help you assess whether participation is building up, in the middle of the range, or drying out — valuable for timing mean-reversion trades.
Above 80th percentile (red/orange) → Market is highly active, breakout trades and trend strategies are favored.
Below 20th percentile (light blue) → Market is quiet; fade moves or wait for expansion.
Watch transitions from blue → orange as a signal of growing institutional participation.
█ Settings
Formation Window (bars) – Number of bars used to average dollar volume before log transform.
History Window (bars) – Lookback period for percentile calculations and rank normalization.
-----------------
Disclaimer
The content provided in my scripts, indicators, ideas, algorithms, and systems is for educational and informational purposes only. It does not constitute financial advice, investment recommendations, or a solicitation to buy or sell any financial instruments. I will not accept liability for any loss or damage, including without limitation any loss of profit, which may arise directly or indirectly from the use of or reliance on such information.
All investments involve risk, and the past performance of a security, industry, sector, market, financial product, trading strategy, backtest, or individual's trading does not guarantee future results or returns. Investors are fully responsible for any investment decisions they make. Such decisions should be based solely on an evaluation of their financial circumstances, investment objectives, risk tolerance, and liquidity needs.

Sentinel Nexus Dashboard [AGP] Ver.1.5Sentinel Nexus Dashboard is a versatile Pine Script designed as a comprehensive technical analysis tool. It condenses a variety of key indicators and metrics into a single, intuitive visual dashboard, providing an integrated view of market trends, momentum, volatility, and liquidity, all neatly organized on your TradingView chart.
Key Features and Benefits
All-in-One Dashboard: This script centralizes relevant information, offering a clean, efficient control panel that helps you make quick decisions without cluttering your chart with multiple overlays.
Trend Analysis with ADX: It incorporates the Average Directional Index (ADX) to measure trend strength. The dashboard displays ADX, DI+, and DI- values with dynamic color-coding to highlight trend intensity (e.g., blue for a very strong trend).
Momentum Analysis with MACD: The dashboard shows MACD line and signal line values in a table. The background color of the MACD values reflects the histogram's direction, allowing you to quickly identify crosses and shifts in market momentum.
Multi-Timeframe RSI Analysis: The RSI (Relative Strength Index) dashboard displays values across multiple timeframes (from 1 minute to 1 month). Overbought (77) and oversold (23) levels are color-coded for immediate identification of market conditions, making it an ideal tool for multi-timeframe analysis.
Smart and Dynamic Volume: The script uses a bar coloring algorithm based on average volume. Chart bars change color according to volume magnitude (extreme, high, average, or low) relative to the average, distinguishing between bullish and bearish bars. This helps you identify significant, liquidity-driven price movements.
Fair Value Analysis: The script calculates an asset's "fair value" using a noise filter (similar to a Kalman filter) on recent highs and lows to determine a midpoint. The price dashboard's background color changes to indicate if the current price is above or below this fair value.
Fibonacci EMA Analysis: A table displays several Exponential Moving Averages (EMAs) based on the Fibonacci sequence. The values are color-coded to show whether the current price is above (white) or below (orange) each EMA, helping you quickly identify dynamic support and resistance levels.
CME Futures Data Integration: For Bitcoin, the script can show a chart label with the Bitcoin futures price (CME:BTC1!), allowing you to compare the spot price with the CME futures market.
Potential Uses and Applications
The Sentinel Nexus Dashboard is an excellent support tool for trading. It is not a signal system but rather a suite of confirmation tools that can be used to:
Confirm Trend Strength: Before entering a trade, use the ADX data to ensure the trend has enough strength for your expected move.
Detect Reversal Points: Multi-timeframe RSI data can alert you to potential overbought or oversold conditions, indicating possible exhaustion of a price move.
Validate Price Movements: Bar coloring based on volume helps you determine if a price move is genuine and supported by strong market participation. High volume can confirm a breakout or reversal.
Identify Support and Resistance: The Fibonacci EMAs allow you to quickly visualize key levels where price might find support or resistance, aiding in planning entries and exits.
In short, this script is perfect for traders who want a comprehensive market overview without chart clutter. It efficiently integrates trend, momentum, and volume analysis in one place.
Legal Disclaimer
RISK WARNING:
This Pine Script is a technical analysis tool and should not be considered financial advice. Past performance of any indicator is no guarantee of future results. Trading in financial markets involves a high risk of loss and is not suitable for all investors. By using this indicator, you accept full responsibility for your trading decisions and acknowledge that any financial loss is your sole responsibility.
IMPORTANT:
Some script functions, such as the CME price label, may not work correctly if your TradingView subscription plan is not a paid one. Please check your plan's limitations to ensure the indicator's optimal functionality.

Harmonic Super GuppyHarmonic Super Guppy – Harmonic & Golden Ratio Trend Analysis Framework
Overview
Harmonic Super Guppy is a comprehensive trend analysis and visualization tool that evolves the classic Guppy Multiple Moving Average (GMMA) methodology, pioneered by Daryl Guppy to visualize the interaction between short-term trader behavior and long-term investor trends. into a harmonic and phase-based market framework. By combining harmonic weighting, golden ratio phasing, and multiple moving averages, it provides traders with a deep understanding of market structure, momentum, and trend alignment. Fast and slow line groups visually differentiate short-term trader activity from longer-term investor positioning, while adaptive fills and dynamic coloring clearly illustrate trend coherence, expansion, and contraction in real time.
Traditional GMMA focuses primarily on moving average convergence and divergence. Harmonic Super Guppy extends this concept, integrating frequency-aware harmonic analysis and golden ratio modulation, allowing traders to detect subtle cyclical forces and early trend shifts before conventional moving averages would react. This is particularly valuable for traders seeking to identify early trend continuation setups, preemptive breakout entries, and potential trend exhaustion zones. The indicator provides a multi-dimensional view, making it suitable for scalping, intraday trading, swing setups, and even longer-term position strategies.
The visual structure of Harmonic Super Guppy is intentionally designed to convey trend clarity without oversimplification. Fast lines reflect short-term trader sentiment, slow lines capture longer-term investor alignment, and fills highlight compression or expansion. The adaptive color coding emphasizes trend alignment: strong green for bullish alignment, strong red for bearish, and subtle gray tones for indecision. This allows traders to quickly gauge market conditions while preserving the granularity necessary for sophisticated analysis.
How It Works
Harmonic Super Guppy uses a combination of harmonic averaging, golden ratio phasing, and adaptive weighting to generate its signals.
Harmonic Weighting : Each moving average integrates three layers of harmonics:
Primary harmonic captures the dominant cyclical structure of the market.
Secondary harmonic introduces a complementary frequency for oscillatory nuance.
Tertiary harmonic smooths higher-frequency noise while retaining meaningful trend signals.
Golden Ratio Phase : Phases of each harmonic contribution are adjusted using the golden ratio (default φ = 1.618), ensuring alignment with natural market rhythms. This reduces lag and allows traders to detect trend shifts earlier than conventional moving averages.
Adaptive Trend Detection : Fast SMAs are compared against slow SMAs to identify structural trends:
UpTrend : Fast SMA exceeds slow SMA.
DownTrend : Fast SMA falls below slow SMA.
Frequency Scaling : The wave frequency setting allows traders to modulate responsiveness versus smoothing. Higher frequency emphasizes short-term moves, while lower frequency highlights structural trends. This enables adaptation across asset classes with different volatility characteristics.
Through this combination, Harmonic Super Guppy captures micro and macro market cycles, helping traders distinguish between transient noise and genuine trend development. The multi-harmonic approach amplifies meaningful price action while reducing false signals inherent in standard moving averages.
Interpretation
Harmonic Super Guppy provides a multi-dimensional perspective on market dynamics:
Trend Analysis : Alignment of fast and slow lines reveals trend direction and strength. Expanding harmonics indicate momentum building, while contraction signals weakening conditions or potential reversals.
Momentum & Volatility : Rapid expansion of fast lines versus slow lines reflects short-term bullish or bearish pressure. Compression often precedes breakout scenarios or volatility expansion. Traders can quickly gauge trend vigor and potential turning points.
Market Context : The indicator overlays harmonic and structural insights without dictating entry or exit points. It complements order blocks, liquidity zones, oscillators, and other technical frameworks, providing context for informed decision-making.
Phase Divergence Detection : Subtle divergence between harmonic layers (primary, secondary, tertiary) often signals early exhaustion in trends or hidden strength, offering preemptive insight into potential reversals or sustained continuation.
By observing both structural alignment and harmonic expansion/contraction, traders gain a clear sense of when markets are trending with conviction versus when conditions are consolidating or becoming unpredictable. This allows for proactive trade management, rather than reactive responses to lagging indicators.
Strategy Integration
Harmonic Super Guppy adapts to various trading methodologies with clear, actionable guidance.
Trend Following : Enter positions when fast and slow lines are aligned and harmonics are expanding. The broader the alignment, the stronger the confirmation of trend persistence. For example:
A fast line crossover above slow lines with expanding fills confirms momentum-driven continuation.
Traders can use harmonic amplitude as a filter to reduce entries against prevailing trends.
Breakout Trading : Periods of line compression indicate potential volatility expansion. When fast lines diverge from slow lines after compression, this often precedes breakouts. Traders can combine this visual cue with structural supports/resistances or order flow analysis to improve timing and precision.
Exhaustion and Reversals : Divergences between harmonic components, or contraction of fast lines relative to slow lines, highlight weakening trends. This can indicate liquidity exhaustion, trend fatigue, or corrective phases. For example:
A flattening fast line group above a rising slow line can hint at short-term overextension.
Traders may use these signals to tighten stops, take partial profits, or prepare for contrarian setups.
Multi-Timeframe Analysis : Overlay slow lines from higher timeframes on lower timeframe charts to filter noise and trade in alignment with larger market structures. For example:
A daily bullish alignment combined with a 15-minute breakout pattern increases probability of a successful intraday trade.
Conversely, a higher timeframe divergence can warn against taking counter-trend trades in lower timeframes.
Adaptive Trade Management : Harmonic expansion/contraction can guide dynamic risk management:
Stops may be adjusted according to slow line support/resistance or harmonic contraction zones.
Position sizing can be modulated based on harmonic amplitude and compression levels, optimizing risk-reward without rigid rules.
Technical Implementation Details
Harmonic Super Guppy is powered by a multi-layered harmonic and phase calculation engine:
Harmonic Processing : Primary, secondary, and tertiary harmonics are calculated per period to capture multiple market cycles simultaneously. This reduces noise and amplifies meaningful signals.
Golden Ratio Modulation : Phase adjustments based on φ = 1.618 align harmonic contributions with natural market rhythms, smoothing lag and improving predictive value.
Adaptive Trend Scaling : Fast line expansion reflects short-term momentum; slow lines provide structural trend context. Fills adapt dynamically based on alignment intensity and harmonic amplitude.
Multi-Factor Trend Analysis : Trend strength is determined by alignment of fast and slow lines over multiple bars, expansion/contraction of harmonic amplitudes, divergences between primary, secondary, and tertiary harmonics and phase synchronization with golden ratio cycles.
These computations allow the indicator to be highly responsive yet smooth, providing traders with actionable insights in real time without overloading visual complexity.
Optimal Application Parameters
Asset-Specific Guidance:
Forex Majors : Wave frequency 1.0–2.0, φ = 1.618–1.8
Large-Cap Equities : Wave frequency 0.8–1.5, φ = 1.5–1.618
Cryptocurrency : Wave frequency 1.2–3.0, φ = 1.618–2.0
Index Futures : Wave frequency 0.5–1.5, φ = 1.618
Timeframe Optimization:
Scalping (1–5min) : Emphasize fast lines, higher frequency for micro-move capture.
Day Trading (15min–1hr) : Balance fast/slow interactions for trend confirmation.
Swing Trading (4hr–Daily) : Focus on slow lines for structural guidance, fast lines for entry timing.
Position Trading (Daily–Weekly) : Slow lines dominate; harmonics highlight long-term cycles.
Performance Characteristics
High Effectiveness Conditions:
Clear separation between short-term and long-term trends.
Moderate-to-high volatility environments.
Assets with consistent volume and price rhythm.
Reduced Effectiveness:
Flat or extremely low volatility markets.
Erratic assets with frequent gaps or algorithmic dominance.
Ultra-short timeframes (<1min), where noise dominates.
Integration Guidelines
Signal Confirmation : Confirm alignment of fast and slow lines over multiple bars. Expansion of harmonic amplitude signals trend persistence.
Risk Management : Place stops beyond slow line support/resistance. Adjust sizing based on compression/expansion zones.
Advanced Feature Settings :
Frequency tuning for different volatility environments.
Phase analysis to track divergences across harmonics.
Use fills and amplitude patterns as a guide for dynamic trade management.
Multi-timeframe confirmation to filter noise and align with structural trends.
Disclaimer
Harmonic Super Guppy is a trend analysis and visualization tool, not a guaranteed profit system. Optimal performance requires proper wave frequency, golden ratio phase, and line visibility settings per asset and timeframe. Traders should combine the indicator with other technical frameworks and maintain disciplined risk management practices.
