Volume Point of Control with Fib Based Profile🍀Description:
This indicator is a comprehensive volume profile analysis tool designed to identify key price levels based on trading activity within user-defined timeframes. It plots the Point of Control (POC), Value Area High (VAH), and Value Area Low (VAL), along with dynamically calculated Fibonacci levels derived from the developing period's range. It offers extensive customization for both historical and developing levels.
🍀Core Features:
Volume Profiling (POC, VAH, VAL):
Calculates and plots the POC (price level with the highest volume), VAH, and VAL for a selected timeframe (e.g., Daily, Weekly).
The Value Area percentage is configurable. 70% is common on normal volume profiles, but this script allows you to configure multiple % levels via the fib levels. I recommend using 2 versions of this indicator on a chart, one has Value Area at 1 (100% - high and low of lookback) and the second is a specified VA area (i.e. 70%) like in the chart snapshot above. See examples at the bottom.
Historical Levels:
Plots POC, VAH, and VAL from previous completed periods.
Optionally displays only "Unbroken" levels – historical levels that price has not yet revisited, which can act as stronger magnets or resistance/support.
The user can manage the number of historical lines displayed to prevent chart clutter.
Developing Levels:
Shows the POC, VAH, and VAL as they form in real-time during the current, incomplete period. This provides insight into intraday/intra-period value migration.
Dynamic Fibonacci Levels:
Calculates and plots Fibonacci retracement/extension levels based dynamically on the range between the developing POC and the developing VAH/VAL.
Offers 8 configurable % levels above and below POC that can be toggled on/off.
Visual Customization:
Extensive options for colors, line styles, and widths for all plotted levels.
Optional gradient fill for the Value Area that visualizes current price distance from POC - option to invert the colors as well.
Labels for developing levels and Fibonacci levels for easy identification.
🍀Characteristics:
Volume-Driven: Levels are derived from actual trading volume, reflecting areas of high participation and price agreement/disagreement.
Timeframe Specific: The results are entirely dependent on the chosen profile timeframe.
Dynamic & Static Elements: Developing levels and Fibs update live, while historical levels remain fixed once their period closes.
Lagging (Historical) & Potentially Leading: Historical levels are based on the past, but are often respected by future price action. Developing levels show current dynamics.
🍀How to Use It:
Identifying Support & Resistance: Historical and developing POCs, VAHs, and VALs are often key areas where price may react. Unbroken levels are particularly noteworthy.
Market Context & Sentiment: Trading above the POC suggests bullish strength/acceptance of higher prices, while trading below suggests bearishness/acceptance of lower prices.
Entry/Exit Zones: Interactions with these levels (rejections, breakouts, tests) can provide potential entry or exit signals, especially when confirming with other analysis methods.
Dynamic Targets: The Fibonacci levels calculated from the developing POC-VA range offer potential intraday/intra-period price targets or areas of interest.
Understanding Value Migration: Observing the movement of the developing POC/VAH/VAL throughout the period reveals where value is currently being established.
🍀Potential Drawbacks:
Input Sensitivity: The choice of timeframe, Value Area percentage, and volume resolution heavily influences the generated levels. Experimentation is needed for optimal settings per instrument/market. (I've found that Range Charts can provide very accurate volume levels on TV since the time element is removed. This helps to refine the accuracy of price levels with high volume.)
Volume Data Dependency: Requires accurate volume data. May be less reliable on instruments with sparse or questionable volume reporting.
Chart Clutter: Enabling all features simultaneously can make the chart busy. Utilize the line management inputs and toggle features as needed.
Not a Standalone Strategy: This indicator provides context and key levels. It should be used alongside other technical analysis tools and price action reading for robust decision-making.
Developing Level Fluctuation: Developing POC/VA/Fib levels can shift considerably, especially early in a new period, before settling down as more volume accumulates and time passes.
🍀Recommendations/Examples:
I recommend have this indicator on your chart twice, one has the VA set at 1 (100%) and has the fib levels plotted. The second has the VA set to 0.7 (70%) to highlight the defined VA.
Here is an example with 3 on a chart. VA of 100%, VA of 80%, and VA of 20%
Wyszukaj w skryptach "key levels"

Poisson Projection of Price Levels### **Poisson Projection of Price Levels**
**Overview:**
The *Poisson Projection of Price Levels* is a cutting-edge technical indicator designed to identify and visualize potential support and resistance levels based on historical price interactions. By leveraging the Poisson distribution, this tool dynamically adjusts the significance of each price level's past "touches" to project future interactions with varying degrees of probability. This probabilistic approach offers traders a nuanced view of where price levels may hold or react in upcoming bars, enhancing both analysis and trading strategies.
---
**🔍 **Math & Methodology**
1. **Strata Levels:**
- **Definition:** Strata are horizontal lines spaced evenly around the current closing price.
- **Calculation:**
\
where \(i\) ranges from 0 to \(\text{Strata Count} - 1\).
2. **Forecast Iterations:**
- **Structure:** The indicator projects five forecast iterations into the future, each spaced by a Fibonacci sequence of bars: 2, 3, 5, 8, and 13 bars ahead. This spacing is inspired by the Fibonacci sequence, which is prevalent in financial market analysis for identifying key levels.
- **Purpose:** Each iteration represents a distinct forecast point where the price may interact with the strata, allowing for a multi-step projection of potential price levels.
3. **Touch Counting:**
- **Definition:** A "touch" occurs when the closing price of a bar is within half the increment of a stratum level.
- **Process:** For each stratum and each forecast iteration, the indicator counts the number of touches within a specified lookback window (e.g., 80 bars), offset by the forecasted position. This ensures that each iteration's touch count is independent and contextually relevant to its forecast horizon.
- **Adjustment:** Each forecast iteration analyzes a unique segment of the lookback window, offset by its forecasted position to ensure independent probability calculations.
4. **Poisson Probability Calculation:**
- **Formula:**
\
\
- **Interpretation:** \(p(k=1)\) represents the probability of exactly one touch occurring within the lookback window for each stratum and iteration.
- **Application:** This probability is used to determine the transparency of each stratum line, where higher probabilities result in more opaque (less transparent) lines, indicating stronger historical significance.
5. **Transparency Mapping:**
- **Calculation:**
\
- **Purpose:** Maps the Poisson probability to a visual transparency level, enhancing the readability of significant strata levels.
- **Outcome:** Strata with higher probabilities (more historical touches) appear more opaque, while those with lower probabilities appear fainter.
---
**📊 **Comparability to Standard Techniques**
1. **Support and Resistance Levels:**
- **Traditional Approach:** Traders identify support and resistance based on historical price reversals, pivot points, or psychological price levels.
- **Poisson Projection:** Automates and quantifies this process by statistically analyzing the frequency of price interactions with specific levels, providing a probabilistic measure of significance.
2. **Statistical Modeling:**
- **Standard Models:** Techniques like Moving Averages, Bollinger Bands, or Fibonacci Retracements offer dynamic and rule-based levels but lack direct probabilistic interpretation.
- **Poisson Projection:** Introduces a discrete event probability framework, offering a unique blend of statistical rigor and visual clarity that complements traditional indicators.
3. **Event-Based Analysis:**
- **Financial Industry Practices:** Event studies and high-frequency trading models often use Poisson processes to model order arrivals or price jumps.
- **Indicator Application:** While not identical, the use of Poisson probabilities in this indicator draws inspiration from event-based modeling, applying it to the context of price level interactions.
---
**💡 **Strengths & Advantages**
1. **Innovative Visualization:**
- Combines statistical probability with traditional support/resistance visualization, offering a fresh perspective on price level significance.
2. **Dynamic Adaptability:**
- Parameters like strata increment, lookback window, and probability threshold are user-defined, allowing customization across different markets and timeframes.
3. **Independent Probability Calculations:**
- Each forecast iteration calculates its own Poisson probability, ensuring that projections are contextually relevant and independent of other iterations.
4. **Clear Visual Cues:**
- Transparency-based coloring intuitively highlights significant price levels, making it easier for traders to identify key areas of interest at a glance.
---
**⚠️ **Limitations & Considerations**
1. **Poisson Assumptions:**
- Assumes that touches occur independently and at a constant average rate (\(\lambda\)), which may not always align with market realities characterized by trends and volatility clustering.
2. **Computational Intensity:**
- Managing multiple iterations and strata can be resource-intensive, potentially affecting performance on lower-powered devices or with very high lookback windows.
3. **Interpretation Complexity:**
- While transparency offers visual clarity, understanding the underlying probability calculations requires a basic grasp of Poisson statistics, which may be a barrier for some traders.
---
**📢 **How to Use It**
1. **Add to TradingView:**
- Open TradingView and navigate to the Pine Script Editor.
- Paste the script above and click **Add to Chart**.
2. **Configure Inputs:**
- **Strata Increment:** Set the desired price step between strata (e.g., `0.1` for 10 cents).
- **Lookback Window:** Define how many past bars to consider for calculating Poisson probabilities (e.g., `80`).
- **Probability Transparency Threshold (%):** Set the threshold percentage to map probabilities to line transparency (e.g., `25%`).
3. **Understand the Forecast Iterations:**
- The indicator projects five forecast points into the future at bar spacings of 2, 3, 5, 8, and 13 bars ahead.
- Each iteration independently calculates its Poisson probability based on the touch counts within its specific lookback window offset by its forecasted position.
4. **Interpret the Visualization:**
- **Opaque Lines:** Indicate higher Poisson probabilities, suggesting historically significant price levels that are more likely to interact again.
- **Fainter Lines:** Represent lower probabilities, indicating less historically significant levels that may be less likely to interact.
- **Forecast Spacing:** The spacing of 2, 3, 5, 8, and 13 bars ahead aligns with Fibonacci principles, offering a natural progression in forecast horizons.
5. **Apply to Trading Strategies:**
- **Support/Resistance Identification:** Use the opaque lines as potential support and resistance levels for placing trades.
- **Entry and Exit Points:** Anticipate price interactions at forecasted levels to plan strategic entries and exits.
- **Risk Management:** Utilize the transparency mapping to determine where to place stop-loss and take-profit orders based on the probability of price interactions.
6. **Customize as Needed:**
- Adjust the **Strata Increment** to fit different price ranges or volatility levels.
- Modify the **Lookback Window** to capture more or fewer historical touches, adapting to different timeframes or market conditions.
- Tweak the **Probability Transparency Threshold** to control the sensitivity of transparency mapping to Poisson probabilities.
**📈 **Practical Applications**
1. **Identifying Key Levels:**
- Quickly visualize which price levels have historically had significant interactions, aiding in the identification of potential support and resistance zones.
2. **Forecasting Price Reactions:**
- Use the forecast iterations to anticipate where price may interact in the near future, assisting in planning entry and exit points.
3. **Risk Management:**
- Determine areas of high probability for price reversals or consolidations, enabling better placement of stop-loss and take-profit orders.
4. **Market Analysis:**
- Assess the strength of market levels over different forecast horizons, providing a multi-layered understanding of market structure.
---
**🔗 **Conclusion**
The *Poisson Projection of Price Levels* bridges the gap between statistical modeling and traditional technical analysis, offering traders a sophisticated tool to quantify and visualize the significance of price levels. By integrating Poisson probabilities with dynamic transparency mapping, this indicator provides a unique and insightful perspective on potential support and resistance zones, enhancing both analysis and trading strategies.
---
**📞 **Contact:**
For support or inquiries, please contact me on TradingView!
---
**📢 **Join the Conversation!**
Have questions, feedback, or suggestions for further enhancements? Feel free to comment below or reach out directly. Your input helps refine and evolve this tool to better serve the trading community.
---
**Happy Trading!** 🚀

HOD/LOD/PMH/PML/PDH/PDL Strategy by @tradingbauhaus This script is a trading strategy @tradingbauhaus designed to trade based on key price levels, such as the High of Day (HOD), Low of Day (LOD), Premarket High (PMH), Premarket Low (PML), Previous Day High (PDH), and Previous Day Low (PDL). Below, I’ll explain in detail what the script does:
Core Functionality of the Script:
Calculates Key Price Levels:
HOD (High of Day): The highest price of the current day.
LOD (Low of Day): The lowest price of the current day.
PMH (Premarket High): The highest price during the premarket session (before the market opens).
PML (Premarket Low): The lowest price during the premarket session.
PDH (Previous Day High): The highest price of the previous day.
PDL (Previous Day Low): The lowest price of the previous day.
Draws Horizontal Lines on the Chart:
Plots horizontal lines on the chart for each key level (HOD, LOD, PMH, PML, PDH, PDL) with specific colors for easy visual identification.
Defines Entry and Exit Rules:
Long Entry (Buy): If the price crosses above the PMH (Premarket High) or the PDH (Previous Day High).
Short Entry (Sell): If the price crosses below the PML (Premarket Low) or the PDL (Previous Day Low).
Long Exit: If the price reaches the HOD (High of Day) during a long position.
Short Exit: If the price reaches the LOD (Low of Day) during a short position.
How the Script Works Step by Step:
Calculates Key Levels:
Uses the request.security function to fetch the HOD and LOD of the current day, as well as the highs and lows of the previous day (PDH and PDL).
Calculates the PMH and PML during the premarket session (before 9:30 AM).
Plots Levels on the Chart:
Uses the plot function to draw horizontal lines on the chart representing the key levels (HOD, LOD, PMH, PML, PDH, PDL).
Each level has a specific color for easy identification:
HOD: White.
LOD: Purple.
PDH: Orange.
PDL: Blue.
PMH: Green.
PML: Red.
Defines Trading Rules:
Uses conditions with ta.crossover and ta.crossunder to detect when the price crosses key levels.
Long Entry: If the price crosses above the PMH or PDH, a long position (buy) is opened.
Short Entry: If the price crosses below the PML or PDL, a short position (sell) is opened.
Long Exit: If the price reaches the HOD during a long position, the position is closed.
Short Exit: If the price reaches the LOD during a short position, the position is closed.
Executes Orders Automatically:
Uses the strategy.entry and strategy.close functions to open and close positions automatically based on the defined rules.
Advantages of This Strategy:
Based on Key Levels: Uses important price levels that often act as support and resistance.
Easy to Visualize: Horizontal lines on the chart make it easy to identify levels.
Automated: Entries and exits are executed automatically based on the defined rules.
Limitations of This Strategy:
Dependent on Volatility: Works best in markets with significant price movements.
False Crosses: There may be false crosses that generate incorrect signals.
No Advanced Risk Management: Does not include dynamic stop-loss or take-profit mechanisms.
How to Improve the Strategy:
Add Stop-Loss and Take-Profit: To limit losses and lock in profits.
Filter Signals with Indicators: Use RSI, MACD, or other indicators to confirm signals.
Optimize Levels: Adjust key levels based on the asset’s behavior.
In summary, this script is a trading strategy that operates based on key price levels, such as HOD, LOD, PMH, PML, PDH, and PDL. It is useful for traders who want to trade based on significant support and resistance levels.

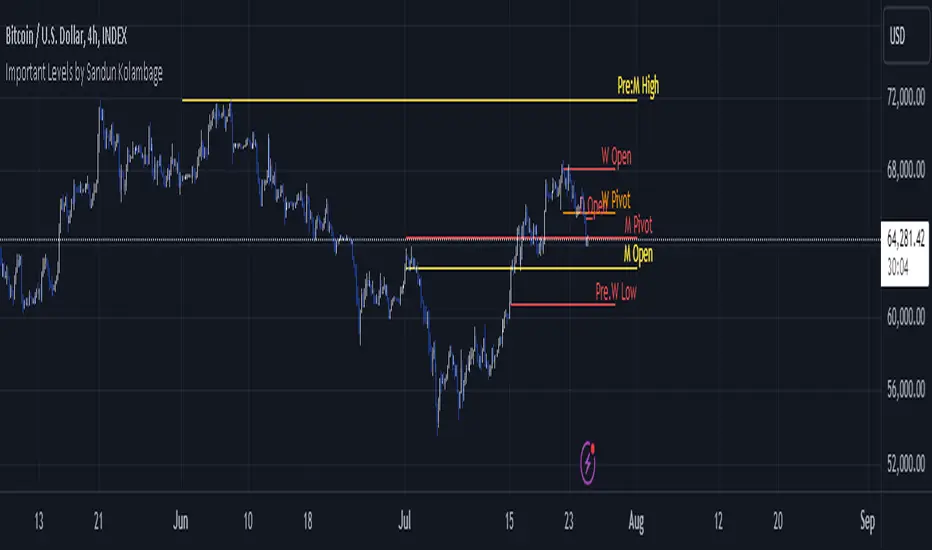
Important Levels by Sandun Kolambage
### Pine Script Indicator: Important Levels by Sandun Kolambage
#### Description
Introducing our new pivot point and high/low indicator for TradingView! This indicator is designed to help traders identify key levels of support and resistance across different timeframes, from daily to yearly. By analyzing historical data and market trends, our indicator displays the most important pivot points and high/low levels, giving you a better understanding of market dynamics and potential trading opportunities.
Whether you're a day trader, swing trader, or long-term investor, our indicator can help you optimize your trading strategy and achieve your financial goals. Install our indicator on TradingView today and start taking advantage of these important levels!
#### Key Features
- **Daily, Weekly, Monthly, and Yearly Levels:** Automatically plots the open, high, low, and close prices for different timeframes to help traders identify significant levels.
- **Pivot Points:** Calculates and displays pivot points for weekly, monthly, and yearly timeframes, providing additional support and resistance levels.
- **Customizable Line Styles:** Offers options to customize the appearance of the lines (solid, dashed, or dotted) for better visualization.
- **Conditional Coloring:** Uses color coding to highlight the relationship between different timeframe closes, making it easy to spot important levels.
#### How It Works
1. **Daily, Weekly, Monthly, and Yearly Levels:**
- The indicator uses `request.security` to fetch and display open, high, low, and close prices for daily, weekly, monthly, and yearly timeframes.
- Lines are plotted at these key levels with colors indicating their relationship to closes of other timeframes.
2. **Pivot Points:**
- Pivot points are calculated using the formula \((High + Low + Close) / 3\).
- These pivot points are plotted on the chart and labeled clearly to indicate potential support and resistance areas.
3. **Customizable Line Styles:**
- Users can select from solid, dashed, or dotted lines to represent the key levels and pivot points for better clarity and personal preference.
4. **Conditional Coloring:**
- The indicator applies conditional coloring to the lines based on the comparison of current close prices across different timeframes. Yellow indicates lower closes, and red indicates higher closes, making it easy to identify important price levels quickly.
#### Usage Instructions
1. **Enable Key Levels:**
- Toggle the "Daily Weekly Monthly High/Low" option to display or hide the respective levels.
- Select your preferred line style (solid, dashed, dotted) for better visibility.
2. **Display Pivot Points:**
- Toggle the "Pivot" option to show or hide the weekly, monthly, and yearly pivot points on the chart.
3. **Interpret Color Coding:**
- Yellow lines indicate levels where the close price is lower compared to a specific timeframe close.
- Red lines indicate levels where the close price is higher compared to a specific timeframe close.
- Specific colors for yearly levels and pivots are used to distinguish them clearly on the chart.
By following these guidelines, traders can effectively use this indicator to identify critical price levels and make informed trading decisions.
Dynamic Support & Resistance Tracker with MTFDynamic Support & Resistance Tracker with Weekly, Monthly & Daily Levels
The Dynamic Support & Resistance Tracker is designed to help traders identify key support and resistance levels across multiple timeframes, enhancing market analysis and decision-making. This indicator calculates and plots support and resistance levels for daily, weekly, and monthly periods, along with extension lines that provide insights into potential price targets.
Key Features:
Multi-Timeframe Analysis:
Daily Levels: Identifies the high, low, and midpoint for each trading day. These levels help traders recognize important price points for short-term trading strategies.
Weekly Levels: Plots the high, low, and midpoint for each week. This feature is valuable for swing traders who need to understand broader market trends.
Monthly Levels: Displays the high, low, and midpoint for each month, which is essential for long-term investors.
Extension Lines:
Calculates extension lines beyond the standard support and resistance levels to help anticipate potential price targets and reversals. These extensions are based on the distance between the high/low and midpoint levels.
Real-Time Updates:
Automatically updates the levels based on the most recent market data, ensuring traders have the most current information for their analysis.
Clear Visuals:
The indicator provides clearly labeled and color-coded lines for easy identification of key levels, improving the visual clarity of market analysis.
How It Works:
Daily, Weekly, and Monthly Levels: The indicator calculates the high, low, and midpoint levels for daily, weekly, and monthly timeframes and plots them on the chart. These levels serve as potential areas of support and resistance where price action may react.
Extension Lines: The extension lines are calculated based on the distance between the high/low and midpoint levels, projecting potential areas where price may find support or resistance beyond the standard levels.
Automatic Updates: The indicator continuously updates the plotted levels based on the latest market data, providing real-time insights.
Benefits:
Improved Market Analysis: By providing a clear view of support and resistance levels across multiple timeframes, this indicator helps traders understand market trends and price movements more effectively.
Informed Trading Decisions: The detailed plotting of levels and extensions allows traders to make more informed decisions, enhancing their trading strategies.
Versatility: Suitable for various trading styles, including intraday trading, swing trading, and long-term investing.
Instructions for Use:
Analyze the Levels: Observe the plotted high, low, and mid-levels for daily, weekly, and monthly timeframes.
Plan Your Trades: Use the identified support and resistance levels to set your entry and exit points, stop-losses, and profit targets.
Monitor the Market: Stay updated with real-time adjustments of the levels, ensuring you always have the latest market information.
Note: This indicator is designed to enhance your trading analysis by providing clear and reliable support and resistance levels. However, it should be used as part of a comprehensive trading strategy and not as the sole basis for trading decisions.

Daily ATR Bonanza: Expected Moves - Tr33man Daily ATR Bonanza: Expected Moves
Overview 🤷♂️
The Daily ATR Bonanza script is a powerful trading tool designed to help traders visualize and understand potential price movements using the Average True Range (ATR). It provides daily and weekly ATR levels, historical statistics, and conditional probability analysis to give traders actionable insights. The script also plots the daily Keltner channel. This script is ideal for traders who want to gauge volatility, identify key levels, and make data-driven decisions.
b]Key Features:
📈 1. Daily and Weekly ATR Levels
🔵ATR Levels: The script calculates and displays ATR-based levels for the day and week. These levels are derived from the previous day's or week's close price and are adjusted using customizable multipliers (0.5x, 1x, and 1.5x by default).
🔵You can choose the number of ATR levels (1, 2, or 3) and adjust the multipliers to suit your trading strategy.
🌐 2. ATR Bands (Keltner Channels)
🔵The script includes an option to display ATR Bands, which are volatility-based envelopes around a moving average. These bands help identify overbought and oversold conditions.
🔵You can adjust the ATR multiplier and the length of the moving average used for the bands.
🧮 3. Historical Statistics and Conditional Probability
🔵 Historical Analysis: The script analyzes historical price movements to calculate the likelihood of closing at certain ATR levels.
🔵 Conditional Probability: This feature shows the probability of the price reaching specific ATR levels given the current market conditions. The conditional matches historical data by an open in the same opening ATR bucket, as well as the current price bucket having been visited in the historical case. Conditional probabilities are just statistics, and do not predict anything.
Data Table: 📚
🔵 Historical Close Probability: The percentage of days the price closed within each ATR level.
🔵 Conditional Close Probability: The likelihood of the price closing within each ATR level today.
❓ What is Conditional Probability? ❓
Conditional probability is a statistical measure that calculates the likelihood of an event occurring given that another event has already occurred. In this script, it is used to determine the probability of the price reaching specific ATR levels based on the current opening range as well as current ATR distance from the previous close.
For example:
If the market opens near the lower end of the first ATR level, the script calculates the likelihood of the price reaching the upper end of the first, second, or third ATR level.
This analysis is based on historical data, making it a powerful tool for understanding potential price movements.
🌟 Understanding the Levels
🔵Daily Levels: These are based on the previous day's close price and ATR. They are updated at the start of each new day.
🔵Weekly Levels: These are based on the previous week's close price and ATR. They are updated at the start of each new week.
🔵ATR Bands: These are dynamic levels that adjust with market volatility.
🔬 Analyze the Statistics (Daily only for now, no weekly yet)
🔵Use the interactive table to understand historical probabilities and conditional probabilities.
🔵Focus on the current opening range and the likelihood of reaching specific levels.
🧠 Make Trading Decisions
🔵Use the ATR levels and bands to identify key support and resistance levels.
🔵Use the conditional probability table to gauge the likelihood of reaching specific targets.
🔵Adjust your strategy based on the historical performance of the market.
Example Use Cases
1. Day Trading
Use the daily ATR levels to set intraday targets and stop-loss levels.
Monitor the conditional probability table to adjust your expectations based on the opening range.
2. Swing Trading
Use the weekly ATR levels to identify longer-term support and resistance levels.
3. Scalping
Use the ATR bands to identify overbought and oversold conditions.
Use the conditional probability table to quickly assess the likelihood of price movements.

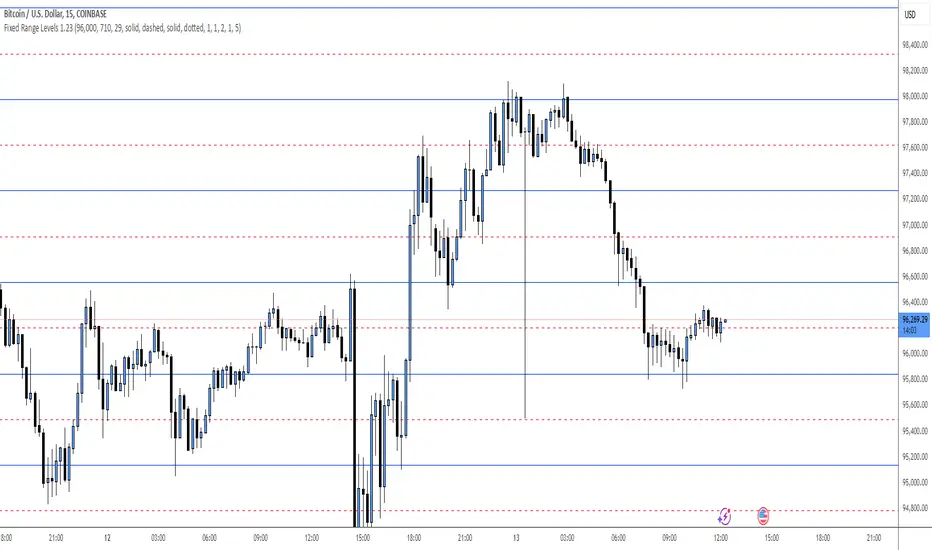
Fixed Range LevelsThis indicator draws horizontal price levels on your chart based on a starting price and a range size that you define. It can also draw midpoint lines between the main levels if enabled.
Here's a breakdown of its functionality:
Key Features:
Starting Price:
You define a starting price (e.g., 21630).
The indicator calculates a corrected base price by rounding the starting price to the nearest multiple of the range size.
Range Size:
You define a range size (e.g., 71).
The indicator draws horizontal lines at intervals of the range size above and below the corrected base price.
Dual Ranges:
You can define two range sizes (e.g., 71 and 29).
The indicator can draw levels for both ranges simultaneously or individually, depending on your settings.
Midpoint Lines:
If enabled, the indicator draws midpoint lines between the main levels.
For example, if the main levels are at 21584 and 21655, the midpoint line will be at 21619.5.
Customizable Styles:
You can customize the line style (solid, dotted, dashed) and color for both the main levels and midpoint lines.
Dynamic Levels:
The levels are recalculated and redrawn dynamically based on the starting price and range size.
How It Works:
Corrected Base Price Calculation:
The indicator calculates the corrected base price using the formula:
pinescript
Copy
correctedBasePrice = math.floor(startingPrice / rangeSize) * rangeSize
For example, if startingPrice = 21630 and rangeSize = 71:
Copy
correctedBasePrice = math.floor(21630 / 71) * 71 = 304 * 71 = 21584
Drawing Levels:
The indicator draws horizontal lines at intervals of the range size above and below the corrected base price.
For example, if rangeSize = 71 and maxLevels = 5, the levels will be drawn at:
Copy
21584 - (5 * 71) = 21249
21584 - (4 * 71) = 21320
...
21584 + (5 * 71) = 21939
Midpoint Lines:
If enabled, the indicator draws midpoint lines between the main levels.
For example, if the main levels are at 21584 and 21655, the midpoint line will be at:
Copy
(21584 + 21655) / 2 = 21619.5
Dual Ranges:
If you enable both ranges, the indicator will draw levels for both range sizes simultaneously.
For example, if rangeSize1 = 71 and rangeSize2 = 29, the indicator will draw two sets of levels:
Levels at intervals of 71 (e.g., 21584, 21655, 21726, ...).
Levels at intervals of 29 (e.g., 21634, 21663, 21692, ...).
Example Use Case:
Imagine you're trading a stock or cryptocurrency, and you want to identify key support and resistance levels based on a specific price range. Here's how you can use this indicator:
Set the Starting Price:
For example, if the current price is 21630, you can set this as the starting price.
Define the Range Size:
If you believe the price moves in increments of 71, set rangeSize1 = 71.
If you also want to track smaller increments of 29, set rangeSize2 = 29.
Enable Midpoint Lines:
If you want to see the midpoint between the main levels, enable Show Midpoint Line.
Customize Line Styles:
Choose different colors and styles for the main levels and midpoint lines to make them visually distinct.
Analyze the Chart:
The indicator will draw horizontal lines at the specified intervals, helping you identify potential support, resistance, and midpoint levels.
Why Is This Useful?
Support and Resistance Levels:
The horizontal lines act as dynamic support and resistance levels based on the range size you define.
Price Targets:
You can use the levels to identify potential price targets or areas where the price might reverse.
Midpoint Analysis:
The midpoint lines can help you identify areas of consolidation or potential breakout points.
Flexibility:
You can customize the range sizes, colors, and styles to suit your trading strategy.
Summary:
This indicator is a powerful tool for traders who want to visualize price levels and midpoints based on a specific range size. It helps you identify key levels for support, resistance, and potential price targets, making it easier to plan your trades.
PERFECT PIVOT RANGE DR ABIRAM SIVPRASAD (PPR)PERFECT PIVOT RANGE (PPR) by Dr. Abhiram Sivprasad
The Perfect Pivot Range (PPR) indicator is designed to provide traders with a comprehensive view of key support and resistance levels based on pivot points across different timeframes. This versatile tool allows users to visualize daily, weekly, and monthly pivots along with high and low levels from previous periods, helping traders identify potential areas of price reversals or breakouts.
Features:
Multi-Timeframe Pivots:
Daily, weekly, and monthly pivot levels (Pivot Point, Support 1 & 2, Resistance 1 & 2).
Helps traders understand price levels across various timeframes, from short-term (daily) to long-term (monthly).
Previous High-Low Levels:
Displays the previous week, month, and day high-low levels to highlight key zones of historical support and resistance.
Traders can easily see areas of price action from prior periods, giving context for future price movements.
Customizable Options:
Users can choose which pivot levels and high-lows to display, allowing for flexibility based on trading preferences.
Visual settings can be toggled on and off to suit different trading strategies and timeframes.
Real-Time Data:
All pivot points and levels are dynamically calculated based on real-time price data, ensuring accurate and up-to-date information for decision-making.
How to Use:
Pivot Points: Use daily, weekly, or monthly pivot points to find potential support or resistance levels. Prices above the pivot suggest bullish sentiment, while prices below indicate bearishness.
Previous High-Low: The high-low levels from previous days, weeks, or months can serve as critical zones where price may reverse or break through, indicating potential trade entries or exits.
Confluence: When pivot points or high-low levels overlap across multiple timeframes, they become even stronger levels of support or resistance.
This indicator is suitable for all types of traders (scalpers, swing traders, and long-term investors) looking to enhance their technical analysis and make more informed trading decisions.
Here are three detailed trading strategies for using the Perfect Pivot Range (PPR) indicator for options, stocks, and commodities:
1. Options Buying Strategy with PPR Indicator
Strategy: Buying Call and Put Options Based on Pivot Breakouts
Objective: To capitalize on sharp price movements when key pivot levels are breached, leading to high returns with limited risk in options trading.
Timeframe: 15-minute to 1-hour chart for intraday option trading.
Steps:
Identify the Key Levels:
Use weekly pivots for intraday trading, as they provide more significant levels for options.
Enable the "Previous Week High-Low" to gauge support and resistance from the previous week.
Call Option Setup (Bullish Breakout):
Condition: If the price breaks above the weekly pivot point (PP) with high momentum (indicated by a strong bullish candle), it signifies potential bullishness.
Action: Buy Call Options at the breakout of the weekly pivot.
Confirmation: Check if the price is sustaining above the pivot with a minimum of 1-2 candles (depending on timeframe) and the first resistance (R1) isn’t too far away.
Target: The first resistance (R1) or previous week’s high can be your target for exiting the trade.
Stop-Loss: Set a stop-loss just below the pivot point (PP) to limit risk.
Put Option Setup (Bearish Breakdown):
Condition: If the price breaks below the weekly pivot (PP) with strong bearish momentum, it’s a signal to expect a downward move.
Action: Buy Put Options on a breakdown below the weekly pivot.
Confirmation: Ensure that the price is closing below the pivot, and check for declining volumes or bearish candles.
Target: The first support (S1) or the previous week’s low.
Stop-Loss: Place the stop-loss just above the pivot point (PP).
Example:
Let’s say the weekly pivot point (PP) is at 1500, the price breaks above and sustains at 1510. You buy a Call Option with a strike price near 1500, and the target will be the first resistance (R1) at 1530.
2. Stock Trading Strategy with PPR Indicator
Strategy: Swing Trading Using Pivot Points and Previous High-Low Levels
Objective: To capture mid-term stock price movements using pivot points and historical high-low levels for better trade entries and exits.
Timeframe: 1-day or 4-hour chart for swing trading.
Steps:
Identify the Trend:
Start by determining the overall trend of the stock using the weekly pivots. If the price is consistently above the pivot point (PP), the trend is bullish; if below, the trend is bearish.
Buy Setup (Bullish Trend Reversal):
Condition: When the stock bounces off the weekly pivot point (PP) or previous week’s low, it signals a bullish reversal.
Action: Enter a long position near the pivot or previous week’s low.
Confirmation: Look for a bullish candle pattern or increasing volumes.
Target: Set your first target at the first resistance (R1) or the previous week’s high.
Stop-Loss: Place your stop-loss just below the previous week’s low or support (S1).
Sell Setup (Bearish Trend Reversal):
Condition: When the price hits the weekly resistance (R1) or previous week’s high and starts to reverse downwards, it’s an opportunity to short-sell the stock.
Action: Enter a short position near the resistance.
Confirmation: Watch for bearish candle patterns or decreasing volume at the resistance.
Target: Your first target would be the weekly pivot point (PP), with the second target as the previous week’s low.
Stop-Loss: Set a stop-loss just above the resistance (R1).
Use Previous High-Low Levels:
The previous week’s high and low are key levels where price reversals often occur, so use them as reference points for potential entry and exit.
Example:
Stock XYZ is trading at 200. The previous week’s low is 195, and it bounces off that level. You enter a long position with a target of 210 (previous week’s high) and place a stop-loss at 193.
3. Commodity Trading Strategy with PPR Indicator
Strategy: Trend Continuation and Reversal in Commodities
Objective: To capitalize on the strong trends in commodities by using pivot points as key support and resistance levels for trend continuation and reversal.
Timeframe: 1-hour to 4-hour charts for commodities like Gold, Crude Oil, Silver, etc.
Steps:
Identify the Trend:
Use monthly pivots for long-term commodities trading since commodities often follow macroeconomic trends.
The monthly pivot point (PP) will give an idea of the long-term trend direction.
Trend Continuation Setup (Bullish Commodity):
Condition: If the price is consistently trading above the monthly pivot and pulling back towards the pivot without breaking below it, it indicates a bullish continuation.
Action: Enter a long position when the price tests the monthly pivot (PP) and starts moving up again.
Confirmation: Look for a strong bullish candle or an increase in volume to confirm the continuation.
Target: The first resistance (R1) or previous month’s high.
Stop-Loss: Place the stop-loss below the monthly pivot (PP).
Trend Reversal Setup (Bearish Commodity):
Condition: When the price reverses from the monthly resistance (R1) or previous month’s high, it’s a signal for a bearish reversal.
Action: Enter a short position at the resistance level.
Confirmation: Watch for bearish candle patterns or decreasing volumes at the resistance.
Target: Set your first target as the monthly pivot (PP) or the first support (S1).
Stop-Loss: Stop-loss should be placed just above the resistance level.
Using Previous High-Low for Swing Trades:
The previous month’s high and low are important in commodities. They often act as barriers to price movement, so traders should look for breakouts or reversals near these levels.
Example:
Gold is trading at $1800, with a monthly pivot at $1780 and the previous month’s high at $1830. If the price pulls back to $1780 and starts moving up again, you enter a long trade with a target of $1830, placing your stop-loss below $1770.
Key Points Across All Strategies:
Multiple Timeframes: Always use a combination of timeframes for confirmation. For example, a daily chart may show a bullish setup, but the weekly pivot levels can provide a larger trend context.
Volume: Volume is key in confirming the strength of price movement. Always confirm breakouts or reversals with rising or declining volume.
Risk Management: Set tight stop-loss levels just below support or above resistance to minimize risk and lock in profits at pivot points.
Each of these strategies leverages the powerful pivot and high-low levels provided by the PPR indicator to give traders clear entry, exit, and risk management points across different markets

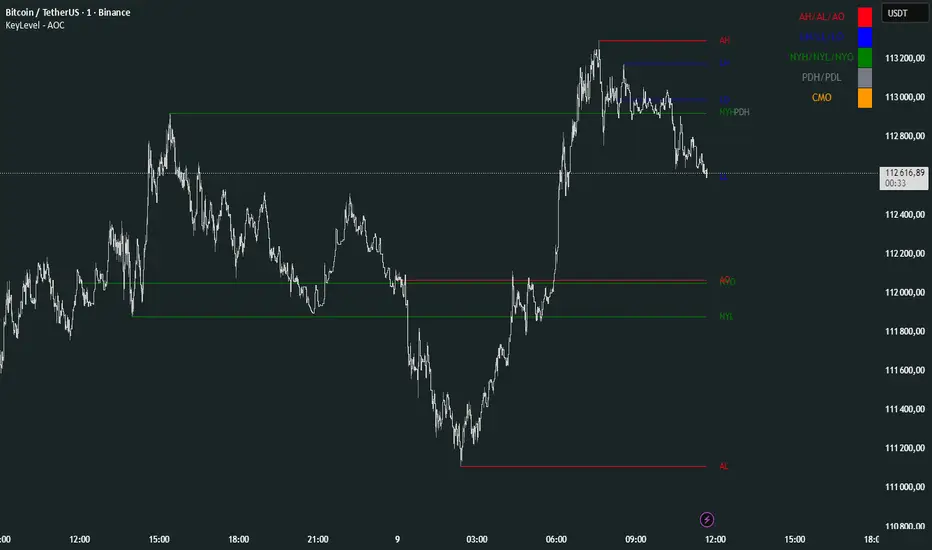
KeyLevel - AOCKeyLevel - AOC
✨ Features📈 Session Levels: Tracks high, low, and open prices for Asian, London, and New York sessions.📅 Multi-Timeframe Levels: Plots previous day, week, month, quarter, and yearly open/high/low levels.⚙️ Preset Modes: Choose Scalp, Intraday, or Swing presets for tailored level displays.🎨 Customizable Visuals: Adjust colors, line styles, and label abbreviations for clarity.🖼️ Legend Table: Displays a color-coded legend for quick reference to session and period levels.🔧 Flexible Settings: Enable/disable specific sessions or levels and customize UTC offsets.
🛠️ How to Use
Add to Chart: Apply the "KeyLevel - AOC" indicator on TradingView.
Configure Inputs:
Preset: Select Scalp, Intraday, or Swing, or use custom settings.
Session Levels: Toggle Asian, London, NY sessions and their open/high/low lines.
Period Levels: Enable/disable previous day, week, month, quarter, or yearly levels.
Visuals: Adjust colors, line widths, and label abbreviations.
Legend: Show/hide the legend table for level identification.
Analyze: Monitor key levels for support/resistance and session-based price action.
Track Trends: Use levels to identify breakouts, reversals, or consolidation zones.
🎯 Why Use It?
Dynamic Levels: Tracks critical price levels across multiple timeframes for comprehensive analysis.
Session Focus: Highlights key session price points for intraday trading strategies.
Customizable: Tailor displayed levels and visuals to match your trading style.
User-Friendly: Clear lines, labels, and legend table simplify price level tracking.
📝 Notes
Ensure timeframe compatibility (e.g., avoid daily charts for session levels).
Use M5 or higher timeframes for accurate session tracking; some levels disabled on M5.
Combine with indicators like RSI or MACD for enhanced trading signals.
Adjust UTC offset if session times misalign with your broker’s timezone.
Gann & Fibonacci Analysis for MSTRYes! Below is a step-by-step guide to performing Gann Analysis on MSTR in TradingView for the last year.
Step 1: Set Up the Chart
Open TradingView and search for MSTR (MicroStrategy).
Select the 1-day (D) timeframe to analyze the past year.
Set your chart to logarithmic scale (⚙ Settings → Scale → Log).
Enable grid lines for alignment (⚙ Settings → Appearance → Grid Lines).
Step 2: Identify Key Highs and Lows (Last Year)
Find the 52-week high and 52-week low for MSTR.
As of now:
52-Week High: ~$999 (March 2024).
52-Week Low: ~$280 (October 2023).
Step 3: Plot Gann Angles
Using TradingView's Gann Fan Tool:
Select "Gann Fan" (Press / and type “Gann Fan” to find it).
Start at the 52-week low (~$280, October 2023) and drag upwards.
Adjust the angles to match key levels:
1x1 (45°) → Main trendline
2x1 (26.5°) → Strong uptrend
4x1 (15°) → Weak trendline
1x2 (63.75°) → Strong resistance
Repeat the process from the 52-week high (~$999, March 2024) downward to see bearish angles.
Step 4: Apply Fibonacci & Gann Retracement Levels
Using Fibonacci Retracement:
Select "Fibonacci Retracement" tool.
Draw from 52-week high ($999) to 52-week low ($280).
Enable key Fibonacci levels:
23.6% ($816)
38.2% ($678)
50% ($640)
61.8% ($550)
78.6% ($430)
Watch for price reactions near these levels.
Using Gann Retracement Levels:
Select "Gann Box" in TradingView.
Draw from 52-week high ($999) to low ($280).
Enable key Gann retracement levels:
12.5% ($912)
25% ($850)
37.5% ($768)
50% ($640)
62.5% ($550)
75% ($480)
87.5% ($350)
Identify confluences with Gann angles and Fibonacci levels.
Step 5: Identify Significant Dates & Time Cycles
Use "Date Range" Tool in TradingView.
Mark major turning points:
High → Low: ~180 days (Half-year cycle).
Low → High: ~90 days (Quarter cycle).
Use Square-Outs (Time = Price method):
Example: If MSTR hit $500, check 500 days from key events.
Mark key anniversaries of past highs/lows for possible reversals.
Step 6: Analyze and Trade Execution
✅ If MSTR is at a Gann angle + Fibonacci level + key date → Expect a reaction.
✅ Use RSI, MACD, and Volume for extra confirmation.
✅ Set Stop-Loss at nearest Gann support/resistance.

AdvancedLines (FiboBands) - PaSKaL
Overview :
AdvancedLines (FiboBands) - PaSKaL is an advanced technical analysis tool designed to automate the plotting of key Fibonacci retracement levels based on the highest high and lowest low over a customizable period. This indicator helps traders identify critical price zones such as support, resistance, and potential trend reversal or continuation points.
By using AdvancedLines (FiboBands) - PaSKaL , traders can easily spot key areas where the price is likely to reverse or consolidate, or where the trend may continue. It is particularly useful for trend-following, scalping, and range-trading strategies.
Key Features:
Automatic Fibonacci Level Calculation :
- The indicator automatically calculates and plots key Fibonacci levels (0.236, 0.382, 0.5, 0.618, and 0.764), which are crucial for identifying potential support and resistance levels in the market.
Adjustable Parameters :
- Bands Length: You can adjust the bands_length setting to change the number of bars used for calculating the highest high and lowest low. This gives flexibility for using the indicator on different timeframes and trading styles.
- Visibility: The Fibonacci levels, as well as the midline (0.5 Fibonacci level), can be shown or hidden based on your preference.
- Color Customization: You can change the color of each Fibonacci level and background fills to suit your chart preferences.
Fibonacci Levels
- The main Fibonacci levels plotted are:
- 0.236 – Minor support/resistance level
- 0.382 – Moderate retracement level
- 0.5 – Midpoint retracement, often used as a key level
- 0.618 – Golden ratio, considered one of the most important Fibonacci levels
- 0.764 – Strong reversal level, often indicating a continuation or change in trend
Background Fill
- The indicator allows you to fill the background between the Fibonacci levels and the bands with customizable colors. This makes it easier to visually highlight key zones on the chart.
How the Indicator Works:
AdvancedLines (FiboBands) - PaSKaL calculates the range (difference between the highest high and the lowest low) over a user-defined number of bars (e.g., 300). Fibonacci levels are derived from this range, helping traders identify potential price reversal points.
Mathematical Basis :
Fibonacci retracement levels are based on the Fibonacci sequence, where each number is the sum of the previous two (0, 1, 1, 2, 3, 5, 8, 13, etc.). The ratios derived from this sequence (such as 0.618 and 0.382) have been widely observed in nature, market cycles, and price movements. These ratios are used to forecast potential price retracements or continuation points after a major price move.
Fibonacci Levels Calculation :
Identify the Range: The highest high and the lowest low over the defined period are calculated.
Apply Fibonacci Ratios: Fibonacci ratios (0.236, 0.382, 0.5, 0.618, and 0.764) are applied to this range to calculate the corresponding price levels.
Plot the Levels: The indicator automatically plots these levels on your chart.
Customizing Fibonacci Levels & Colors:
The "AdvancedLines (FiboBands) - PaSKaL" indicator offers various customization options for Fibonacci levels, colors, and visibility:
Fibonacci Level Ratios:
- You can customize the Fibonacci level ratios through the following inputs:
- Fibo Level 1: 0.764
- Fibo Level 2: 0.618
- Fibo Level 3: 0.5
- Fibo Level 4: 0.382
- Fibo Level 5: 0.236
- These levels determine key areas where price may reverse or pause. You can adjust these ratios based on your trading preferences.
Fibonacci Level Colors:
- Each Fibonacci level can be assigned a different color to make it more distinguishable on your chart:
- Fibo Level 1 Color (default: Yellow)
- Fibo Level 2 Color (default: Orange)
- Fibo Level 3 Color (default: Green)
- Fibo Level 4 Color (default: Red)
- Fibo Level 5 Color (default: Blue)
- You can change these colors to fit your visual preferences or to align with your existing chart themes.
Visibility of Fibonacci Levels:
- You can choose whether to display each Fibonacci level using the following visibility inputs:
- Show Fibo Level 1 (0.764): Display or hide this level.
- Show Fibo Level 2 (0.618): Display or hide this level.
- Show Fibo Level 3 (0.5): Display or hide this level.
- Show Fibo Level 4 (0.382): Display or hide this level.
- Show Fibo Level 5 (0.236): Display or hide this level.
- This allows you to customize the indicator according to the specific Fibonacci levels that are most relevant to your trading strategy.
Background Fill Color
- The background between the Fibonacci levels and price bands can be filled with customizable colors:
- Fill Color for Upper Band & Fibo Level 1: This color will fill the area between the upper band and Fibonacci Level 1.
- Fill Color for Lower Band & Fibo Level 5: This color will fill the area between the lower band and Fibonacci Level 5.
- Adjusting these colors helps highlight critical zones where price may reverse or consolidate.
How to Use AdvancedLines (FiboBands) - PaSKaL in Trading :
Range Trading :
Range traders typically buy at support and sell at resistance. Fibonacci levels provide excellent support and resistance zones in a ranging market.
Example: If price reaches the 0.618 level in an uptrend, it may reverse, providing an opportunity to sell.
Conversely, if price drops to the 0.382 level, a bounce might occur, and traders can buy, anticipating the market will stay within the range.
Trend-following Trading :
For trend-following traders, Fibonacci levels act as potential entry points during a retracement. After a strong trend, price often retraces to one of the Fibonacci levels before continuing in the direction of the trend.
Example: In a bullish trend, when price retraces to the 0.382 level, it could be a signal to buy, as the price might resume its upward movement after the correction.
In a bearish trend, retracements to levels like 0.618 or 0.764 could provide optimal opportunities for shorting as the price resumes its downward movement.
Scalping :
Scalpers focus on short-term price movements. Fibonacci levels can help identify precise entry and exit points for quick trades.
Example: If price is fluctuating in a narrow range, a scalper can enter a buy trade at 0.236 and exit at the next Fibonacci level, such as 0.382 or 0.5, capturing small but consistent profits.
Stop-Loss and Take-Profit Levels :
Fibonacci levels can also help in setting stop-loss and take-profit levels.
Example: In a bullish trend, you can set a stop-loss just below the 0.236 level and a take-profit at 0.618.
In a bearish trend, set the stop-loss just above the 0.382 level and the take-profit at 0.764.
Identifying Reversals and Continuations :
Reversals: When price reaches a Fibonacci level and reverses direction, it may indicate the end of a price move.
Trend Continuation: If price bounces off a Fibonacci level and continues in the same direction, this may signal that the trend is still intact.
Conclusion :
AdvancedLines (FiboBands) - PaSKaL is an essential tool for any trader who uses Fibonacci retracements in their trading strategy. By automatically plotting key Fibonacci levels, this indicator helps traders quickly identify support and resistance zones, forecast potential reversals, and make more informed trading decisions.
For Trend-following Traders: Use Fibonacci levels to find optimal entry points after a price retracement.
For Range Traders: Identify key levels where price is likely to reverse or bounce within a range.
For Scalpers: Pinpoint small price movements and take advantage of quick profits by entering and exiting trades at precise Fibonacci levels.
By incorporating AdvancedLines (FiboBands) - PaSKaL into your trading setup, you will gain a deeper understanding of price action, improve your decision-making process, and enhance your overall trading performance.

ICT IPDA Liquidity Matrix By AlgoCadosThe ICT IPDA Liquidity Matrix by AlgoCados is a sophisticated trading tool that integrates the principles of the Interbank Price Delivery Algorithm (IPDA), as taught by The Inner Circle Trader (ICT). This indicator is meticulously designed to support traders in identifying key institutional levels and liquidity zones, enhancing their trading strategies with data-driven insights. Suitable for both day traders and swing traders, the tool is optimized for high-frequency and positional trading, providing a robust framework for analyzing market dynamics across multiple time horizons.
# Key Features
Multi-Time Frame Analysis
High Time Frame (HTF) Levels : The indicator tracks critical trading levels over multiple days, specifically at 20, 40, and 60-day intervals. This functionality is essential for identifying long-term trends and significant support and resistance levels that aid in strategic decision-making for swing traders and positional traders.
Low Time Frame (LTF) Levels : It monitors price movements within 20, 40, and 60-hour intervals on lower time frames. This granularity provides a detailed view of intraday price actions, which is crucial for scalping and short-term trading strategies favored by day traders.
Daily Open Integration : The indicator includes the daily opening price, providing a crucial reference point that reflects the market's initial sentiment. This feature helps traders assess the market's direction and volatility, enabling them to make informed decisions based on the day's early movements, which is particularly useful for day trading strategies.
IPDA Reference Points : By leveraging IPDA's 20, 40, and 60-period lookbacks, the tool identifies Key Highs and Lows, which are used by IPDA as Draw On Liquidity. IPDA is an electronic and algorithmic system engineered for achieving price delivery efficiency, as taught by ICT. These reference points serve as benchmarks for understanding institutional trading behavior, allowing traders to align their strategies with the dominant market forces and recognize institutional key levels.
Dynamic Updates and Overlap Management : The indicator is updated daily at the beginning of a new daily candle with the latest market data, ensuring that traders operate with the most current information. It also features intelligent overlap management that prioritizes the most relevant levels based on the timeframe hierarchy, reducing visual clutter and enhancing chart readability.
Comprehensive Customization Options : Traders can tailor the indicator to their specific needs through an extensive input menu. This includes toggles for visibility, line styles, color selections, and label display preferences. These customization options ensure that the tool can adapt to various trading styles and preferences, enhancing user experience and analytical capabilities.
User-Friendly Interface : The tool is designed with a user-friendly interface that includes clear, concise labels for all significant levels. It supports various font families and sizes, making it easier to interpret and act upon the displayed data, ensuring that traders can focus on making informed trading decisions without being overwhelmed by unnecessary information.
# Usage Note
The indicator is segmented into two key functionalities:
LTF Displays : The Low Time Frame (LTF) settings are exclusive to timeframes up to 1 hour, providing detailed analysis for intraday traders. This is crucial for traders who need precise and timely data to make quick decisions within the trading day.
HTF Displays : The High Time Frame (HTF) settings apply to the daily timeframe and any shorter intervals, allowing for comprehensive analysis over extended periods. This is beneficial for swing traders looking to identify broader trends and market directions.
# Inputs and Configurations
BINANCE:BTCUSDT
Offset: Adjustable setting to shift displayed data horizontally for better visibility, allowing traders to view past levels and make informed decisions based on historical data.
Label Styles: Choose between compact or verbose label formats for different levels, offering flexibility in how much detail is displayed on the chart.
Daily Open Line: Customizable line style and color for the daily opening price, providing a clear visual reference for the start of the trading day.
HTF Levels: Configurable high and low lines for HTF with options for style and color customization, allowing traders to highlight significant levels in a way that suits their trading style.
LTF Levels: Similar customization options for LTF levels, ensuring flexibility in how data is presented, making it easier for traders to focus on the most relevant intraday levels.
Text Utils: Settings for font family, size, and text color, allowing for personalized display preferences and ensuring that the chart is both informative and aesthetically pleasing.
# Advanced Features
Overlap Management : The script intelligently handles overlapping levels, particularly where multiple timeframes intersect, by prioritizing the more significant levels and removing redundant ones. This ensures that the charts remain clear and focused on the most critical data points, allowing traders to concentrate on the most relevant market information.
Real-Time Updates : The indicator updates its calculations at the start of each new daily bar, incorporating the latest market data to provide timely and accurate trading signals. This real-time updating is crucial for traders who rely on up-to-date information to execute their strategies effectively and make informed trading decisions.
# Example Use Cases
Scalpers/Day traders: Can utilize the LTF features to make rapid decisions based on hourly market movements, identifying short-term trading opportunities with precision.
Swing Traders: Will benefit from the HTF analysis to identify broader trends and key levels that influence longer-term market movements, enabling them to capture significant market swings.
By providing a clear, detailed view of key market dynamics, the ICT IPDA Liquidity Matrix by AlgoCados empowers traders to make more informed and effective trading decisions, aligning with institutional trading methodologies and enhancing their market understanding.
# Usage Disclaimer
This tool is designed to assist in trading decisions, but it should be used in conjunction with other analysis methods and risk management strategies. Trading involves significant risk, and it is essential to understand the market conditions thoroughly before making trading decisions.

Daily Weekly Monthly Highs & Lows [Dova Lazarus]Daily Weekly Monthly Highs & Lows
📊 Overview
This Pine Script indicator displays key support and resistance levels by plotting the highs and lows from Daily, Weekly, and Monthly timeframes on your current chart. It's designed as an educational tool to help traders understand multi-timeframe analysis and identify significant price levels.
🎯 Key Features
Multi-Timeframe Support & Resistance
- Daily Levels: Shows previous daily highs and lows
- Weekly Levels: Displays weekly highs and lows
- Monthly Levels: Plots monthly highs and lows
- Smart Display: Only shows relevant timeframes based on your current chart timeframe
Fully Customizable Appearance
- Individual Colors: Set unique colors for each timeframe
- Line Styles: Choose between Solid, Dashed, or Dotted lines
- Line Width: Adjust thickness from 1-4 pixels
- Lookback Periods: Control how many historical levels to display
User-Friendly Options
- Enable/Disable: Toggle any timeframe on/off
- Line Extension: Option to extend lines into the future
- Clean Interface: Organized settings groups for easy configuration
🔧 Settings
Timeframes Group
- Show Daily/Weekly/Monthly Levels: Enable or disable each timeframe
- Lookback Periods: Number of historical levels to display (1-10)
Line Settings Group
- Color: Choose custom colors for each timeframe
- Style: Select line appearance (Solid/Dashed/Dotted)
- Width: Set line thickness (1-4 pixels)
Display Options Group
- Extend Lines Forward: Project lines 20 bars into the future
📈 How to Use
1. Add to Chart: Apply the indicator to any timeframe chart
2. Configure Timeframes: Enable the timeframes you want to see
3. Customize Appearance: Set colors and line styles for easy identification
4. Identify Levels: Use the plotted levels as potential support/resistance zones
5. Plan Trades: Look for price reactions at these key levels
💡 Trading Applications
- Support & Resistance: Identify key price levels where reversals may occur
- Entry Points: Look for bounces or breaks at these levels
- Stop Loss Placement: Use levels to set logical stop losses
- Target Setting: Previous highs/lows can serve as profit targets
- Multi-Timeframe Analysis: Understand the bigger picture context
🎓 Educational Value
This indicator is perfect for:
- Learning Pine Script: Clean, well-commented code structure
- Understanding Multi-Timeframe Analysis: See how different timeframes interact
- Practicing Technical Analysis: Identify key support/resistance concepts
- Code Study: Full variable names and detailed comments for learning
⚙️ Technical Details
- Version: Pine Script v6
- Overlay: True (plots directly on price chart)
- Max Lines: 500 (handles multiple timeframes efficiently)
- Compatibility: Works on all timeframes (shows relevant levels only)
🔍 What Makes This Different
- Educational Focus: Designed for learning with clear code structure
- Simplified Interface: Easy-to-use settings without overwhelming options
- Visual Clarity: Clean line display with customizable appearance
- Practical Application: Real trading tool, not just a demonstration
📋 Requirements
- TradingView account (any plan)
- Basic understanding of support/resistance concepts
- Any chart timeframe (indicator adapts automatically)
🚀 Quick Start
1. Add indicator to your chart
2. Default settings work great out of the box
3. Customize colors if desired (Green=Daily, Orange=Weekly, Red=Monthly)
4. Watch for price reactions at the plotted levels
5. Use as part of your technical analysis toolkit
---
*This indicator is designed as an educational tool and should be used in conjunction with other forms of analysis. Past performance does not guarantee future results.*

SHA Multi Pivot Points -v1.0.0🔎Using Pivot Points in Trading
Traders use PPs to help determine predefined support and resistance levels to guide their trading strategies. In addition, traders identify potential price reversals, trend direction, and breakout opportunities:
Trend identification: PPs act as a reference level to gauge market sentiment. If the price opens above the PP and remains above it, traders interpret this as an uptrend. Conversely, if the price opens below the pivot point and stays below, it suggests a downtrend.
Support and resistance determination: Pivot levels are natural barriers where price reactions frequently occur. Traders may enter long positions near support levels, expecting a price bounce, or if the price approaches resistance levels, traders may consider shorting the asset.
Breakout trading: When the price breaks above resistance or support, it may indicate strong momentum for further movement.
Reversal identification: Traders also look for failed breakouts or price rejections at pivot levels to anticipate reversals.
Trading strategy combinations: Traders can improve accuracy by combining PPs with other technical analysis indicators.
1. Camarilla Pivot Points
📌 Overview:
Developed by Nick Scott in 1989, Camarilla Pivot Points are designed for short-term, intraday trading. Unlike traditional pivots, Camarilla levels are tighter and more responsive, making them useful in volatile markets.
📐 Key Levels:
It generates eight levels:
- Resistance: Initial Level (R1), Mid-range Level (R2), Sell Reversal Level (R3), Breakout Level (R4)
- Support: Initial Level (S1), Mid-range Level (S2), Buy Reversal Level (S3), Breakout Level (S4)
✅ How to Use:
- S1/R1 + RSI or volume divergence to confirm weak momentum and early reversals.
- S2/R2 with price action patterns to enter early on major moves before L3/H3 get tested.
- S3/R3: Mean-reversion zones → price often reverses.
- Break of S4/R4: Strong breakout → trend-following signal.
- Combine with volume or candlestick confirmation for entries.
🔹 2. Floor (Standard) Pivot Points
📌 Overview:
This is the most traditional pivot method, widely used by floor traders. It’s symmetrical and provides a clear central pivot point with equally spaced support and resistance levels.
📐 Key Levels:
- Povit Points : Average price (PPs)
- Resistance : First price ceiling (R1), Stronger ceiling (R2), Extreme resistance (R3)
- Support : First price floor (S1), Stronger floor (S2), Extreme support (S3)
✅ How to Use:
- Above PPs = bullish bias; Below PPs = bearish bias.
- S1/R1 are most used for intraday targets.
- S2–S3/R2–R3 indicate potential extreme moves.
- Often used in combination with momentum indicators.
🔹 3. Woodie Pivot Points
📌 Overview:
Woodie’s pivot formula gives double weight to the closing price, emphasizing the most recent session's sentiment.
📐 Key Levels:
- Povit Points : Weighted average (PPs)
- Resistance : First price ceiling (R1), Stronger resistance (R2)
- Support : First price floor (S1), Stronger support (S2)
✅ How to Use:
- Works best in fast-moving markets.
- PPs acts as a momentum-based balance level.
- Good for scalpers and momentum traders.
🔹 4. Fusion Pivot Points
📌 Overview:
This method differs significantly — it calculates only one support and one resistance level, adjusting based on the relationship between the open and close.
📐 Key Levels:
- Povit Points : Single directional (PPs)
- Resistance : Potential ceiling (R)
- Support : Potential floor (S)
✅ How to Use:
- Not symmetrical → more responsive to price behavior.
- Best for breakout or reversal strategies.
- Use when you're expecting directional momentum.
🔹 5. Classic Pivot Points (Traditional)
📌 Overview:
Also known as Standard or Traditional Pivot Points, this is the default method used by most charting platforms. It offers a balanced and simple framework.
📐 Key Levels:
- Povit Points : Central price level (PPs)
- Resistance : First ceiling (R1), Stronger resistance (R2), Extreme resistance (R3)
- Support : First floor (S1), Stronger floor (S2), Extreme support (S3)
✅ How to Use:
- PPs is the market’s equilibrium point.
- Helps define market structure, bias, and trade zones.
- Combine with order blocks, RSI, or MACD for confirmation.
📊 Summary Comparison :
1. Camarilla Pivot Points
- Focus : Mean Reversion & Breakouts
- Best Use : Scalping, Day Trading
2. Floor Pivot Points
- Focus : General Support/Resistance
- Best Use : Intraday, Swing
3. Woodie Pivot Points
- Focus : Recent Close Emphasis
- Best Use : Momentum Trading
4. Fusion Pivot Points
- Focus : Trend/Breakout
- Best Use : Directional Breakouts
5. Classic Povit Points
- Focus : Market Structure
- Best Use : General Use
⚠️ Disclaimer
The information and tools provided in this script are for educational and informational purposes only. They do not constitute financial advice, investment recommendations, or a solicitation to buy or sell any financial instrument.
Trading in the financial markets involves risk of loss and is not suitable for every investor. You are solely responsible for your trading decisions. Always do your own research, use proper risk management, and consult a licensed financial advisor before making any financial decisions.

Support & Resistance External/Internal & BoS [sgbpulse]Market Structure Support & Resistance External/Internal & BoS
Overview: Smart & Fast Market Structure Analysis
The Market Structure "Support & Resistance External/Internal & BoS " indicator is designed to empower your technical analysis by automatically and precisely identifying significant support and resistance levels. It achieves this by pinpointing high and low Pivot Points, plus key Pre-Market High/Low levels.
Its unique strength lies in its dynamic adaptability to any timeframe and any asset you choose. This tool analyzes the relevant market structure for the current timeframe and asset, providing you with accurate and relevant levels in real-time. The indicator maintains a clean chart and swiftly displays all support, resistance, and Pre-Market levels for any asset, saving valuable analysis time and enabling you to get a clear and quick snapshot of the market.
How the Indicator Works
The indicator identifies and displays three critical types of key levels:
External Pivots: These are more significant pivot points, indicating important reversal points across a broader range of price movement, considering the current timeframe. The indicator draws dark green support lines (for low pivots) and dark red resistance lines (for high pivots) from these points.
Internal Pivots: These are shorter-term pivot points, signifying smaller corrections or reversals within the overall structure of the current timeframe. These lines provide additional areas of interest within the ranges of the External Pivots.
Pre-Market High/Low Levels: The indicator displays the High and Low reached during pre-market hours as distinct lines on the chart. Please note: These levels will only appear when the selected timeframe is lower than one day (e.g., 1-hour, 15-minute) and provided that the "Session extended trading hours" option is enabled in your TradingView chart settings. These levels are crucial for identifying potential opening ranges and critical support/resistance areas upon regular market open, especially for intraday trading.
Break of Structure (BoS) Identification
A key feature of this indicator is its ability to identify Break of Structure (BoS). When a support or resistance line is breached, the indicator changes the line's color to gray and displays a "Break of Structure" label, indicating a potential trend change or continuation:
External BoS: When an external support/resistance line is broken, a "BoS" label in red will appear. This is a strong signal for a potential shift in the primary market structure or a strong trend continuation.
Internal BoS: When an internal support/resistance line is broken, an "iBoS" label in green will appear. This indicates a break within the existing market structure, which can be used to confirm direction or identify shorter-term entry/exit opportunities.
Full Indicator Customization
The indicator provides maximum flexibility to suit any trading style and timeframe:
Number of Lines Displayed: You can choose how many support and resistance lines you want to see on your chart. The default is 15 lines, but you can increase or decrease this number according to your needs and desired level of detail.
External Pivot Settings: Define the number of bars before and after a pivot point required for External Pivot identification.
Internal Pivot Settings: Define the number of bars before and after a pivot point required for Internal Pivot identification.
Color Customization: Full control over colors! You can change the colors of the support and resistance lines, the colors of the Pre-Market levels, and also the colors of the BoS and iBoS labels to create a visual appearance that perfectly matches your personal preferences.
This flexibility allows you to adapt the indicator to your trading style and any timeframe you operate in, without needing to manually change settings each time.
Recommended Uses
Clean Chart & Quick Analysis: The indicator displays important levels clearly, enabling quick identification of areas of interest without visual clutter on the chart. This significantly saves analysis time and allows you to make faster decisions.
Critical Levels for Any Timeframe & Asset: Get precise and adaptive support and resistance, plus essential Pre-Market levels (in relevant timeframes), for any timeframe and on any asset you choose.
Trend Direction Identification: Clear support and resistance lines help understand market structure.
Breakout Confirmation: The BoS label provides visual confirmation of key level breaches, helping to confirm potential trend changes.
Locating Entry & Exit Points: Use these levels as potential areas of interest for trades, after confirming a breakout or reversal.
Finding Stop-Loss & Take-Profit Points: Strategically place protective stops and profit targets around these support and resistance levels.
Important Note
Like any technical indicator, Market Structure "Support & Resistance External/Internal & BoS " is a supplementary tool. It's highly recommended to use it in conjunction with additional analysis methods (such as price action analysis, other indicators, and fundamental analysis) for informed trading decisions. Financial markets are dynamic, and trading always carries inherent risk.

Godfather of Support & Resistance Godfather of Support & Resistance
Overview
The Godfather of Support & Resistance script is a powerful tool designed to help traders identify critical support and resistance levels on their charts. These price levels are vital for understanding market behavior, as they often act as turning points where prices reverse, consolidate, or break through. By automating the detection of these levels, this script simplifies your trading decisions and enhances your technical analysis.
How It Works
Pivot Points for Level Detection:
The script uses pivot points to identify potential support (lows) and resistance (highs) levels:
A pivot high is a local peak (a high surrounded by lower highs).
A pivot low is a local trough (a low surrounded by higher lows).
You can adjust the Pivot Length (pivotLen) input to control the sensitivity of detection. Smaller values detect more levels, while larger values focus on major levels.
Dynamic Grouping with Tolerance:
The script dynamically groups nearby price levels using a tolerance percentage. This tolerance is based on the level's price, making it adaptive to all types of assets (low- and high-priced).
For example, if the tolerance is set to 1% and a level is at $100, levels within $1 are grouped together.
Touch Count for Significance:
The script tracks how many times the price interacts with each level (touch count). Only levels that meet or exceed the Minimum Touches (minTouches) input are displayed on the chart. This ensures only meaningful levels are highlighted.
Clear Visual Representation:
Resistance Levels (Red Lines): Represent areas where the price tends to reverse downward.
Support Levels (Green Lines): Represent areas where the price tends to reverse upward.
Labels are added to each level (optional) to display the price and the number of touches for better decision-making.
Inputs You Can Customize
Minimum Touches to Show Level:
Set the minimum number of price interactions required for a level to be displayed.
Maximum Lines to Keep:
Limit the number of support and resistance lines displayed to keep your chart clean and focused.
Pivot Length:
Customize the sensitivity of pivot point detection. Smaller values detect more levels, while larger values focus on key levels.
Tolerance for Touch Detection (%):
Adjust the grouping tolerance as a percentage of the price. For example, 1% groups levels that are within 1% of each other.
How to Use
Apply the Script:
Add the script to your TradingView chart, and it will automatically detect and plot support and resistance levels.
Analyze the Levels:
Use Resistance Levels (red lines) as potential sell zones or areas to place stop-loss orders above.
Use Support Levels (green lines) as potential buy zones or areas to place stop-loss orders below.
Customize for Your Trading Style:
Adjust the inputs to match your preferred strategy and the timeframe or asset you're analyzing.
Example Use Case
Imagine you're analyzing a stock:
Resistance Level: The script identifies resistance at $150 with 3 touches. This might be a potential sell zone if the price struggles to break through.
Support Level: The script identifies support at $130 with 4 touches. This might be a potential buy zone if the price shows signs of bouncing upward.
Key Features
Automatically detects and plots support and resistance levels.
Tracks the number of price touches to filter out weak levels.
Adapts dynamically to price ranges using a percentage-based tolerance.
Fully customizable to suit different trading styles and assets.
Clean and professional chart display with a limit on the number of lines.
Notes
This script is for educational purposes only and should not be considered financial advice.
Always perform your own analysis and manage risk before making trading decisions.
Why Use This Script?
The Godfather of Support & Resistance script simplifies your trading decisions by automating the detection of critical price levels. Whether you're a beginner or an experienced trader, this script is designed to save you time and help you focus on making informed trades.
Start using it today to master the art of support and resistance trading!
Let me know if you need further refinements for this description!
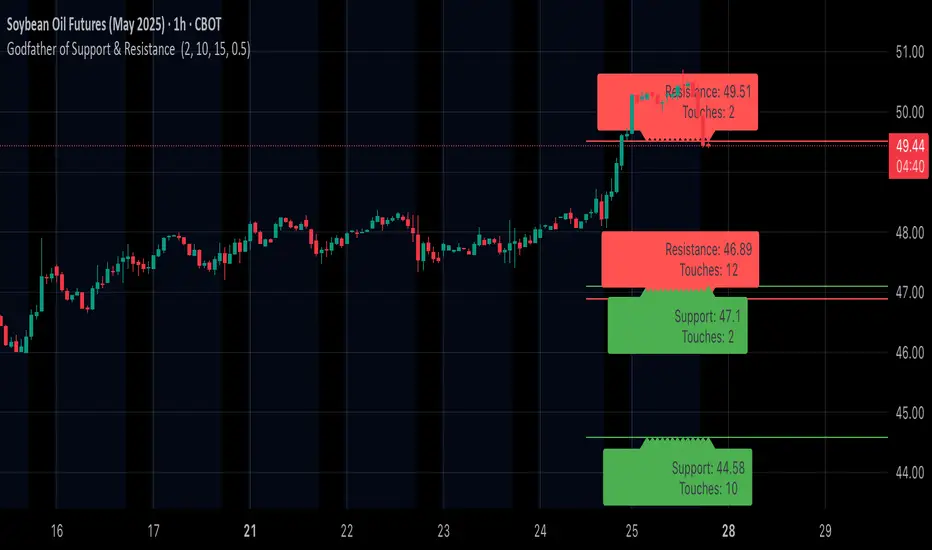
Fibonacci 3-D🟩 The Fibonacci 3-D indicator is a visual tool that introduces a three-dimensional approach to Fibonacci projections, leveraging market geometry. Unlike traditional Fibonacci tools that rely on two points and project horizontal levels, this indicator leverages slopes derived from three points to introduce a dynamic element into the calculations. The Fibonacci 3-D indicator uses three user-defined points to form a triangular structure, enabling multi-dimensional projections based on the relationships between the triangle’s sides.
This triangular framework forms the foundation for the indicator’s calculations, with each slope (⌳AB, ⌳AC, and ⌳BC) representing the rate of price change between its respective points. By incorporating these slopes into Fibonacci projections, the indicator provides an alternate approach to identifying potential support and resistance levels. The Fibonacci 3-D expands on traditional methods by integrating both historical price trends and recent momentum, offering deeper insights into market dynamics and aligning with broader market geometry.
The indicator operates across three modes, each defined by the triangular framework formed by three user-selected points (A, B, and C):
1-Dimensional (1-D): Fibonacci levels are based on a single side of the triangle, such as AB, AC, or BC. The slope of the selected side determines the angle of the projection, allowing users to analyze linear trends or directional price movements.
2-Dimensional (2-D): Combines two slopes derived from the sides of the triangle, such as AB and BC or AC and BC. This mode adds depth to the projections, accounting for both historical price swings and recent market momentum.
3-Dimensional (3-D): Integrates all three slopes into a unified projection. This mode captures the full geometric relationship between the points, revealing a comprehensive view of geometric market structure.
🌀 THEORY & CONCEPT 🌀
The Fibonacci 3-D indicator builds on the foundational principles of traditional Fibonacci analysis while expanding its scope to capture more intricate market structures. At its core, the indicator operates based on three user-selected points (A, B, and C), forming the vertices of a triangle that provides the structural basis for all calculations. This triangle determines the slopes, projections, and Fibonacci levels, aligning with the unique geometric relationships between the chosen points. By introducing multiple dimensions and leveraging this triangular framework, the indicator enables a deeper examination of price movements.
1️⃣ First Dimension (1-D)
In technical analysis, traditional Fibonacci retracement and extension tools operate as one-dimensional instruments. They rely on two price points, often a swing high and a swing low, to calculate and project horizontal levels at predefined Fibonacci ratios. These levels identify potential support and resistance zones based solely on the price difference between the selected points.
A one-dimensional Fibonacci showing levels derived from two price points (B and C).
The Fibonacci 3-D indicator extends this one-dimensional concept by introducing Ascending and Descending projection options. These options calculate the levels to align with the directional movement of price, creating sloped projections instead of purely horizontal levels.
1-D mode with an ascending projection along the ⌳BC slope aligned to the market's slope. Potential support is observed at 0.236 and 0.382, while resistance appears at 1.0 and 0.5.
2️⃣ Second Dimension (2-D)
The second dimension incorporates a second side of the triangle, introducing relationships between two slopes (e.g., ⌳AB and ⌳BC) to form a more dynamic three-point structure (A, B, and C) on the chart. This structure enables the indicator to move beyond the single-axis (price) calculations of traditional Fibonacci tools. The sides of the triangle (AB, AC, BC) represent slopes calculated as the rate of price change over time, capturing distinct components of market movement, such as trend direction and momentum.
2-D mode of the Fibonacci 3-D indicator using the ⌳AC slope with a descending projection. The Fibonacci projections align closely with observed market behavior, providing support at 0.236 and resistance at 0.618. Unlike traditional zigzag setups, this configuration uses two swing highs (A and B) and a swing low (C). The alignment along the descending slope highlights the geometric relationships between selected points in identifying potential support and resistance levels.
3️⃣ Third Dimension (3-D)
The third dimension expands the analysis by integrating all three slopes into a unified calculation, encompassing the entire triangle structure formed by points A, B, and C. Unlike the second dimension, which analyzes pairwise slope relationships, the 3-D mode reflects the combined geometry of the triangle. Each slope contributes a distinct perspective: AB and AC provide historical context, while BC emphasizes the most recent price movement and is given greater weight in the calculations to ensure projections remain responsive to current dynamics.
Using this integrated framework, the 3-D mode dynamically adjusts Fibonacci projections to balance long-term patterns and short-term momentum. The projections extend outward in alignment with the triangle’s geometry, offering a comprehensive framework for identifying potential support and resistance zones and capturing market structures beyond the scope of simpler 1-D or 2-D modes.
Three-dimensional Fibonacci projection using the ⌳AC slope, aligning closely with the market's directional movement. The projection highlights key levels: resistance at 0.0 and 0.618, and support at 1.0, 0.786, and 0.382.
By leveraging all three slopes simultaneously, the 3-D mode introduces a level of complexity particularly suited for volatile or non-linear markets. The weighted slope calculations ensure no single price movement dominates the analysis, allowing the projections to adapt dynamically to the broader market structure while remaining sensitive to recent momentum.
Three-dimensional ascending projection. In 3D mode, the indicator integrates all three slopes to calculate the angle of projection for the Fibonacci levels. The resulting projections adapt dynamically to the overall geometry of the ABC structure, aligning with the market’s current direction.
🔂 Interactions: Dimensions. Slope Source, Projections, and Orientation
The Dimensions , Projections , and Orientation settings work together to define Fibonacci projections within the triangular framework. Each setting plays a specific role in the geometric analysis of price movements.
♾️ Dimension determines which of the three modes (1-D, 2-D, or 3-D) is used for Fibonacci projections. In 1-D mode, the projections are based on a single side of the triangle, such as AB, AC, or BC. In 2-D mode, two sides are combined, producing levels based on their geometric relationship. The 3-D mode integrates all three sides of the triangle, calculating projections using weighted averages that emphasize the BC side for its relevance to recent price movement while maintaining historical context from the AB and AC sides.
A one-dimensional Fibonacci projection using the ⌳AB slope with a neutral projection. Important levels of interaction are highlighted: repeated resistance at Level 1.0 and repeated support at Levels 0.5 and 0.618. The projection aligns horizontally, reflecting the relationship between points A, B, and C while identifying recurring zones of market structure.
🧮 Slope Source determines which side of the triangle (AB, AC, or BC) serves as the foundation for Fibonacci projections. This selection directly impacts the calculations by specifying the slope that anchors the geometric relationships within the chosen Dimension mode (1-D, 2-D, or 3-D).
In 1-D mode, the selected Source defines the single side used for the projection. In 2-D and 3-D modes, the Source works in conjunction with other settings to refine projections by integrating the selected slope into the multi-dimensional framework.
One-dimensional Fibonacci projection using the ⌳AC Slope Source and Ascending projection. The projection continues on the AC slope line.
🎯 Projection controls the direction and alignment of Fibonacci levels. Neutral projections produce horizontal levels, similar to traditional Fibonacci tools. Ascending and Descending projections adjust the levels along the calculated slope to reflect market trends. These options allow the indicator’s outputs to align with different market behaviors.
An ascending projection along the ⌳BC slope aligns with resistance levels at 1.0, 0.618, and 0.236. The geometric relationship between points A, B, and C illustrates how the projection adapts to market structure, identifying resistance zones that may not be captured by traditional Fibonacci tools.
🧭 Orientation modifies the alignment of the setup area defined by points A, B, and C, which influences Fibonacci projections in 2-D and 3-D modes. In Default mode, the triangle aligns naturally based on the relative positions of points B and C. In Inverted mode, the geometric orientation of the setup area is reversed, altering the slope calculations while preserving the projection direction specified in the Projection setting. In 1-D mode, Orientation has no effect since only one side is used for the projection.
Adjusting the Orientation setting provides alternative views of how Fibonacci levels align with the market's structure. By recalibrating the triangle’s setup, the inverted orientation can highlight different relationships between the sides, providing additional perspectives on support and resistance zones.
2-D inverted. The ⌳AC slope defines the projection, and the inverted orientation adjusts the alignment of the setup area, altering the angles used in level calculations. Key levels are highlighted: resistance at 0.786, strong support at 0.5 and 0.236, and a resistance-turned-support interaction at 0.618.
🛠️ CONFIGURATION AND SETTINGS 🛠️
The Fibonacci 3-D indicator includes configurable settings to adjust its functionality and visual representation. These options include customization of the dimensions (1-D, 2-D, or 3-D), slope calculations, orientations, projections, Fibonacci levels, and visual elements.
When adding the indicator to a new chart, select three reference points (A, B, and C). These are usually set to recent swing points. All three points can be easily changed at any time by clicking on the reference point and dragging it to a new location.
By default, all settings are set to Auto . The indicator uses an internal algorithm to estimate the projections based on the orientation and relative positions of the reference points. However, all values can be overridden to reflect the user's interpretation of the current market geometry.
⚙️ Core Settings
Dimensions : Defines how many sides of the triangle formed by points A, B, and C are incorporated into the calculations for Fibonacci projections. This setting determines the level of complexity and detail in the analysis. 1-D : Projects levels along the angle of a single user-selected side of the triangle.
2-D : Projects levels based on a composite slope derived from the angles of two sides of the triangle.
3-D : Projects levels based on a composite slope derived from all three sides of the triangle (A-B, A-C, and B-C), providing a multi-dimensional projection that adapts to both historical and recent market movements.
Slope Source : Determines which side of the triangle is used as the basis for slope calculations. A–B: The slope between points A and B. In 1-D mode, this determines the projection. In 2-D and 3-D modes, it contributes to the composite slope calculation.
A–C: The slope between points A and C. In 1-D mode, this determines the projection. In 2-D and 3-D modes, it contributes to the composite slope calculation.
B--C: The slope between points B and C. In 1-D mode, this determines the projection. In 2-D and 3-D modes, it contributes to the composite slope calculation.
Orientation : Defines the triangle's orientation formed by points A, B, and C, influencing slope calculations. Auto : Automatically determines orientation based on the relative positions of points B and C. If point C is to the right of point B, the orientation is "normal." If point C is to the left, the orientation is inverted.
Inverted : Reverses the orientation set in "Auto" mode. This flips the triangle, reversing slope calculations ⌳AB becomes ⌳BA).
Projection : Determines the direction of Fibonacci projections: Auto : Automatically determines projection direction based on the triangle formed by A, B, and C.
Ascending : Projects the levels upward.
Neutral : Projects the levels horizontally, similar to traditional Fibonacci retracements.
Descending : Projects the levels downward.
⚙️ Fibonacci Level Settings Show or hide specific levels.
Level Value : Adjust Fibonacci ratios for each level. The 0.0 and 1.0 levels are fixed.
Color : Set level colors.
⚙️ Visibility Settings Show Setup : Toggle the display of the setup area, which includes the projected lines used in calculations.
Show Triangle : Toggle the display of the triangle formed by points A, B, and C.
Triangle Color : Set triangle line colors.
Show Point Labels : Toggle the display of labels for points A, B, and C.
Show Left/Right Labels : Toggle price labels on the left and right sides of the chart.
Fill % : Adjust the fill intensity between Fibonacci levels (0% for no fill, 100% for full fill).
Info : Set the location or hide the Slope Source and Dimension. If Orientation is Inverted , the Slope Source will display with an asterisk (*).
⚙️ Time-Price Points : Set the time and price for points A, B, and C, which define the Fibonacci projections.
A, B, and C Points : User-defined time and price coordinates that form the foundation of the indicator's calculations.
Interactive Adjustments : Changes made to points on the chart automatically synchronize with the settings panel and update projections in real time.
Notes
Unlike traditional Fibonacci tools that include extensions beyond 1.0 (e.g., 1.618 or 2.618), the Fibonacci 3-D indicator restricts Fibonacci levels to the range between 0.0 and 1.0. This is because the projections are tied directly to the proportional relationships along the sides of the triangle formed by points A, B, and C, rather than extending beyond its defined structure.
The indicator's calculations dynamically sort the user-defined A, B, and C points by time, ensuring point A is always the earliest, point C the latest, and point B the middle. This automatic sorting allows users to freely adjust the points directly on the chart without concern for their sequence, maintaining consistency in the triangular structure.
🖼️ ADDITIONAL CHART EXAMPLES 🖼️
Three-dimensional ⌳AC slope is used with an ascending projection, even as the broader market trend moves downward. Despite the apparent contradiction, the projected Fibonacci levels align closely with price action, identifying zones of support and resistance. These levels highlight smaller countertrend movements, such as pullbacks to 0.382 and 0.236, followed by continuations at resistance levels like 0.618 and 0.786.
In 2-D mode, an ascending projection based on the BC slope highlights the market's geometric structure. A setup triangle, defined by a swing high (A), a swing low (B), and another swing high (C), reveals Fibonacci projections aligning with support at 0.236, 0.382, and 0.5, and resistance at 0.618, 0.786, and 1.0, as shown by the green and red arrows. This demonstrates the ability to uncover dynamic support and resistance levels not calculated in traditional Fibonacci tools.
In 2-D mode with an ascending projection from the ⌳AB slope, price movement is contained within the 0.5 and 0.786 levels. The 0.5 level serves as support, while the 0.786 level acts as resistance, with price action consistently interacting with these boundaries.
An AC (2-D) ascending projection is derived from two swing highs (A and B) and a swing low (C), reflecting a non-linear market structure that deviates from traditional zigzag patterns. The ascending projection aligns closely with the market's upward trajectory, forming a channel between the 0.0 and 0.5 Fibonacci levels. Note how price action interacts with the projected levels, showing support at 0.236 and 0.382, with the 0.5 level acting as a mid-channel equilibrium.
Two-dimensional ascending Fibonacci projection using the ⌳AC slope. Arrows highlight resistance at 0.786 and support at 0.0 and 0.236. The projection follows the ⌳AC slope, reflecting the geometric relationship between points A, B, and C to identify these levels.
Three-dimensional Fibonacci projection using the ⌳AC slope, aligned with the actual market's directional trend. By removing additional Fibonacci levels, the image emphasizes key areas: resistance at Level 0.0 and support at Levels 1.0 and 0.5. The projection dynamically follows the ⌳AC slope, adapting to the market's structure as defined by points A, B, and C.
A three-dimensional configuration uses the ⌳AB slope as the baseline for projections while incorporating the geometric influence of point C. Only the 0.0 and 0.618 levels are enabled, emphasizing the relationship between support at 0.0 and resistance at 0.618. Unlike traditional Fibonacci tools, which operate in a single plane, this setup reveals levels that rely on the triangular relationship between points A, B, and C. The third dimension allows for projections that align more closely with the market’s structure and reflect its multi-dimensional geometry.
The Fibonacci 3-D indicator can adapt to non-traditional point selection. Point A serves as a swing low, while points B and C are swing highs, forming an unconventional configuration. ⌳The BC slope is used in 2-D mode with an inverted orientation, flipping the projection direction and revealing resistance at Level 0.786 and support at Levels 0.618 and 0.5.
⚠️ DISCLAIMER ⚠️
The Fibonacci 3-D indicator is a visual analysis tool designed to illustrate Fibonacci relationships. While the indicator employs precise mathematical and geometric formulas, no guarantee is made that its calculations will align with other Fibonacci tools or proprietary methods. Like all technical and visual indicators, the Fibonacci projections generated by this tool may appear to visually align with key price zones in hindsight. However, these projections are not intended as standalone signals for trading decisions. This indicator is intended for educational and analytical purposes, complementing other tools and methods of market analysis.
🧠 BEYOND THE CODE 🧠
The Fibonacci 3-D indicator, like other xxattaxx indicators , is designed to encourage both education and community engagement. Your feedback and insights are invaluable to refining and enhancing the Fibonacci 3-D indicator. We look forward to the creative applications, adaptations, and observations this tool inspires within the trading community.

Chandelier Exit Pro w/ExtensionsChandelier Exit Pro w/Extensions
The Chandelier Exit Pro w/Extensions indicator is designed to assist traders in managing risk and identifying trend reversals. The strategy is based on the Chandelier Exit concept, originally created by Charles Le Beau. It uses the Average True Range (ATR) to calculate dynamic stop levels that adjust based on market volatility. This script not only implements the standard Chandelier Exit, but also introduces extension levels and alerts to enhance decision-making.
Key Features:
➡️Dynamic Stop Levels: The indicator calculates stop levels for both long and short positions based on an ATR multiple. This allows traders to determine exit points by monitoring when the price crosses above or below these levels. These levels adapt in real-time based on price volatility, making them a versatile tool for trend-following strategies.
➡️Extension Levels: In addition to the primary stop levels, the script includes extension levels for more advanced stop-loss management. Traders can view active and extension levels separately, providing more flexibility in their exit strategies.
➡️Labels and Visual Cues: The indicator provides dynamic labels that automatically update and follow the plotted stop levels. Labels include the ATR multiplier value (e.g., "2.5" or "2.5ext"), clearly showing the significance of each level. When price crosses below or above a level, the corresponding label is highlighted, aiding traders in quickly identifying the most relevant stop level.
➡️Bar Confirmation and Alerts: The script includes an "await bar confirmation" option to ensure that the stop levels and alerts only trigger after the bar has closed. Alerts are customizable and will notify traders when price crosses critical levels, helping to make timely decisions without the need to constantly monitor charts.
➡️Multiple ATR Levels for Enhanced Precision: The indicator supports up to four different ATR levels, each with customizable multipliers. This allows traders to set different thresholds for exits based on varying degrees of volatility. For example, Level 1 (2.5x ATR) might represent a tighter stop, while Level 4 (10x ATR) could serve as a wider stop for long-term positions.
➡️Calc_bars_count: Improves efficiency of the indicator by reducing the on-chart calculations in to the past. This input can be found at the bottom of the INPUTS tab.
How it Helps Traders:
💥Trend Identification: By using the Chandelier Exit levels, traders can identify when the trend is likely to reverse. When the price crosses below the stop level in a long trade or above the stop level in a short trade, it signals a potential exit point.
💥Volatility-based Adjustments: Unlike static stop-loss methods, the ATR-based stop levels dynamically adjust based on the market’s volatility. This means tighter stops during low volatility periods and wider stops during high volatility periods, reducing the chance of being stopped out prematurely.
💥Risk Management: The dynamic stop levels and extension levels provide a structured way to manage risk. Traders can set tighter stops for short-term trades and wider stops for longer-term trades. The script's visual labels make it easy to track these levels in real-time.
💥Automation with Alerts: The built-in alert system ensures that traders are notified when key levels are crossed. This helps to avoid emotional decision-making and allows for better execution of trading strategies.
Confluence and Price Fluidity:
One of the powerful ways to enhance the effectiveness of the Chandelier Exit indicator is by using it in conjunction with other technical analysis tools to create confluence. Confluence occurs when multiple indicators or price action signals align, providing stronger confirmation for a trade decision. For example:
🎯Support and Resistance Levels: Traders can use the Chandelier Exit levels in combination with key support and resistance zones. If the price is nearing a support level and the Chandelier Exit signals a bullish reversal, this alignment strengthens the case for entering a long position.
🎯Moving Averages: When the Chandelier Exit signals a trend reversal and this is confirmed by a crossover in moving averages (such as a 50-day and 200-day moving average), traders gain additional confidence in the trade direction.
🎯Momentum Indicators: Traders can also look for momentum indicators like RSI or MACD to confirm the strength of a trend or potential reversal. For instance, if the Chandelier Exit triggers a short signal and the RSI also shows overbought conditions, this could provide stronger confirmation to exit a long trade or enter a short position.
🎯Candlestick Patterns: Price fluidity can be monitored using candlestick formations. For example, a bearish engulfing pattern near a Chandelier Exit resistance level offers confluence, adding confidence to the signal to close or short the trade.
By combining the Chandelier Exit with other tools, traders ensure that they are not relying on a single indicator. This layered approach can reduce the likelihood of false signals and improve overall trading accuracy.
Practical Use Case:
Imagine a trader enters a long position, and the price moves favorably. Using the Chandelier Exit, the trader sets the initial stop level at 2.5x ATR below the highest close. As the price continues to rise, the stop level follows the price, locking in profits. If the market suddenly turns, the price crossing below the stop level signals an exit, helping the trader preserve gains. With extension levels, the trader can further refine exits, adjusting based on their risk tolerance and market conditions.
Good luck and I hope that you can find a place in your tool bag to use this dynamic indicator 🙏

ATH/TTL & 52WH/L with Candle Coloring by RVImportance:
Identifying Key Price Levels: The indicator helps identify critical price levels such as all-time highs (ATH), all-time lows (ATL), 52-week highs (52WH), and 52-week lows (52WL). These levels often act as significant support or resistance areas.
Candle Color Insights: By coloring candles based on their relationship to these key levels, traders can quickly assess market sentiment and potential reversal points.
Visual Representation: The plotted lines and colored candles provide a visual representation of price dynamics, aiding in trend analysis and decision-making.
How to Use:
Key Level Confirmation: Confirm market trends or reversals by observing how price interacts with ATH, ATL, 52WH, and 52WL levels. Breakouts or bounces from these levels can signal strong buying or selling pressure.
Candle Color Signals: Pay attention to candle colors near key levels. For example, green candles above 52WH may indicate bullish momentum, while red candles below 52WL may suggest bearish pressure.
Confirmation with Other Indicators: Use this indicator in conjunction with other technical indicators or chart patterns to validate trading signals. For instance, combine it with moving averages or RSI to confirm potential entry or exit points.
Risk Management: Set stop-loss orders or take-profit levels based on the proximity of price to key levels. Tighten stops or consider profit-taking near significant levels to manage risk effectively.
Lines Plotted:
ATH Line: Represents the all-time high (ATH) levels.
ATL Line: Represents the all-time low (ATL) levels.
52WH Line: Represents the 52-week high (52WH) levels.
52WL Line: Represents the 52-week low (52WL) levels.
52WH 25% Low Line: Represents 25% below the 52-week high.
52WL 30% High Line: Represents 30% above the 52-week low.
Candle Coloring:
Candles are colored based on their relationship to ATH, ATL, 52WH, and 52WL levels.
Green: Close is above 52WH.
Orange: Close is above 52WH but lower than or equal to open.
Red: Close is below 52WL.
Cyan: Close is below 52WL but higher than or equal to open.
Additional Information:
Levels for coloring candles are dynamically calculated based on percentage differences from 52WH and 52WL.
Historical data is fetched to calculate ATH, ATL, 52WH, and 52WL levels.
The script provides a visual representation of key price levels and candle behavior relative to these levels.
High/Low Fibs using Bullish Anchors I do Love me some fibs!!
i used a lot of 30 min Opening Range Fibs for interday trading, but have found that using more bars back can make for stronger levels just like when we use higher time frame to see support & resistant levels.
You can just find high and lows for making an easy auto draw fib retracment, I think you will find these to be fairly accurate or at least just entertaining .
Here are some basics on how to use FIb Retracments
Fibonacci retracement is a popular technical analysis tool used by traders to identify potential levels of support and resistance in financial markets, including stocks. It is based on the Fibonacci sequence, a series of numbers where each number is the sum of the two preceding ones (e.g., 0, 1, 1, 2, 3, 5, 8, 13, 21, ...). The key Fibonacci retracement levels are 23.6%, 38.2%, 50%, 61.8%, and 78.6%. These levels are used to identify potential reversal points or areas of price consolidation. Here's how to use Fibonacci retracement in stock trading:
1. Identify a Significant Price Move:
Start by identifying a significant price move in the stock you are analyzing. This move can be either an uptrend or a downtrend. For uptrends, you'll be measuring from the low point to the high point, and for downtrends, you'll measure from the high point to the low point.
2. Draw Fibonacci Levels: *With this indicator We do this for you
Once you have identified the price move, use a Fibonacci retracement tool available on most trading platforms to draw the retracement levels. Typically, you will draw lines from the low point to the high point for uptrends and vice versa for downtrends.
3. Analyze Key Levels:
Pay attention to the key Fibonacci retracement levels, especially the most commonly used ones, which are 38.2%, 50%, and 61.8%. These levels are considered significant in determining potential support and resistance areas. The 23.6% and 78.6% levels are also used but are considered secondary.
4. Look for Confluence:
Consider other technical analysis tools and indicators to look for confluence at these Fibonacci retracement levels. For example, if a 50% retracement level coincides with a moving average or a trendline, it may strengthen the level's significance.
5. Monitor Price Action:
Watch how the stock's price reacts when it approaches these Fibonacci retracement levels. If the price stalls, reverses direction, or shows signs of consolidation around a particular level, it may act as support or resistance.
6. Set Entry and Exit Points:
Based on your analysis, you can set entry and exit points for your trades. Traders often look for buying opportunities near Fibonacci support levels and selling opportunities near resistance levels. Stop-loss orders can be placed just below support or above resistance levels to manage risk.
7. Practice Risk Management:
Always use proper risk management techniques in your trading. This includes setting stop-loss orders, determining your position size, and not risking more than you can afford to lose on a single trade.
8. Monitor Market Conditions:
Be aware that Fibonacci retracement levels are not foolproof and should be used in conjunction with other analysis methods and market conditions. Market sentiment, news events, and economic factors can also influence stock prices.
9. Continuously Learn and Adapt:
As with any trading strategy, it's essential to continuously learn and adapt. Test the effectiveness of Fibonacci retracement levels on different time frames and with different stocks to refine your trading strategy.
** Special Thanks to @KioseffTrading for doing most all of the HEAVY LIFTING on the code here... he is beyond a Top G!!
Smart FlexRange Breakout [The_lurker]The Smart FlexRange Breakout tool aims to identify trading opportunities based on price breakouts of dynamic levels (CALL, PUT) with a dotted centerline and the ability to select the applicable market. The tool relies on candlestick analysis over a specific time period (such as 3 hours). Candle data (searchHours) is collected to identify the most significant candle based on candlestick patterns and trading volume during the selected timeframe. Breakout levels and take-profit (TP) targets are then plotted, along with buy and sell signals, breakout notifications, and up/down trend lines based on Pivot Points.
The tool is run according to the selected timeframe.
Practical Use
1- Setup: Adjust the market, timeframe, number of hours, and time zone to suit the trader's needs.
2- Trading: Monitor signals (BUY/SELL) and TP levels to determine entry and exit points.
3- Trend Lines: Use them to understand the overall trend and confirm signals.
---
1. Objective: Identify trading opportunities based on price breakouts
- Trading opportunities: The indicator is designed to help traders identify moments when significant price movements are likely, allowing them to enter buy or sell trades based on market changes.
- Price breakouts: The indicator focuses on moments when prices break through key levels (resistance or support). A breakout occurs when the price exceeds a resistance level (up) or breaks a support level (down), indicating a potential continuation of the movement in the same direction.
- Dynamic: Resistance and support levels are not static; rather, they are calculated based on candlestick analysis over a specific period of time, making them adaptive to current market conditions.
---
2. Dynamic levels (resistance and support levels)
- Resistance levels: These represent prices that the price is difficult to break above, defined here as the high of the most significant candle during the specified period.
- Support levels: These represent prices below which the price is difficult to fall, defined as the low of the most significant candle.
- Dynamic: These levels are recalculated every new search period (searchHours), meaning they change based on the latest market data, unlike traditional static levels.
---
3. Adding a Dotted Center Line
- Center Line: A horizontal dotted line is drawn at the midpoint between the high and low of the most significant candle.
- Purpose:
- Provides a visual reference point for determining the current price position relative to support and resistance levels.
- Helps assess whether the price is moving toward a breakout (near resistance) or a breakout (near support).
- Dotted: The dotted pattern distinguishes it from the solid upper and lower lines, making it easier to distinguish visually.
---
4. Relying on candlestick analysis over a specific time period (searchHours)
- Candlestick Analysis: The indicator examines candlesticks to determine which ones have the most influence on price movement.
- Timeframe (searchHours):
- The user specifies the number of hours (1-6) for candle analysis, which determines the range of data the indicator relies on.
- Example: If searchHours = 3 and timeframe = 30 minutes, 6 candles are analyzed (3 hours ÷ 30 minutes).
- Flexibility: This period can be adjusted to suit different markets (such as volatile cryptocurrencies or more stable Forex).
---
5. Determining the Most Important Candle Based on Candle Patterns and Volume
- The most important candle: is the candle believed to have the greatest impact on price movement based on specific criteria.
- Candle Patterns:
- Candles are analyzed using a candlestick pattern library (such as Engulfing, Hammer, Doji).
- Reversal patterns (such as Morning Star, Shooting Star) are given a high importance score (100 points) because they indicate potential trend changes.
- Trading Volume:
- The trading volume of each candle is measured and compared to the maximum and minimum during the period.
- Volume is calculated as a percentage (0-100) and added to the pattern score to determine the most significant candle.
- Result: The candle with the highest score (patterns + volume) is used to determine support and resistance levels.
---
6. Timeframe
- Time interval: The user selects a time frame for the candles (15, 30, or 60 minutes).
- Importance:
- Determines the number of candles analyzed during the searchHours period.
- Affects the accuracy and speed of the signals (shorter timeframe = faster but less reliable signals; longer timeframe = slower but more reliable signals).
- Example: If the timeframe is 60 minutes and searchHours is 3, only 3 candles are analyzed.
---
7. Drawing Breakout Levels and Take Profit Targets (TP)
- Breakout Levels:
- Upper line (resistance): Drawn at the highest price of the most significant candle and is labeled "CALL".
- Lower line (support): Drawn at the lowest price of the most important candle and is called "PUT."
- These lines represent levels where a breakout is expected to lead to a strong price movement.
- Take Profit Targets (TP):
- Up to 8 bullish (above the upper line) and bearish (below the lower line) TP levels are calculated.
- They are calculated based on a percentage (tpPercentage) added or subtracted from the base lines.
- Example: If tpPercentage = 0.6% and the high price = 100, then bullish TP1 = 100.6, TP2 = 101.2, etc.
- Labels: Labels are drawn for each TP level indicating the value and level (TP1, TP2, etc.).
---
8. Buy and Sell Signals
- Buy (BUY) signal:
- Generated when the price breaks the upper line (ta.crossover).
- The "BUY" label is drawn with the redrawing of the TP levels.
- Sell signal (SELL):
- Generated when the price breaks the lower line (ta.crossunder).
- The "SELL" label is drawn with the redrawing of the TP levels.
- Purpose: To provide clear signals to the trader for making trade entry decisions.
=========================================================================
Thank you, n00btraders.
For using the import library: n00btraders/Timezone/1
For using the import library: The_lurker/AllCandlestickPatternsLibrary/1
========================================================================
Disclaimer:
The information and publications are not intended to be, nor do they constitute, financial, investment, trading, or other types of advice or recommendations provided or endorsed by TradingView.
تهدف أداة Smart FlexRange Breakout إلى تحديد فرص التداول بناءً على اختراقات الأسعار للمستويات الديناميكية (CALL، PUT) مع خط مركزي منقط، مع إمكانية اختيار السوق المناسب. تعتمد الأداة على تحليل الشموع اليابانية على مدى فترة زمنية محددة (مثل 3 ساعات). تُجمع بيانات الشموع (searchHours) لتحديد أهم شمعة بناءً على أنماط الشموع وحجم التداول خلال الإطار الزمني المحدد. ثم تُرسم مستويات الاختراق وأهداف جني الأرباح (TP)، بالإضافة إلى إشارات البيع والشراء، وإشعارات الاختراق، وخطوط الاتجاه الصعودي/الهبوطي بناءً على نقاط المحور.
يتم تشغيل الاداه حسب الفاصل المختار timeframe
الاستخدام العملي
1- الإعداد: اضبط السوق، والإطار الزمني، وعدد الساعات، والمنطقة الزمنية لتناسب احتياجات المتداول.
2- التداول: راقب إشارات (الشراء/البيع) ومستويات جني الأرباح لتحديد نقاط الدخول والخروج.
3- خطوط الاتجاه: استخدمها لفهم الاتجاه العام وتأكيد الإشارات.
1. الهدف: تحديد فرص التداول بناءً على اختراقات الأسعار
- فرص التداول: صُمم هذا المؤشر لمساعدة المتداولين على تحديد اللحظات التي يُحتمل فيها حدوث تحركات سعرية كبيرة، مما يسمح لهم بالدخول في صفقات شراء أو بيع بناءً على تغيرات السوق.
- اختراقات الأسعار: يُركز المؤشر على اللحظات التي تخترق فيها الأسعار مستويات رئيسية (مقاومة أو دعم). يحدث الاختراق عندما يتجاوز السعر مستوى مقاومة (صعودًا) أو يخترق مستوى دعم (هبوطًا)، مما يُشير إلى احتمال استمرار الحركة في نفس الاتجاه.
- ديناميكي: مستويات المقاومة والدعم ليست ثابتة؛ بل تُحسب بناءً على تحليل الشموع اليابانية على مدى فترة زمنية محددة، مما يجعلها مُكيفة مع ظروف السوق الحالية.
2. المستويات الديناميكية (مستويات المقاومة والدعم)
- مستويات المقاومة: تُمثل هذه الأسعار التي يصعب على السعر تجاوزها، وتُعرف هنا بأنها ارتفاع الشمعة الأكثر أهمية خلال الفترة المحددة.
- مستويات الدعم: تُمثل هذه الأسعار التي يصعب على السعر الانخفاض دونها، وتُعرف بأنها أدنى مستوى للشمعة الأكثر أهمية.
- ديناميكي: تُعاد حساب هذه المستويات مع كل فترة بحث جديدة (ساعات البحث)، مما يعني أنها تتغير بناءً على أحدث بيانات السوق، على عكس المستويات الثابتة التقليدية.
3. إضافة خط مركزي منقط
- خط المركز: يُرسم خط أفقي منقط عند نقطة المنتصف بين أعلى وأدنى شمعة ذات أهمية.
- الغرض:
- يوفر نقطة مرجعية بصرية لتحديد وضع السعر الحالي بالنسبة لمستويات الدعم والمقاومة.
- يساعد في تقييم ما إذا كان السعر يتحرك نحو اختراق (بالقرب من المقاومة) أو اختراق (بالقرب من الدعم).
- منقط: يُميزه النمط المنقط عن الخطوط العلوية والسفلية المتصلة، مما يُسهّل تمييزه بصريًا.
4. الاعتماد على تحليل الشموع اليابانية على مدى فترة زمنية محددة (ساعات البحث)
- تحليل الشموع اليابانية: يفحص المؤشر الشموع اليابانية لتحديد أيها الأكثر تأثيرًا على حركة السعر.
- الإطار الزمني (ساعات البحث):
- يُحدد المستخدم عدد الساعات (من 1 إلى 6) لتحليل الشموع، والذي يُحدد نطاق البيانات التي يعتمد عليها المؤشر.
- مثال: إذا كانت ساعات البحث = 3 والإطار الزمني = 30 دقيقة، فسيتم تحليل 6 شموع (3 ساعات ÷ 30 دقيقة).
- المرونة: يُمكن تعديل هذه الفترة لتناسب الأسواق المختلفة (مثل العملات المشفرة المتقلبة أو سوق الفوركس الأكثر استقرارًا).
5. تحديد الشمعة الأكثر أهمية بناءً على أنماط الشموع وحجم التداول
- الشمعة الأكثر أهمية: هي الشمعة التي يُعتقد أن لها التأثير الأكبر على حركة السعر بناءً على معايير محددة.
- أنماط الشموع:
- يتم تحليل الشموع باستخدام مكتبة أنماط الشموع (مثل شمعة الابتلاع، وشمعة المطرقة، وشمعة الدوجي).
- تُمنح أنماط الانعكاس (مثل نجمة الصباح، ونجم الشهاب) درجة أهمية عالية (100 نقطة) لأنها تُشير إلى تغيرات محتملة في الاتجاه.
- حجم التداول:
- يُقاس حجم تداول كل شمعة ويُقارن بالحد الأقصى والأدنى خلال الفترة.
- يُحسب الحجم كنسبة مئوية (0-100) ويُضاف إلى درجة النمط لتحديد الشمعة الأكثر أهمية.
- النتيجة: تُستخدم الشمعة ذات أعلى درجة (الأنماط + الحجم) لتحديد مستويات الدعم والمقاومة.
٦. الإطار الزمني
- الفاصل الزمني: يختار المستخدم إطارًا زمنيًا للشموع (١٥، ٣٠، أو ٦٠ دقيقة).
- الأهمية:
- يحدد عدد الشموع المُحللة خلال فترة ساعات البحث.
- يؤثر على دقة وسرعة الإشارات (الإطار الزمني الأقصر = إشارات أسرع ولكن أقل موثوقية؛ الإطار الزمني الأطول = إشارات أبطأ ولكن أكثر موثوقية).
- مثال: إذا كان الإطار الزمني ٦٠ دقيقة وساعات البحث ٣، فسيتم تحليل ٣ شموع فقط.
---
٧. رسم مستويات الاختراق وأهداف جني الأرباح (TP)
- مستويات الاختراق:
- الخط العلوي (المقاومة): يُرسم عند أعلى سعر للشمعة الأكثر أهمية ويُسمى "CALL".
- الخط السفلي (الدعم): يُرسم عند أدنى سعر للشمعة الأكثر أهمية ويُسمى "PUT".
- تمثل هذه الخطوط المستويات التي يُتوقع أن يؤدي فيها الاختراق إلى حركة سعرية قوية.
- أهداف جني الأرباح (TP):
- يتم حساب ما يصل إلى 8 مستويات جني أرباح صعودية (فوق الخط العلوي) وهبوطية (تحت الخط السفلي).
- يتم حسابها بناءً على نسبة مئوية (tpPercentage) تُضاف أو تُطرح من خطوط الأساس.
- مثال: إذا كانت نسبة جني الأرباح = 0.6% وكان أعلى سعر = 100، فإن هدف الربح الصعودي الأول = 100.6، وهدف الربح الثاني = 101.2، وهكذا.
- العلامات: تُرسم علامات لكل مستوى جني أرباح تشير إلى القيمة والمستوى (TP1، TP2، وهكذا).
---
8. إشارات الشراء والبيع
- إشارة الشراء (BUY):
- تُولّد عند اختراق السعر للخط العلوي (ta.crossover).
- تُرسم علامة "الشراء" مع إعادة رسم مستويات جني الأرباح.
- إشارة البيع (SELL):
- تُولّد عند اختراق السعر للخط السفلي (ta.crossunder). - يُرسم مؤشر "بيع" مع إعادة رسم مستويات جني الأرباح.
- الغرض: توفير إشارات واضحة للمتداول لاتخاذ قرارات دخول الصفقة.
==========================================================================
شكرًا لكم، أيها المتداولون الجدد.
لاستخدام مكتبة الاستيراد: n00btraders/Timezone/1
لاستخدام مكتبة الاستيراد: The_lurker/AllCandlestickPatternsLibrary/1
==============================================================================
إخلاء مسؤولية:
لا يُقصد بهذه المعلومات والمنشورات أن تكون، ولا تُشكل، نصائح أو توصيات مالية أو استثمارية أو تجارية أو أي نوع آخر من النصائح أو التوصيات المُقدمة من TradingView أو المُعتمدة منها.

Formation Defined Moving Support and ResistanceThe script was originally coded in 2018 with Pine Script version 3, and it was in protected code status. It has been updated and optimised for Pine Script v5 and made completely open source.
The Formation Defined Moving Support and Resistance indicator is a sophisticated tool for identifying dynamic support and resistance levels based on specific price formations and level interactions. This indicator goes beyond traditional static support and resistance by updating levels based on predefined formation patterns and market behaviour, providing traders with a more responsive view of potential support and resistance zones.
Features:
The indicator detects essential price levels:
Lower Low (LL)
Higher Low (HL)
Higher High (HH)
Lower High (LH)
Equal Lower Low (ELL)
Equal Higher Low (EHL)
Equal Higher High (EHH)
Equal Lower High (ELH)
By identifying these key points, the script builds a foundation for tracking and responding to changes in price structure.
Pre-defined Formations and Comparisons:
The indicator calculates and recognises nine different pre-defined formations, such as bullish and bearish formations, based on the sequence of price levels.
These formations are compared against previous levels and formations, allowing for a sophisticated understanding of recent market movements and momentum shifts.
This formation-based approach provides insights into whether the price is likely to maintain, break, or reverse key levels.
Dynamic Support and Resistance Levels:
The indicator offers an option to toggle Moving Support and Resistance Levels.
When enabled, the support and resistance levels dynamically adjust:
Upon a change in the detected formation.
When the bar’s closing price breaks the last defined support or resistance level.
This feature ensures that the support and resistance levels adapt quickly to market changes, giving a more accurate and responsive perspective.
Customisable Price Source:
Users can choose the price source for level detection, selecting between close or high/low prices.
This flexibility allows the indicator to adapt to different trading styles, whether the focus is on closing prices for more conservative levels or on highs and lows for more sensitive level tracking.
This indicator can benefit traders relying on dynamic support and resistance rather than fixed, historical levels. It adapts to recent price actions and market formations, making it useful for identifying entry and exit points, trend continuation or reversal, and setting trailing stops based on updated support and resistance levels.

Configurable Level Trading StrategyThe Dynamic Level Reversal Strategy is a trading approach designed to capitalize on price movements between key support and resistance levels. This strategy leverages configurable levels the trader determines, allowing for flexibility and adaptation to different market conditions.
Key Features:
Configurable Levels:
The strategy uses three key levels: Level 1 (Support), Level 2 (Middle), and Level 3 (Resistance). These levels can be adjusted directly within the script settings, making the strategy adaptable to various trading scenarios.
Buy and Sell Signals:
A buy signal is triggered when the price touches Level 1 and shows signs of reversal. The trader enters a position and sets an initial stop-loss just below Level 1.
As the price moves upward, the stop-loss is dynamically adjusted to just below Level 2 and Level 3, locking in profits while managing risk.
A sell signal is generated if the price reverses and crosses below the current stop-loss level, ensuring the trader exits the position with minimized losses.
Iterative Process:
The strategy allows for iterative trades, where the trader re-enters positions at Level 1 or Level 2 if the price revisits these levels, continually adjusting stop-losses and take-profit targets as the price oscillates between the defined levels.
Ideal Use Cases:
Range-Bound Markets: The strategy is particularly effective in markets where the price tends to oscillate between well-defined support and resistance levels.
Volatile Markets: The dynamic adjustment of stop-loss levels helps protect against sudden price reversals, making it suitable for volatile market conditions.
How to Use:
Set the desired levels (Level 1, Level 2, Level 3) based on your market analysis.
The script will automatically generate buy and sell signals, and adjust stop-loss levels as the price moves through the levels.
Monitor the signals and execute trades according to the strategy's guidelines.