Turtle Soup Model [PhenLabs]📊 Turtle Soup Model
Version: PineScript™ v6
Description
The Turtle Soup Model is an innovative technical analysis tool that combines market structure analysis with inter-market comparison and gap detection. Unlike traditional structure indicators, it validates market movements against a comparison symbol (default: ES1!) to identify high-probability trading opportunities. The indicator features a unique “soup pattern” detection system, comprehensive gap analysis, and real-time structure breaks visualization.
Innovation Points:
First indicator to combine structure analysis with gap detection and inter-market validation
Advanced memory management system for efficient long-term analysis
Sophisticated pattern recognition with multi-market confirmation
Real-time structure break detection with comparative validation
🔧 Core Components
Structure Analysis: Advanced pivot detection with inter-market validation
Gap Detection: Sophisticated gap identification and classification system
Inversion Patterns: “Soup pattern” recognition for reversal opportunities
Visual System: Dynamic rendering of structure levels and gaps
Alert Framework: Multi-condition notification system
🚨 Key Features 🚨
The indicator provides comprehensive analysis through:
Structure Levels: Validated support and resistance zones
Gap Patterns: Identification of significant market gaps
Inversion Signals: Detection of potential reversal points
Real-time Comparison: Continuous inter-market analysis
Visual Alerts: Dynamic structure break notifications
📈 Visualization
Structure Lines: Color-coded for highs and lows
Gap Boxes: Visual representation of gap zones
Inversion Patterns: Clear marking of potential reversal points
Comparison Overlay: Inter-market divergence visualization
Alert Indicators: Visual signals for structure breaks
💡Example
📌 Usage Guidelines
The indicator offers multiple customization options:
Structure Settings:
Pivot Period: Adjustable for different market conditions
Comparison Symbol: Customizable reference market
Visual Style: Configurable colors and line widths
Gap Analysis:
Signal Mode: Choice between close and wick-based signals
Box Rendering: Automatic gap zone visualization
Middle Line: Reference point for gap measurements
✅ Best Practices:
🚨Use comparison symbol from related market🚨
Monitor both structure breaks and gap inversions
Combine signals for higher probability trades
Pay attention to inter-market divergences
⚠️ Limitations
Requires comparison symbol data
Performance depends on market correlation
Best suited for liquid markets
What Makes This Unique
Inter-market Validation: Uses comparison symbol for signal confirmation
Gap Integration: Combines structure and gap analysis
Soup Pattern Detection: Identifies specific reversal patterns
Dynamic Structure Management: Automatically updates and removes invalid levels
Memory-Efficient Design: Optimized for long-term chart analysis
🔧 How It Works
The indicator processes market data through three main components:
1. Structure Analysis:
Detects pivot points with comparison validation
Tracks structure levels with array management
Identifies and processes structure breaks
2. Gap Analysis:
Identifies significant market gaps
Processes gap inversions
Manages gap zones visualization
3. Pattern Recognition:
Detects “soup” patterns
Validates with comparison market
Generates structure break signals
💡 Note: The indicator performs best when used with correlated comparison symbols and appropriate timeframe selection. Its unique inter-market validation system provides additional confirmation for traditional structure-based trading strategies.
Wyszukaj w skryptach "indicators"

Dynamic RSI Bollinger Bands with Waldo Cloud
TradingView Indicator Description: Dynamic RSI Bollinger Bands with Waldo Cloud
Title: Dynamic RSI Bollinger Bands with Waldo Cloud
Short Title: Dynamic RSI BB Waldo
Overview:
Introducing an experimental indicator, the Dynamic RSI Bollinger Bands with Waldo Cloud, designed for adventurous traders looking to explore new dimensions in technical analysis. This indicator overlays on your chart, providing a unique perspective by integrating the Relative Strength Index (RSI) with Bollinger Bands, creating a dynamic trading tool that adapts to market conditions through the lens of momentum and volatility.
What is it?
This innovative indicator combines the traditional Bollinger Bands with the RSI in a way that hasn't been commonly explored. Here's a breakdown:
RSI Integration: The RSI is calculated with customizable length settings, and its values are used not just for momentum analysis but as the basis for the Bollinger Bands. This means the position and width of the bands are directly influenced by the RSI, offering a visual representation of momentum within the context of price volatility.
Dynamic Bollinger Bands: Instead of using price directly, the Bollinger Bands are calculated using a scaled version of the RSI. This scaling is done to fit the RSI values into the price range, ensuring the bands are relevant to the actual price movement. The standard deviation for these bands is also scaled accordingly, providing a unique volatility measure that's momentum-driven.
Waldo Cloud: Named after a visual representation concept, the 'Waldo Cloud' refers to the colored area between the Bollinger Bands, which changes based on various conditions:
Purple when RSI is overbought.
Blue when RSI is oversold.
Green for bullish conditions, defined by the fast-moving average crossing above the slow one, RSI is bullish, and the price is above the slow MA.
Red for bearish conditions, when the fast MA crosses below the slow MA, the RSI is bearish, and the price is below the slow MA.
Gray for neutral market conditions.
Moving Averages: Two simple moving averages (Fast MA and Slow MA) are included, which can be toggled on or off, offering additional trend analysis through crossovers.
How to Use It:
Given its experimental nature, this indicator should be used with caution and in conjunction with other analysis methods:
Identifying Market Conditions: Use the color of the Waldo Cloud to gauge market sentiment. A green cloud might suggest a good time to consider long positions, while a red cloud could indicate potential shorting opportunities. Purple and blue clouds highlight extreme conditions that might precede reversals.
Volatility and Momentum: The dynamic nature of the Bollinger Bands based on RSI provides insight into how momentum is affecting price volatility. When the bands are wide, it might indicate high momentum and potential trend continuation or reversal, depending on the RSI's position relative to its overbought/oversold levels.
Trend Confirmation: The moving average crossovers can act as confirmation signals. For instance, a bullish crossover (fast MA over slow MA) within a green cloud might strengthen a buy signal, whereas a bearish crossover in a red cloud might reinforce a sell decision.
Customization: Adjust the RSI length, overbought/oversold levels, and moving average lengths to suit different trading styles or market conditions. Experiment with these settings to find what works best for your strategy.
Combining with Other Indicators: Since this is an experimental tool, it's advisable to use it alongside established indicators like traditional Bollinger Bands, MACD, or trend lines to validate signals.
Conclusion:
The Dynamic RSI Bollinger Bands with Waldo Cloud is an experimental venture into combining momentum with volatility visually and interactively. It's designed for traders who are open to exploring new methods of market analysis.
Remember, due to its experimental status, this indicator should be part of a broader trading strategy, and backtesting or paper trading is recommended before applying it in live trading scenarios. Keep an eye on how the market reacts to the signals provided by this indicator and always consider risk management practices.

Power Trend [MacAlgo]Description:
The Power Trend Indicator is a sophisticated technical analysis tool that overlays on your trading charts to identify prevailing market trends. It utilizes a combination of ATR-based trend calculations, moving averages, volume analysis, and momentum indicators to generate reliable buy and sell signals. Additionally, it offers customizable settings to adapt to various trading styles and timeframes.
Key Features:
Adaptive ATR Calculation: Automatically adjusts the ATR (Average True Range) period and multiplier based on the selected timeframe for more accurate trend detection.
Dynamic Trend Lines: Plots continuous trend lines with color-coded bars to visually represent bullish and bearish trends.
Buy/Sell Signals: Generates standard and power buy/sell signals to help you make informed trading decisions.
Volume Analysis: Incorporates average buy and sell volumes to identify strong market movements.
Multiple Timeframe Support: Automatically adjusts the indicator's timeframe or allows for manual selection to suit your trading preferences.
Highlighting: Highlights trending bars for easy visualization of market conditions.
Alerts: Customizable alert conditions to notify you of potential trading opportunities in real-time.
How it Works:
1. ATR-Based Trend Calculation:
ATR Period & Multiplier: Calculates ATR based on user-defined periods and multipliers, dynamically adjusting according to the chart's timeframe.
Trend Determination: Identifies trends as bullish (1) or bearish (-1) based on price movements relative to ATR-based upper (up) and lower (dn) trend lines.
2. Moving Averages:
EMA & SMA: Calculates exponential and simple moving averages to smooth price data and identify underlying trends.
AlphaTrend Line: Combines a 50-period EMA and a 30-period SMA on a 4-hour timeframe to create the AlphaTrend line, providing a robust trend reference.
3. Volume Analysis:
Buy/Sell Volume: Differentiates between buy and sell volumes to gauge market strength.
Average Volume: Compares current volume against average buy/sell volumes to detect significant market movements.
4. Momentum Indicators:
RSI, MACD, OBV: Incorporates Relative Strength Index (RSI), Moving Average Convergence Divergence (MACD), and On-Balance Volume (OBV) to assess momentum and confirm trend strength.
5. Signal Generation:
Standard Signals: Basic buy and sell signals based on trend crossovers.
Power Signals: Enhanced signals requiring multiple conditions (e.g., increased volume, momentum confirmation) for higher confidence trades.
Customization Options:
Tailor the Power Trend Indicator to your specific trading needs with the following settings:
ATR Period: Set the period for ATR calculation (default: 8).
ATR Multiplier: Adjust the ATR multiplier to fine-tune trend sensitivity (default: 3.0).
Source: Choose the price source (e.g., HL2, Close) for calculations.
Change ATR Calculation Method: Toggle between different ATR calculation methods.
Show Buy/Sell Signals: Enable or disable the display of buy and sell signals on the chart.
Highlighting: Turn on or off the bar highlighting feature.
Timeframe Adjustment: Choose between automatic timeframe adjustment or manually set
the indicator's timeframe.
Manual Indicator Timeframe: If manual adjustment is selected, specify the desired timeframe (default: 60 minutes).
Visual Components:
Trend Lines: Continuous lines representing the current trend, color-coded for easy identification (green for bullish, red for bearish, orange for neutral).
Bar Coloring: Bars are colored based on the current trend and its relationship to the AlphaTrend line.
Buy/Sell Triangles: Triangular markers appear on the chart to indicate buy and sell signals.
Power Signals: Larger triangles highlight strong buy and sell opportunities based on multiple confirming factors.
Highlighting: Transparent overlays highlight trending areas to enhance visual clarity.
Alerts:
Stay informed with customizable alerts that notify you of important market movements:
SuperTrend Buy/Sell: Alerts when standard buy or sell signals are generated.
Power Buy/Sell Alerts: Notifications for strong buy or sell signals based on comprehensive conditions.
Trend Direction Change: Alerts when the trend changes from bullish to bearish or vice versa.
How to Use:
Add to Chart: Apply the Power Trend Indicator to your preferred trading chart on TradingView.
Configure Settings: Adjust the input parameters to match your trading style and the timeframe you are analyzing.
Analyze Trends: Observe the trend lines, bar colors, and AlphaTrend line to understand the current market trend.
Follow Signals: Look for buy and sell signals or power signals to identify potential entry and exit points.
Set Alerts: Enable alerts to receive real-time notifications of significant trading opportunities.
Adjust as Needed: Fine-tune the settings based on market conditions and your trading experience.
Important Notes:
Backtesting: While the Power Trend Indicator is built using robust technical analysis principles, it's essential to backtest and validate its performance within your trading strategy.
Market Conditions: The indicator performs best in trending markets. In sideways or highly volatile markets, signal reliability may vary.
Risk Management: Always employ proper risk management techniques when trading based on indicator signals to protect your capital.
Disclaimer:
This indicator is intended for educational purposes only and does not provide financial advice or guarantee future performance. Trading involves risk, and past results are not indicative of future outcomes. Always conduct your own analysis and risk management.

MATA GOLD RATIOMata Gold Instrument: User Guide
The Instrument to Gold Oscillator is a technical analysis tool that normalizes the ratio of an instrument's price (e.g., BTC/USD) to the price of gold (XAU/USD) into a 0-100 scale. This provides a clear and intuitive way to evaluate the relative performance of an instrument compared to gold over a specified period.
---
How It Works
1. Calculation of the Ratio:
The ratio is calculated as:
\text{Ratio} = \frac{\text{Instrument Price}}{\text{Gold Price}}
2. Normalization:
The ratio is normalized using the highest and lowest values over a user-defined period (length), typically 14 periods:
\text{Normalized Ratio} = \frac{\text{Ratio} - \text{Min(Ratio)}}{\text{Max(Ratio)} - \text{Min(Ratio)}} \times 100
3. Overbought/Oversold Levels:
Above 80: The instrument is relatively expensive compared to gold (overbought).
Below 20: The instrument is relatively cheap compared to gold (oversold).
---
How to Use the Oscillator
1. Identify Overbought and Oversold Levels:
If the oscillator rises above 80, the instrument may be overvalued relative to gold. This could signal a potential reversal or correction.
If the oscillator falls below 20, the instrument may be undervalued relative to gold. This could signal a buying opportunity.
2. Track Trends:
Rising oscillator values indicate the instrument is gaining value relative to gold.
Falling oscillator values indicate the instrument is losing value relative to gold.
3. Crossing the Midline (50):
When the oscillator crosses above 50, the instrument's value is gaining strength relative to gold.
When it crosses below 50, the instrument is weakening relative to gold.
4. Combine with Other Indicators:
Use this oscillator alongside other technical indicators (e.g., RSI, MACD, STOCH) for more robust decision-making.
Confirm signals from the oscillator with price action or volume analysis.
---
Example Scenarios
1. Trading Cryptocurrencies Against Gold:
If BTC/USD's oscillator value is above 80, Bitcoin may be overvalued relative to gold. Consider reducing exposure or looking for short opportunities.
If BTC/USD's oscillator value is below 20, Bitcoin may be undervalued relative to gold. This could be a good time to accumulate.
2. Commodities vs. Gold:
Analyze the relative strength of commodities (e.g., oil, silver) against gold using the oscillator to identify periods of overperformance or underperformance.
---
Advantages of the Oscillator
Relative Performance Insight: Tracks the performance of an instrument relative to gold, providing a macro perspective.
Clear Visual Representation: The 0-100 scale makes it easy to identify overbought/oversold conditions and trend shifts.
Customizable Periods: The user-defined length allows flexibility in analyzing short- or long-term trends.
---
Limitations
Dependence on Gold: As the oscillator is based on gold prices, any external shocks to gold (e.g., geopolitical events) can influence its signals.
No Absolute Buy/Sell Signals: The oscillator should not be used in isolation but as part of a broader analysis strategy.
---
By using the Instrument to Gold Oscillator effectively, traders and investors can gain valuable insights into the relative valuation and performance of assets compared to gold, enabling more informed trading and investment decisions.

Volume Spike IndicatorThe Volume Spike Indicator is designed to identify significant volume spikes in the market. This tool helps traders recognize unusual trading activity, which may indicate potential reversals, breakouts, or increased volatility. The indicator uses a simple moving average (SMA) of volume over a specified period and highlights bars where the current volume exceeds a multiple of this average.
Features:
Volume SMA Calculation:
The indicator calculates the SMA of volume over a customizable period (default: 20 bars).
Spike Multiplier:
A threshold multiplier (default: 4) determines what qualifies as a "spike."
Spikes occur when the current volume is greater than the SMA multiplied by this threshold.
Visual Alerts:
If a spike is detected, a red cross ( Cross ) and X-shape ( X-Cross ) are plotted above the corresponding bar for easy identification.
How to Use:
Spot High-Activity Areas:
Use this indicator to find points of unusually high trading activity, which can signify key levels or moments of interest in the market.
Adjust Settings for Sensitivity:
Length : Change the SMA period to match your trading timeframe.
Spike Multiplier : Lower values detect smaller spikes; higher values focus on extreme events.
Combine with Other Indicators:
This tool works best when combined with price action analysis, support/resistance levels, or trend indicators to confirm trading signals.
Customization Options:
Length: Number of bars for SMA calculation (default: 20).
Spike Multiplier: Threshold for defining volume spikes (default: 4).
This indicator is suitable for traders looking to enhance their analysis by identifying abnormal market activity.

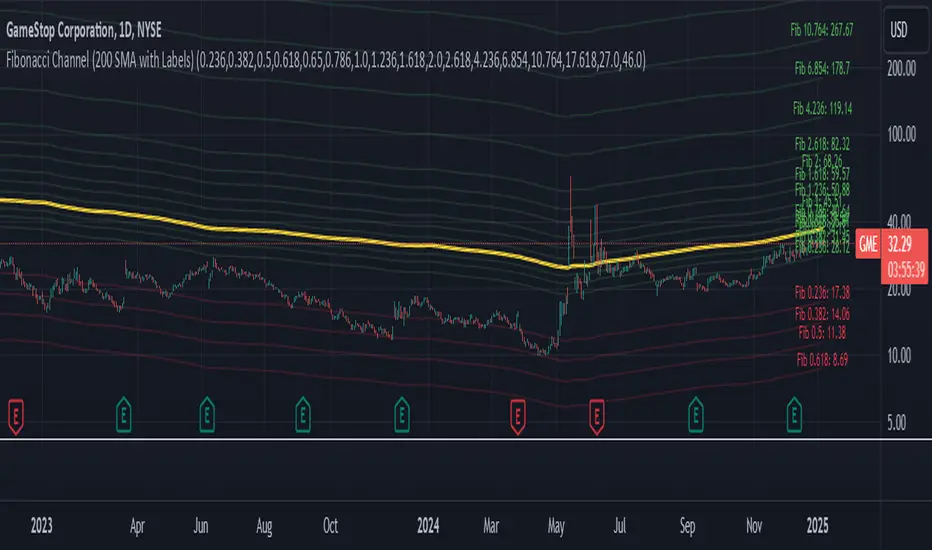
Fibonacci Channel Standard Deviation levels based off 200MAThis script dynamically combines Fibonacci levels with the 200-period simple moving average (SMA), offering a powerful tool for identifying high-probability support and resistance zones. By adjusting to the changing 200 SMA, the script remains relevant across different market phases.
Key Features:
Dynamic Fibonacci Levels:
The script automatically calculates Fibonacci retracements and extensions relative to the 200 SMA.
These levels adapt to market trends, offering more relevant zones compared to static Fibonacci tools.
Support and Resistance Zones:
In uptrends, price often respects retracement levels above the 200 SMA (e.g., 38.2%, 50%, 61.8%).
In downtrends, price may interact with retracements and extensions below the 200 SMA (e.g., 23.6%, 1.618).
Customizable Confluence Zones:
Key levels such as the golden pocket (61.8%–65%) are highlighted as high-probability zones for reversals or continuations.
Extensions (e.g., 1.618) can serve as profit targets or bearish continuation points.
Practical Applications:
Identifying Reversal Zones:
Look for confluence between Fibonacci levels and the 200 SMA to identify potential reversal points.
Example: A pullback to the 61.8%–65% golden pocket near the 200 SMA often signals a bullish reversal.
Trend Confirmation:
In uptrends, price respecting Fibonacci retracements above the 200 SMA (e.g., 38.2%, 50%) confirms strength.
Use Fibonacci extensions (e.g., 1.618) as profit targets during strong trends.
Dynamic Risk Management:
Place stop-losses just below key Fibonacci retracement levels near the 200 SMA to minimize risk.
Bearish Scenarios:
Below the 200 SMA, Fibonacci retracements and extensions act as resistance levels and bearish targets.
How to Use:
Volume Confirmation: Watch for volume spikes near Fibonacci levels to confirm support or resistance.
Price Action: Combine with candlestick patterns (e.g., engulfing candles, pin bars) for precise entries.
Trend Indicators: Use in conjunction with shorter moving averages or RSI to confirm market direction.
Example Setup:
Scenario: Price retraces to the 61.8% Fibonacci level while holding above the 200 SMA.
Confirmation: Volume spikes, and a bullish engulfing candle forms.
Action: Enter long with a stop-loss just below the 200 SMA and target extensions like 1.618.
Key Takeaways:
The 200 SMA serves as a reliable long-term trend anchor.
Fibonacci retracements and extensions provide dynamic zones for trade entries, exits, and risk management.
Combining this tool with volume, price action, or other indicators enhances its effectiveness.
Adaptive Momentum Reversion StrategyThe Adaptive Momentum Reversion Strategy: An Empirical Approach to Market Behavior
The Adaptive Momentum Reversion Strategy seeks to capitalize on market price dynamics by combining concepts from momentum and mean reversion theories. This hybrid approach leverages a Rate of Change (ROC) indicator along with Bollinger Bands to identify overbought and oversold conditions, triggering trades based on the crossing of specific thresholds. The strategy aims to detect momentum shifts and exploit price reversions to their mean.
Theoretical Framework
Momentum and Mean Reversion: Momentum trading assumes that assets with a recent history of strong performance will continue in that direction, while mean reversion suggests that assets tend to return to their historical average over time (Fama & French, 1988; Poterba & Summers, 1988). This strategy incorporates elements of both, looking for periods when momentum is either overextended (and likely to revert) or when the asset’s price is temporarily underpriced relative to its historical trend.
Rate of Change (ROC): The ROC is a straightforward momentum indicator that measures the percentage change in price over a specified period (Wilder, 1978). The strategy calculates the ROC over a 2-period window, making it responsive to short-term price changes. By using ROC, the strategy aims to detect price acceleration and deceleration.
Bollinger Bands: Bollinger Bands are used to identify volatility and potential price extremes, often signaling overbought or oversold conditions. The bands consist of a moving average and two standard deviation bounds that adjust dynamically with price volatility (Bollinger, 2002).
The strategy employs two sets of Bollinger Bands: one for short-term volatility (lower band) and another for longer-term trends (upper band), with different lengths and standard deviation multipliers.
Strategy Construction
Indicator Inputs:
ROC Period: The rate of change is computed over a 2-period window, which provides sensitivity to short-term price fluctuations.
Bollinger Bands:
Lower Band: Calculated with a 18-period length and a standard deviation of 1.7.
Upper Band: Calculated with a 21-period length and a standard deviation of 2.1.
Calculations:
ROC Calculation: The ROC is computed by comparing the current close price to the close price from rocPeriod days ago, expressing it as a percentage.
Bollinger Bands: The strategy calculates both upper and lower Bollinger Bands around the ROC, using a simple moving average as the central basis. The lower Bollinger Band is used as a reference for identifying potential long entry points when the ROC crosses above it, while the upper Bollinger Band serves as a reference for exits, when the ROC crosses below it.
Trading Conditions:
Long Entry: A long position is initiated when the ROC crosses above the lower Bollinger Band, signaling a potential shift from a period of low momentum to an increase in price movement.
Exit Condition: A position is closed when the ROC crosses under the upper Bollinger Band, or when the ROC drops below the lower band again, indicating a reversal or weakening of momentum.
Visual Indicators:
ROC Plot: The ROC is plotted as a line to visualize the momentum direction.
Bollinger Bands: The upper and lower bands, along with their basis (simple moving averages), are plotted to delineate the expected range for the ROC.
Background Color: To enhance decision-making, the strategy colors the background when extreme conditions are detected—green for oversold (ROC below the lower band) and red for overbought (ROC above the upper band), indicating potential reversal zones.
Strategy Performance Considerations
The use of Bollinger Bands in this strategy provides an adaptive framework that adjusts to changing market volatility. When volatility increases, the bands widen, allowing for larger price movements, while during quieter periods, the bands contract, reducing trade signals. This adaptiveness is critical in maintaining strategy effectiveness across different market conditions.
The strategy’s pyramiding setting is disabled (pyramiding=0), ensuring that only one position is taken at a time, which is a conservative risk management approach. Additionally, the strategy includes transaction costs and slippage parameters to account for real-world trading conditions.
Empirical Evidence and Relevance
The combination of momentum and mean reversion has been widely studied and shown to provide profitable opportunities under certain market conditions. Studies such as Jegadeesh and Titman (1993) confirm that momentum strategies tend to work well in trending markets, while mean reversion strategies have been effective during periods of high volatility or after sharp price movements (De Bondt & Thaler, 1985). By integrating both strategies into one system, the Adaptive Momentum Reversion Strategy may be able to capitalize on both trending and reverting market behavior.
Furthermore, research by Chan (1996) on momentum-based trading systems demonstrates that adaptive strategies, which adjust to changes in market volatility, often outperform static strategies, providing a compelling rationale for the use of Bollinger Bands in this context.
Conclusion
The Adaptive Momentum Reversion Strategy provides a robust framework for trading based on the dual concepts of momentum and mean reversion. By using ROC in combination with Bollinger Bands, the strategy is capable of identifying overbought and oversold conditions while adapting to changing market conditions. The use of adaptive indicators ensures that the strategy remains flexible and can perform across different market environments, potentially offering a competitive edge for traders who seek to balance risk and reward in their trading approaches.
References
Bollinger, J. (2002). Bollinger on Bollinger Bands. McGraw-Hill Professional.
Chan, L. K. C. (1996). Momentum, Mean Reversion, and the Cross-Section of Stock Returns. Journal of Finance, 51(5), 1681-1713.
De Bondt, W. F., & Thaler, R. H. (1985). Does the Stock Market Overreact? Journal of Finance, 40(3), 793-805.
Fama, E. F., & French, K. R. (1988). Permanent and Temporary Components of Stock Prices. Journal of Political Economy, 96(2), 246-273.
Jegadeesh, N., & Titman, S. (1993). Returns to Buying Winners and Selling Losers: Implications for Stock Market Efficiency. Journal of Finance, 48(1), 65-91.
Poterba, J. M., & Summers, L. H. (1988). Mean Reversion in Stock Prices: Evidence and Implications. Journal of Financial Economics, 22(1), 27-59.
Wilder, J. W. (1978). New Concepts in Technical Trading Systems. Trend Research.

HMA Buy Sell Signals - Profit ManagerNote : Settings should be adjusted according to the selected time frame. Try to find the best setting according to the profitability rate
Overall Functionality
This script combines several trading tools to create a comprehensive system for trend analysis, trade execution, and performance tracking. Users can identify market trends using specific moving averages and RSI indicators while managing profit and loss levels automatically.
Trend Detection and Trade Signals
Hull Moving Averages (HMA):
Two HMAs (a faster one and a slower one) are used to determine the market trend.
A buy signal is generated when the faster HMA crosses above the slower HMA.
Conversely, a sell signal is triggered when the faster HMA crosses below the slower one.
Visual Feedback:
Trend lines on the chart change color to reflect the trend direction (e.g., green for upward trends and red for downward trends).
Trade Levels and Management
Entry, Take-Profit, and Stop-Loss Levels:
When the trend shifts upwards, the script calculates entry, take-profit, and stop-loss levels based on the opening price.
Similarly, for downward trends, these levels are determined for short trades.
Commission Tracking:
Each trade includes a commission cost, which is factored into net profit and loss calculations.
Dynamic Labels:
Entry, take-profit, and stop-loss levels are visually marked on the chart for easier tracking.
Performance Tracking
Profit and Loss Tracking:
The script keeps a running total of profits, losses, and commissions for both long and short trades.
It also calculates the net profit after all costs are considered.
Performance Table:
A table is displayed on the chart summarizing:
The number of trades.
Total profit and loss for long and short positions.
Commission costs.
Net profit.
Fractal Support and Resistance
Dynamic Lines:
The script identifies the most recent significant highs and lows using fractals.
It draws support and resistance lines that automatically update as new fractals form.
Simplified Visuals:
The chart always shows the last two support and resistance lines, keeping the visualization clean and focused.
RSI-Based Signals
Overbought and Oversold Levels:
RSI is used to identify overbought (above 80) and oversold (below 20) conditions.
The script generates buy signals at oversold levels and sell signals at overbought levels.
Chart Indicators:
Arrows and labels appear on the chart to highlight these RSI-based opportunities.
Customization
The script allows users to customize key parameters such as:
Moving average lengths for trend detection.
Take-profit and stop-loss percentages.
Timeframes for backtesting.
Starting capital and commission rates.
Conclusion
This script is a versatile tool for traders, combining trend detection, automated trade management, and visual feedback. It simplifies decision-making by providing clear signals and tracking performance metrics, making it suitable for both beginners and experienced traders.
* The most recently drawn fractals represent potential support and resistance levels. If the price aligns with these levels at the time of entering a trade, it may indicate a likelihood of reversal. In such cases, it’s advisable to either avoid entering the trade altogether or proceed with increased caution.

HOD/LOD/PMH/PML/PDH/PDL Strategy by @tradingbauhaus This script is a trading strategy @tradingbauhaus designed to trade based on key price levels, such as the High of Day (HOD), Low of Day (LOD), Premarket High (PMH), Premarket Low (PML), Previous Day High (PDH), and Previous Day Low (PDL). Below, I’ll explain in detail what the script does:
Core Functionality of the Script:
Calculates Key Price Levels:
HOD (High of Day): The highest price of the current day.
LOD (Low of Day): The lowest price of the current day.
PMH (Premarket High): The highest price during the premarket session (before the market opens).
PML (Premarket Low): The lowest price during the premarket session.
PDH (Previous Day High): The highest price of the previous day.
PDL (Previous Day Low): The lowest price of the previous day.
Draws Horizontal Lines on the Chart:
Plots horizontal lines on the chart for each key level (HOD, LOD, PMH, PML, PDH, PDL) with specific colors for easy visual identification.
Defines Entry and Exit Rules:
Long Entry (Buy): If the price crosses above the PMH (Premarket High) or the PDH (Previous Day High).
Short Entry (Sell): If the price crosses below the PML (Premarket Low) or the PDL (Previous Day Low).
Long Exit: If the price reaches the HOD (High of Day) during a long position.
Short Exit: If the price reaches the LOD (Low of Day) during a short position.
How the Script Works Step by Step:
Calculates Key Levels:
Uses the request.security function to fetch the HOD and LOD of the current day, as well as the highs and lows of the previous day (PDH and PDL).
Calculates the PMH and PML during the premarket session (before 9:30 AM).
Plots Levels on the Chart:
Uses the plot function to draw horizontal lines on the chart representing the key levels (HOD, LOD, PMH, PML, PDH, PDL).
Each level has a specific color for easy identification:
HOD: White.
LOD: Purple.
PDH: Orange.
PDL: Blue.
PMH: Green.
PML: Red.
Defines Trading Rules:
Uses conditions with ta.crossover and ta.crossunder to detect when the price crosses key levels.
Long Entry: If the price crosses above the PMH or PDH, a long position (buy) is opened.
Short Entry: If the price crosses below the PML or PDL, a short position (sell) is opened.
Long Exit: If the price reaches the HOD during a long position, the position is closed.
Short Exit: If the price reaches the LOD during a short position, the position is closed.
Executes Orders Automatically:
Uses the strategy.entry and strategy.close functions to open and close positions automatically based on the defined rules.
Advantages of This Strategy:
Based on Key Levels: Uses important price levels that often act as support and resistance.
Easy to Visualize: Horizontal lines on the chart make it easy to identify levels.
Automated: Entries and exits are executed automatically based on the defined rules.
Limitations of This Strategy:
Dependent on Volatility: Works best in markets with significant price movements.
False Crosses: There may be false crosses that generate incorrect signals.
No Advanced Risk Management: Does not include dynamic stop-loss or take-profit mechanisms.
How to Improve the Strategy:
Add Stop-Loss and Take-Profit: To limit losses and lock in profits.
Filter Signals with Indicators: Use RSI, MACD, or other indicators to confirm signals.
Optimize Levels: Adjust key levels based on the asset’s behavior.
In summary, this script is a trading strategy that operates based on key price levels, such as HOD, LOD, PMH, PML, PDH, and PDL. It is useful for traders who want to trade based on significant support and resistance levels.

[blackcat] L3 Counter Peacock Spread█ OVERVIEW
The script titled " L3 Counter Peacock Spread" is an indicator designed for use in TradingView. It calculates and plots various moving averages, K lines derived from these moving averages, additional simple moving averages (SMAs), weighted moving averages (WMAs), and other technical indicators like slope calculations. The primary function of the script is to provide a comprehensive set of visual tools that traders can use to identify trends, potential support/resistance levels, and crossover signals.
█ LOGICAL FRAMEWORK
Input Parameters:
There are no explicit input parameters defined; all variables are hardcoded or calculated within the script.
Calculations:
• Moving Averages: Calculates Simple Moving Averages (SMA) using ta.sma.
• Slope Calculation: Computes the slope of a given series over a specified period using linear regression (ta.linreg).
• K Lines: Defines multiple exponentially adjusted SMAs based on a 30-period MA and a 1-period MA.
• Weighted Moving Average (WMA): Custom function to compute WMAs by iterating through price data points.
• Other Indicators: Includes Exponential Moving Average (EMA) for momentum calculation.
Plotting:
Various elements such as MAs, K lines, conditional bands, additional SMAs, and WMAs are plotted on the chart overlaying the main price action.
No loops control the behavior beyond those used in custom functions for calculating WMAs. Conditional statements determine the coloring of certain plot lines based on specific criteria.
█ CUSTOM FUNCTIONS
calculate_slope(src, length) :
• Purpose: To calculate the slope of a time-series data point over a specified number of periods.
• Functionality: Uses linear regression to find the current and previous slopes and computes their difference scaled by the timeframe multiplier.
• Parameters:
– src: Source of the input data (e.g., closing prices).
– length: Periodicity of the linreg calculation.
• Return Value: Computed slope value.
calculate_ma(source, length) :
• Purpose: To calculate the Simple Moving Average (SMA) of a given source over a specified period.
• Functionality: Utilizes TradingView’s built-in ta.sma function.
• Parameters:
– source: Input data series (e.g., closing prices).
– length: Number of bars considered for the SMA calculation.
• Return Value: Calculated SMA value.
calculate_k_lines(ma30, ma1) :
• Purpose: Generates multiple exponentially adjusted versions of a 30-period MA relative to a 1-period MA.
• Functionality: Multiplies the 30-period MA by coefficients ranging from 1.1 to 3 and subtracts multiples of the 1-period MA accordingly.
• Parameters:
– ma30: 30-period Simple Moving Average.
– ma1: 1-period Simple Moving Average.
• Return Value: Returns an array containing ten different \u2003\u2022 "K line" values.
calculate_wma(source, length) :
• Purpose: Computes the Weighted Moving Average (WMA) of a provided series over a defined period.
• Functionality: Iterates backward through the last 'n' bars, weights each bar according to its position, sums them up, and divides by the total weight.
• Parameters:
– source: Price series to average.
– length: Length of the lookback window.
• Return Value: Calculated WMA value.
█ KEY POINTS AND TECHNIQUES
• Advanced Pine Script Features: Utilization of custom functions for encapsulating complex logic, leveraging TradingView’s library functions (ta.sma, ta.linreg, ta.ema) for efficient computations.
• Optimization Techniques: Efficient computation of K lines via pre-calculated components (multiples of MA30 and MA1). Use of arrays to store intermediate results which simplifies plotting.
• Best Practices: Clear separation between calculation and visualization sections enhances readability and maintainability. Usage of color.new() allows dynamic adjustments without hardcoding colors directly into plot commands.
• Unique Approaches: Introduction of K lines provides an alternative representation of trend strength compared to traditional MAs. Implementation of conditional band coloring adds real-time context to existing visual cues.
█ EXTENDED KNOWLEDGE AND APPLICATIONS
Potential Modifications/Extensions:
• Adding more user-defined inputs for lengths of MAs, K lines, etc., would make the script more flexible.
• Incorporating alert conditions based on crossovers between key lines could enhance automated trading strategies.
Application Scenarios:
• Useful for both intraday and swing trading due to the combination of short-term and long-term MAs along with trend analysis via slopes and K lines.
• Can be integrated into larger systems combining this indicator with others like oscillators or volume-based metrics.
Related Concepts:
• Understanding how linear regression works internally aids in grasping the slope calculation.
• Familiarity with WMA versus SMA helps appreciate why different types of averaging might be necessary depending on market dynamics.
• Knowledge of candlestick patterns can complement insights gained from this indicator.

[blackcat] L1 Simple Dual Channel Breakout█ OVERVIEW
The script " L1 Simple Dual Channel Breakout" is an indicator designed to plot dual channel breakout bands and their long-term EMAs on a chart. It calculates short-term and long-term moving averages and deviations to establish upper, lower, and middle bands, which traders can use to identify potential breakout opportunities.
█ LOGICAL FRAMEWORK
Structure:
The script is structured into several main sections:
• Input Parameters: The script does not explicitly define input parameters for the user to adjust, but it uses default values for short_term_length (5) and long_term_length (181).
• Calculations: The calculate_dual_channel_breakout function performs the core calculations, including the blast condition, typical price, short-term and long-term moving averages, and dynamic moving averages.
• Plotting: The script plots the short-term bands (upper, lower, and middle) and their long-term EMAs. It also plots conditional line breaks when the short-term bands cross the long-term EMAs.
Flow of Data and Logic:
1 — The script starts by defining the calculate_dual_channel_breakout function.
2 — Inside the function, it calculates various moving averages and deviations based on the input prices and lengths.
3 — The function returns the calculated bands and EMAs.
4 — The script then calls this function with predefined lengths and plots the resulting bands and EMAs on the chart.
5 — Conditional plots are added to highlight breakouts when the short-term bands cross the long-term EMAs.
█ CUSTOM FUNCTIONS
The script defines one custom function:
• calculate_dual_channel_breakout(close_price, high_price, low_price, short_term_length, long_term_length): This function calculates the short-term and long-term bands and EMAs. It takes five parameters: close_price, high_price, low_price, short_term_length, and long_term_length. It returns an array containing the upper band, lower band, middle band, long-term upper EMA, long-term lower EMA, and long-term middle EMA.
█ KEY POINTS AND TECHNIQUES
• Typical Price Calculation: The script uses a modified typical price calculation (2 * close_price + high_price + low_price) / 4 instead of the standard (high_price + low_price + close_price) / 3.
• Short-term and Long-term Bands: The script calculates short-term bands using a simple moving average (SMA) of the typical price and long-term bands using a relative moving average (RMA) of the close price.
• Conditional Plotting: The script uses conditional plotting to highlight breakouts when the short-term bands cross the long-term EMAs, enhancing visual identification of trading signals.
• EMA for Long-term Trends: The use of Exponential Moving Averages (EMAs) for long-term bands helps in smoothing out short-term fluctuations and focusing on long-term trends.
█ EXTENDED KNOWLEDGE AND APPLICATIONS
• Modifications: Users can add input parameters to allow customization of short_term_length and long_term_length, making the indicator more flexible.
• Enhancements: The script could be extended to include alerts for breakout conditions, providing traders with real-time notifications.
• Alternative Bands: Users might experiment with different types of moving averages (e.g., WMA, HMA) for the short-term and long-term bands to see if they yield better results.
• Additional Indicators: Combining this indicator with other technical indicators (e.g., RSI, MACD) could provide a more comprehensive trading strategy.
• Backtesting: Users can backtest the strategy using Pine Script's strategy functions to evaluate its performance over historical data.

[blackcat] L1 Extreme Shadows█ OVERVIEW
The Pine Script provided is an indicator designed to detect market volatility and extreme shadow conditions. It calculates various conditions based on simple moving averages (SMAs) and plots the results to help traders identify potential market extremes. The primary function of the script is to provide visual cues for extreme market conditions without generating explicit trading signals.
█ LOGICAL FRAMEWORK
Structure:
1 — Input Parameters:
• No user-defined input parameters are present in this script.
2 — Calculations:
• Calculate Extreme Shadow: Checks if the differences between certain SMAs and prices exceed predefined thresholds.
• Calculate Buy Extreme Shadow: Extends the logic by incorporating additional SMAs to identify stronger buy signals.
• Calculate Massive Bullish Sell: Detects massive bullish sell conditions using longer-term SMAs.
3 — Plotting:
• The script plots the calculated conditions using distinct colors to differentiate between various types of extreme shadows.
Data Flow:
• The close price is passed through each custom function.
• Each function computes its respective conditions based on specified SMAs and thresholds.
• The computed values are then summed and returned.
• Finally, the aggregated values are plotted on the chart using the plot function.
█ CUSTOM FUNCTIONS
1 — calculate_extreme_shadow(close)
• Purpose: Identify extreme shadow conditions based on 8-period and 14-period SMAs.
• Functionality: Computes the difference between the 8-period SMA and the close price, and the difference between the 14-period SMA and the 4-period SMA, relative to the 6-period SMA. Returns 2 if both conditions exceed 0.04; otherwise, returns 0.
• Parameters: close (price series)
• Return Value: Integer (0 or 2)
2 — calculate_buy_extreme_shadow(close)
• Purpose: Identify more robust buy signals by evaluating multiple SMAs.
• Functionality: Considers the 8-period SMA along with additional SMAs (21, 42, 63, 84, 105) and combines multiple conditions to provide a comprehensive buy signal.
• Parameters: close (price series)
• Return Value: Integer (sum of conditions, ranging from 0 to 14)
3 — calculate_massive_bullish_sell(close)
• Purpose: Detect massive bullish sell conditions using longer-term SMAs.
• Functionality: Evaluates conditions based on the 8-period SMA and longer-term SMAs (88, 44, 22, 11, 5), returning a sum of conditions meeting specified thresholds.
• Parameters: close (price series)
• Return Value: Integer (sum of conditions, ranging from 0 to 10)
█ KEY POINTS AND TECHNIQUES
• Advanced Pine Script Features:
• Multiple Nested Conditions: Uses nested conditions to assess complex market scenarios.
• Combination of Conditions: Combines multiple conditions to provide a more reliable signal.
• Optimization Techniques:
• Thresholds: Employs specific thresholds (0.04 and 0.03) to filter out noise and highlight significant market movements.
• SMA Comparisons: Compares multiple SMAs to identify trends and extreme conditions.
• Unique Approaches:
• Combining Multiple Time Frames: Incorporates multiple time frames to offer a holistic view of the market.
• Visual Distinction: Utilizes different colors and line widths to clearly differentiate between various extreme shadow conditions.
█ EXTENDED KNOWLEDGE AND APPLICATIONS
• Potential Modifications:
• User-Defined Thresholds: Allow users to customize thresholds to align with personal trading strategies.
• Additional Indicators: Integrate other technical indicators like RSI or MACD to improve the detection of extreme market conditions.
• Entry and Exit Signals: Enhance the script to generate clear buy and sell signals based on identified extreme shadow conditions.
• Application Scenarios:
• Volatility Analysis: Analyze market volatility and pinpoint times of extreme price action.
• Trend Following: Pair with trend-following strategies to capitalize on significant market moves.
• Risk Management: Adjust position sizes or stop-loss levels based on detected extreme conditions.
• Related Pine Script Concepts:
• Custom Functions: Demonstrates how to create reusable functions for simplified and organized code.
• Plotting Techniques: Shows effective ways to visualize data using color and styling options.
• Multiple Time Frame Analysis: Highlights the benefits of analyzing multiple time frames for a broader market understanding.

[blackcat] L1 Banker Move█ OVERVIEW
The Pine Script is an indicator designed to analyze market signals for institutional and short-term investors. It calculates and plots three main signals: Institutional Signal, Institutional Build, and Short-Term Investor Signal. The script uses a combination of price, volume, and moving average data to generate these signals, which can help traders identify potential buying or selling opportunities.
█ LOGICAL FRAMEWORK
The script is structured into several main sections:
1 — Input Parameters
The script does not explicitly define any input parameters, relying on default values for calculations.
2 — Custom Functions
• reference_value(values, length) : Retrieves the first non-NA value from a specified number of past values.
• calculate_institutional_and_short_term_signals(low, close, open, volume) : Calculates the institutional and short-term investor signals based on price, volume, and moving average data.
3 — Calculations
• Price and Volume Metrics: The script calculates various smoothed price changes, lowest and highest values over different periods, and volume-weighted prices.
• Moving Averages: It computes simple moving averages (SMA) and exponential moving averages (EMA) for different periods.
• RSI Calculation: The script calculates a custom RSI for different periods.
• Signal Generation: It generates the institutional and short-term investor signals based on the calculated metrics.
4 — Plotting
The script plots the three main signals on the chart using the plot function.
The flow of data and logic is as follows:
• The reference_value function is used to find reference values for calculations.
• The calculate_institutional_and_short_term_signals function performs the core calculations and returns the institutional and short-term investor signals.
• The main script calls this function and plots the results.
█ CUSTOM FUNCTIONS
1 — reference_value(values, length)
• Purpose : Retrieves the first non-NA value from a specified number of past values.
• Parameters :
• values: An array of values.
• length: The number of past values to consider.
• Return Value : The first non-NA value found or na if no valid value is found.
• Functionality : Iterates through the specified number of past values and returns the first non-NA value.
2 — calculate_institutional_and_short_term_signals(low, close, open, volume)
• Purpose : Calculates the institutional and short-term investor signals based on price, volume, and moving average data.
• Parameters :
• low: Low price series.
• close: Close price series.
• open: Open price series.
• volume: Volume series.
• Return Values :
• institutional_signal: The institutional signal.
• institutional_build: The institutional build signal.
• short_term_investor_signal: The short-term investor signal.
• Functionality :
• Computes various price and volume metrics.
• Calculates moving averages and volume-weighted prices.
• Generates the institutional and short-term investor signals based on these metrics.
█ KEY POINTS AND TECHNIQUES
1 — Advanced Pine Script Features
• Custom Functions: The script defines and uses custom functions to encapsulate complex logic.
• Conditional Statements: Extensive use of iff and if statements to control the flow of calculations.
• Looping Constructs: The for loop in reference_value function to iterate through past values.
• Exponential Moving Averages (EMA): Used to smooth out price and signal changes.
• Volume-Weighted Price (VWP): Calculated to factor in volume in price analysis.
• Custom RSI Calculation: A custom RSI formula is used, which differs from the standard RSI calculation.
2 — Optimization Techniques
• Efficient Data Handling: The reference_value function efficiently finds the first non-NA value without unnecessary computations.
• Smoothed Signals: Using EMAs to smooth out noisy signals for better trend identification.
3 — Unique Approaches
• Combination of Metrics: The script combines multiple metrics (price, volume, moving averages, and custom RSI) to generate comprehensive signals.
• Institutional Build Signal: A unique approach to detect institutional activity by comparing current price levels with historical lows and smoothed price changes.
█ EXTENDED KNOWLEDGE AND APPLICATIONS
1 — Potential Modifications
• Input Parameters: Add input parameters to allow users to customize the lengths and thresholds used in the calculations.
• Strategy Version: Convert the indicator into a strategy by adding buy/sell signals based on the generated signals.
• Additional Indicators: Integrate other technical indicators (e.g., MACD, Bollinger Bands) to enhance the signal generation process.
2 — Similar Trading Scenarios
• Institutional Activity Analysis: Use similar techniques to analyze institutional activity in other markets or assets.
• Volume Analysis: Apply the volume-weighted price and volume analysis to identify significant price movements.
• Multi-Timeframe Analysis: Extend the script to analyze signals across multiple timeframes for a more robust trading strategy.
3 — Related Pine Script Concepts
• Pine Script Functions: Understanding how to define and use custom functions effectively.
• Conditional Logic: Mastering the use of iff and if statements for complex logic.
• Looping Constructs: Familiarity with for loops for iterating through data.
• Moving Averages: Knowledge of different types of moving averages and their applications.
• Volume Analysis: Techniques for incorporating volume data into price analysis.

Forecast Daily BIAS**Indicator Name:** Forecast Daily BIAS
**Description:**
The Forecast Daily BIAS indicator is designed to predict the expected price direction (BIAS) for the current trading day. It analyzes key price levels from the previous day (high, low, and close) and compares them to the opening price of the current day. The indicator provides a simple forecast for the day's price movement: **Bullish**, **Bearish**, or **Neutral**.
Key Features:
- Bullish Prediction: When the opening price is higher than the previous day's close and above the average of the previous day's high and low.
- Bearish Prediction: When the opening price is lower than the previous day's close and below the average of the previous day's high and low.
- Neutral Prediction: If the price does not meet the conditions for bullish or bearish bias.
- Visual Indicators:
- Displays the BIAS forecast directly on the chart with labels.
- Highlights the chart background with colors (green for bullish, red for bearish) for easy interpretation.
Use Case:
This indicator is ideal for traders looking to identify the probable direction of the market for the day and plan their intraday trading strategies accordingly. It is particularly useful for day traders who rely on prior price levels to make informed decisions.
How to Use:
1. Add the indicator to your chart.
2. Observe the daily BIAS prediction:
- Green Background: Likely bullish trend.
- Red Background: Likely bearish trend.
- No Highlight: Neutral trend.
3. Use the forecast in conjunction with other indicators or strategies to confirm your trades.
Note: The indicator provides a basic directional bias and should not be used as a standalone trading signal. Always consider additional market factors and risk management.

Ichimoku by FarmerBTCLegal Disclaimer
This strategy, "Ichimoku by FarmerBTC," is provided for educational and informational purposes only. It does not constitute financial advice and should not be relied upon as such. Trading and investing involve substantial risk, including the potential for losing more than your initial investment. Past performance is not indicative of future results. Always consult with a qualified financial advisor before making trading or investment decisions. The author of this strategy is not responsible for any financial losses incurred through its use.
Overview
The "Ichimoku by FarmerBTC" strategy is a trend-following system built on the Ichimoku Cloud indicator, enhanced with volume analysis and a high-timeframe Simple Moving Average (HTF SMA) condition. It is designed to identify long-only trade opportunities and performs optimally on higher timeframes, such as the daily chart or above.
Core Components
1. Ichimoku Cloud
The Ichimoku Cloud is a comprehensive trend-following indicator that helps identify the overall market direction and momentum. It consists of:
Conversion Line (Tenkan-Sen): Measures short-term momentum.
Base Line (Kijun-Sen): Filters medium-term trends.
Leading Span A: The average of the Conversion and Base Lines, forming one cloud boundary.
Leading Span B: The midpoint of the highest high and lowest low over a longer period, forming the other cloud boundary.
Key Ichimoku Rules Applied:
The strategy identifies bullish trends when:
The price is above the cloud.
The cloud is bullish (Leading Span A > Leading Span B).
2. High-Timeframe Simple Moving Average (HTF SMA)
This condition ensures alignment with the broader trend:
Default SMA Length: 13 periods.
Default Timeframe: 1 day.
HTF SMA Rule:
Trades are allowed only when the price is above the HTF SMA, ensuring alignment with the larger trend.
3. Volume Analysis
The strategy uses volume to validate trade setups:
Volume MA: A 20-period moving average of volume is calculated.
Trades are allowed only when the current volume is at least 1.5x the Volume MA, indicating strong market participation.
Entry and Exit Rules
Entry Condition (Long Only):
Price above the Ichimoku Cloud: Confirms a bullish trend.
Bullish Cloud: Leading Span A > Leading Span B indicates upward momentum.
Price above the HTF SMA: Ensures alignment with the broader trend.
Volume exceeds threshold: Confirms strong market participation.
Exit Condition:
The strategy exits the position when the price moves below the Ichimoku Cloud, signaling a potential trend reversal.
Best Timeframes
This strategy is optimized for daily (1D) or higher timeframes (e.g., weekly 1W). Using it on lower timeframes may produce false signals due to increased noise in price and volume data.
Default Settings
Ichimoku Settings:
Conversion Line Period: 10
Base Line Period: 30
Lagging Span Period: 53
Displacement: 26
HTF SMA Settings:
SMA Length: 13
Timeframe: 1 Day
Volume Settings:
Volume MA Length: 20
Volume Multiplier: 1.5x
Visualization
Ichimoku Cloud:
Dynamic cloud coloring (green for bullish, red for bearish) helps identify the current trend.
HTF SMA:
A purple line overlays the chart, providing a clear representation of the high-timeframe trend.
Volume Panel:
An optional panel displays volume (blue histogram) and the Volume Moving Average (orange line) to analyze market participation.
Advantages of This Strategy
High Accuracy on Higher Timeframes:
Filtering trades using the Ichimoku Cloud, HTF SMA, and volume ensures robust trend alignment, reducing false signals.
Volume Confirmation:
Incorporates volume as a validation metric to enter trades only during strong market participation.
Easy Customization:
Parameters like Ichimoku periods, SMA length, timeframe, and volume thresholds can be adjusted to suit different assets or trading styles.
Limitations
Not Suitable for Low Timeframes:
Lower timeframes can produce excessive noise, leading to false signals.
Long-Only:
The strategy is designed only for bullish markets and does not support short trades.
Lagging Nature of Indicators:
Both the Ichimoku Cloud and SMA are lagging indicators, meaning they react to past price movements.
Conclusion
The "Ichimoku by FarmerBTC" strategy is an excellent tool for trend-following on daily or higher timeframes. Its combination of Ichimoku Cloud, high-timeframe SMA, and volume ensures a robust framework for identifying high-probability long trades in trending markets. However, users are advised to test the strategy thoroughly and manage their risk appropriately. Always consult with a financial professional before making trading decisions.

Top-Down Trend and Key Levels with Swing Points//by antaryaami0
Overview
The “Top-Down Trend and Key Levels with Swing Points” indicator is a comprehensive tool designed to enhance your technical analysis by integrating multiple trading concepts into a single, easy-to-use script. It combines higher timeframe trend analysis, key price levels, swing point detection, and ranging market identification to provide a holistic view of market conditions. This indicator is particularly useful for traders who employ multi-timeframe analysis, support and resistance levels, and price action strategies.
Key Features
1. Higher Timeframe Trend Background Shading:
• Purpose: Identifies the prevailing trend on a higher timeframe to align lower timeframe trading decisions with the broader market direction.
• How it Works: The indicator compares the current higher timeframe close with the previous one to determine if the trend is up, down, or ranging.
• Customization:
• Trend Timeframe: Set your preferred higher timeframe (e.g., Daily, Weekly).
• Up Trend Color & Down Trend Color: Customize the background colors for uptrends and downtrends.
• Ranging Market Color: A separate color to indicate when the market is moving sideways.
2. Key Price Levels:
• Previous Day High (PDH) and Low (PDL):
• Purpose: Identifies key support and resistance levels from the previous trading day.
• Visualization: Plots horizontal lines at PDH and PDL with labels.
• Customization: Option to show or hide these levels and customize their colors.
• Pre-Market High (PMH) and Low (PML):
• Purpose: Highlights the price range during the pre-market session, which can indicate potential breakout levels.
• Visualization: Plots horizontal lines at PMH and PML with labels.
• Customization: Option to show or hide these levels and customize their colors.
3. First 5-Minute Marker (F5H/F5L):
• Purpose: Marks the high or low of the first 5 minutes after the market opens, which is significant for intraday momentum.
• How it Works:
• If the first 5-minute high is above the Pre-Market High (PMH), an “F5H” label is placed at the first 5-minute high.
• If the first 5-minute high is below the PMH, an “F5L” label is placed at the first 5-minute low.
• Visualization: Labels are placed at the 9:35 AM candle (closing of the first 5 minutes), colored in purple by default.
• Customization: Option to show or hide the marker and adjust the marker color.
4. Swing Points Detection:
• Purpose: Identifies significant pivot points in price action to help recognize trends and reversals.
• How it Works: Uses left and right bars to detect pivot highs and lows, then determines if they are Higher Highs (HH), Lower Highs (LH), Higher Lows (HL), or Lower Lows (LL).
• Visualization: Plots small markers (circles) with labels (HH, LH, HL, LL) at the corresponding swing points.
• Customization: Adjust the number of left and right bars for pivot detection and the size of the markers.
5. Ranging Market Detection:
• Purpose: Identifies periods when the market is consolidating (moving sideways) within a defined price range.
• How it Works: Calculates the highest high and lowest low over a specified period and determines if the price range is within a set percentage threshold.
• Visualization: Draws a gray box around the price action during the ranging period and labels the high and low prices at the end of the range.
• Customization: Adjust the range detection period and threshold, as well as the box color.
6. Trend Coloring on Chart:
• Purpose: Provides a visual cue for the short-term trend based on a moving average.
• How it Works: Colors the candles green if the price is above the moving average and red if below.
• Customization: Set the moving average length and customize the uptrend and downtrend colors.
How to Use the Indicator
1. Adding the Indicator to Your Chart:
• Copy the Pine Script code provided and paste it into the Pine Script Editor on TradingView.
• Click “Add to Chart” to apply the indicator.
2. Configuring Inputs and Settings:
• Access Inputs:
• Click on the gear icon next to the indicator’s name on your chart to open the settings.
• Customize Key Levels:
• Show Pre-Market High/Low: Toggle on/off.
• Show Previous Day High/Low: Toggle on/off.
• Show First 5-Minute Marker: Toggle on/off.
• Set Trend Parameters:
• Trend Timeframe for Background: Choose the higher timeframe for trend analysis.
• Moving Average Length for Bar Color: Set the period for the moving average used in bar coloring.
• Adjust Ranging Market Detection:
• Range Detection Period: Specify the number of bars to consider for range detection.
• Range Threshold (%): Set the maximum percentage range for the market to be considered ranging.
• Customize Visuals:
• Colors: Adjust colors for trends, levels, markers, and ranging market boxes.
• Label Font Size: Choose the size of labels displayed on the chart.
• Level Line Width: Set the thickness of the lines for key levels.
3. Interpreting the Indicator:
• Background Shading:
• Green Shade: Higher timeframe is in an uptrend.
• Red Shade: Higher timeframe is in a downtrend.
• Gray Box: Market is ranging (sideways movement).
• Key Levels and Markers:
• PDH and PDL Lines: Represent resistance and support from the previous day.
• PMH and PML Lines: Indicate potential breakout levels based on pre-market activity.
• F5H/F5L Labels: Early indication of intraday momentum after market open.
• Swing Point Markers:
• HH (Higher High): Suggests bullish momentum.
• LH (Lower High): May indicate a potential bearish reversal.
• HL (Higher Low): Supports bullish continuation.
• LL (Lower Low): Indicates bearish momentum.
• Ranging Market Box:
• Gray Box Around Price Action: Highlights consolidation periods where breakouts may occur.
• Range High and Low Labels: Provide the upper and lower bounds of the consolidation zone.
4. Applying the Indicator to Your Trading Strategy:
• Trend Alignment:
• Use the higher timeframe trend shading to align your trades with the broader market direction.
• Key Levels Trading:
• Watch for price reactions at PDH, PDL, PMH, and PML for potential entry and exit points.
• Swing Points Analysis:
• Identify trend continuations or reversals by observing the sequence of HH, HL, LH, and LL.
• Ranging Market Strategies:
• During ranging periods, consider range-bound trading strategies or prepare for breakout trades when the price exits the range.
• Intraday Momentum:
• Use the F5H/F5L marker to gauge early market sentiment and potential intraday trends.
Practical Tips
• Adjust Settings to Your Trading Style:
• Tailor the indicator’s inputs to match your preferred timeframes and trading instruments.
• Combine with Other Indicators:
• Use in conjunction with volume indicators, oscillators, or other technical tools for additional confirmation.
• Backtesting:
• Apply the indicator to historical data to observe how it performs and refine your settings accordingly.
• Stay Updated on Market Conditions:
• Be aware of news events or economic releases that may impact market behavior and the effectiveness of technical levels.
Customization Options
• Time Zone Adjustment:
• The script uses “America/New_York” time zone by default. Adjust the timezone variable in the script if your chart operates in a different time zone.
var timezone = "Your/Timezone"
• Session Times:
• Modify the Regular Trading Session and Pre-Market Session times in the indicator settings to align with the trading hours of different markets or exchanges.
• Visual Preferences:
• Colors: Personalize the indicator’s colors to suit your visual preferences or to enhance visibility.
• Label Sizes: Adjust label sizes if you find them too intrusive or not prominent enough.
• Marker Sizes: Further reduce or enlarge the swing point markers by modifying the swing_marker_size variable.
Understanding the Indicator’s Logic
1. Higher Timeframe Trend Analysis:
• The indicator retrieves the closing prices of a higher timeframe using the request.security() function.
• It compares the current higher timeframe close with the previous one to determine the trend direction.
2. Key Level Calculation:
• Previous Day High/Low: Calculated by tracking the highest and lowest prices of the previous trading day.
• Pre-Market High/Low: Calculated by monitoring price action during the pre-market session.
3. First 5-Minute Marker Logic:
• At 9:35 AM (end of the first 5 minutes after market open), the indicator evaluates whether the first 5-minute high is above or below the PMH.
• It then places the appropriate label (F5H or F5L) on the chart.
4. Swing Points Detection:
• The script uses ta.pivothigh() and ta.pivotlow() functions to detect pivot points.
• It then determines the type of swing point based on comparisons with previous swings.
5. Ranging Market Detection:
• The indicator looks back over a specified number of bars to find the highest high and lowest low.
• It calculates the percentage difference between these two points.
• If the difference is below the set threshold, the market is considered to be ranging, and a box is drawn around the price action.
Limitations and Considerations
• Indicator Limitations:
• Maximum Boxes and Labels: Due to Pine Script limitations, there is a maximum number of boxes and labels that can be displayed simultaneously.
• Performance Impact: Adding multiple visual elements (boxes, labels, markers) can affect the performance of the script on lower-end devices or with large amounts of data.
• Market Conditions:
• False Signals: Like any technical tool, the indicator may produce false signals, especially during volatile or erratic market conditions.
• Not a Standalone Solution: This indicator should be used as part of a comprehensive trading strategy, including risk management and other forms of analysis.
Conclusion
The “Top-Down Trend and Key Levels with Swing Points” indicator is a versatile tool that integrates essential aspects of technical analysis into one script. By providing insights into higher timeframe trends, highlighting key price levels, detecting swing points, and identifying ranging markets, it equips traders with valuable information to make more informed trading decisions. Whether you are a day trader looking for intraday opportunities or a swing trader aiming to align with the broader trend, this indicator can enhance your chart analysis and trading strategy.
Disclaimer
Trading involves significant risk, and it’s important to understand that past performance is not indicative of future results. This indicator is a tool to assist in analysis and should not be solely relied upon for making trading decisions. Always conduct thorough research and consider seeking advice from financial professionals before engaging in trading activities.

ADM Indicator [CHE] Comprehensive Description of the Three Market Phases for TradingView
Introduction
Financial markets often exhibit patterns that reflect the collective behavior of participants. Recognizing these patterns can provide traders with valuable insights into potential future price movements. The ADM Indicator is designed to help traders identify and capitalize on these patterns by detecting three primary market phases:
1. Accumulation Phase
2. Manipulation Phase
3. Distribution Phase
This indicator places labels on the chart to signify these phases, aiding traders in making informed decisions. Below is an in-depth explanation of each phase, including how the ADM Indicator detects them.
1. Accumulation Phase
Definition
The Accumulation Phase is a period where informed investors or institutions discreetly purchase assets before a potential price increase. During this phase, the price typically moves within a confined range between established highs and lows.
Characteristics
- Price Range Bound: The asset's price stays within the previous high and low after a timeframe change.
- Low Volatility: Minimal price movement indicates a balance between buyers and sellers.
- Steady Volume: Trading volume may remain relatively constant or show slight increases.
- Market Sentiment: General market interest is low, as the accumulation is not yet apparent to the broader market.
Detection with ADM Indicator
- Criteria: An accumulation is detected when the price remains within the previous high and low after a timeframe change.
- Indicator Action: At the end of the period, if accumulation has occurred, the indicator places a label "Accumulation" on the chart.
- Visual Cues: A yellow semi-transparent background highlights the accumulation phase, enhancing visual recognition.
Implications for Traders
- Entry Opportunity: Consider preparing for potential long positions before a possible upward move.
- Risk Management: Use tight stop-loss orders below the support level due to the defined trading range.
2. Manipulation Phase
Definition
The Manipulation Phase, also known as the Shakeout Phase, occurs when dominant market players intentionally move the price to trigger stop-loss orders and create panic among less-informed traders. This action generates liquidity and better entry prices for large positions.
Characteristics
- False Breakouts: The price moves above the previous high or below the previous low but quickly reverses.
- Increased Volatility: Sharp price movements occur without fundamental reasons.
- Stop-Loss Hunting: The price targets common stop-loss areas, triggering them before reversing.
- Emotional Trading: Retail traders may react impulsively, leading to poor trading decisions.
Detection with ADM Indicator
- Manipulation Up:
- Criteria: Detected when the price rises above the previous high and then falls back below it.
- Indicator Action: Places a label "Manipulation Up" on the chart at the point of detection.
- Manipulation Down:
- Criteria: Detected when the price falls below the previous low and then rises back above it.
- Indicator Action: Places a label "Manipulation Down" on the chart at the point of detection.
- Visual Cues:
- Manipulation Up: Blue background highlights the phase.
- Manipulation Down: Orange background highlights the phase.
Implications for Traders
- Caution Advised: Be wary of false signals and avoid overreacting to sudden price changes.
- Preparation for Next Phase: Use this phase to anticipate potential distribution and adjust strategies accordingly.
3. Distribution Phase
Definition
The Distribution Phase occurs when the institutions or informed investors who accumulated positions start selling to the general market at higher prices. This phase often follows a Manipulation Phase and may signal an impending trend reversal.
Characteristics
- Price Reversal: The price moves in the opposite direction of the prior manipulation.
- High Trading Volume: Increased selling activity as large players offload positions.
- Trend Weakening: The previous trend loses momentum, indicating a potential shift.
- Market Sentiment Shift: Optimism fades, and uncertainty or pessimism may emerge.
Detection with ADM Indicator
- Distribution Up:
- Criteria: Detected after a verified Manipulation Up when the price subsequently falls below the previous low.
- Indicator Action: Places a label "Distribution Up" on the chart.
- Distribution Down:
- Criteria: Detected after a verified Manipulation Down when the price subsequently rises above the previous high.
- Indicator Action: Places a label "Distribution Down" on the chart.
- Visual Cues:
- Distribution Up: Purple background highlights the phase.
- Distribution Down: Maroon background highlights the phase.
Implications for Traders
- Exit Signals: Consider closing long positions if in a Distribution Up phase.
- Short Selling Opportunities: Potential to enter short positions anticipating a downtrend.
Using the ADM Indicator on TradingView
Indicator Overview
The ADM Indicator automates the detection of Accumulation, Manipulation, and Distribution phases by analyzing price movements relative to previous highs and lows on a selected timeframe. It provides visual cues and labels on the chart, helping traders quickly identify the current market phase.
Features
- Multi-Timeframe Analysis: Choose from auto, multiplier, or manual timeframe settings.
- Visual Labels: Clear labeling of market phases directly on the chart.
- Background Highlighting: Distinct background colors for each phase.
- Customizable Settings: Adjust colors, styles, and display options.
- Period Separators: Optional separators delineate different timeframes.
Interpreting the Indicator
1. Accumulation Phase
- Detection: Price stays within the previous high and low after a timeframe change.
- Label: "Accumulation" placed at the period's end if detected.
- Background: Yellow semi-transparent color.
- Action: Prepare for potential long positions.
2. Manipulation Phase
- Detection:
- Manipulation Up: Price rises above previous high and then falls back below.
- Manipulation Down: Price falls below previous low and then rises back above.
- Labels: "Manipulation Up" or "Manipulation Down" placed at detection.
- Background:
- Manipulation Up: Blue color.
- Manipulation Down: Orange color.
- Action: Exercise caution; avoid impulsive trades.
3. Distribution Phase
- Detection:
- Distribution Up: After a Manipulation Up, price falls below previous low.
- Distribution Down: After a Manipulation Down, price rises above previous high.
- Labels: "Distribution Up" or "Distribution Down" placed at detection.
- Background:
- Distribution Up: Purple color.
- Distribution Down: Maroon color.
- Action: Consider exiting positions or entering counter-trend trades.
Configuring the Indicator
- Timeframe Type: Select Auto, Multiplier, or Manual for analysis timeframe.
- Multiplier: Set a custom multiplier when using "Multiplier" type.
- Manual Resolution: Define a specific timeframe with "Manual" option.
- Separator Settings: Customize period separators for visual clarity.
- Label Display Options: Choose to display all labels or only the most recent.
- Visualization Settings: Adjust colors and styles for personal preference.
Practical Tips
- Combine with Other Analysis Tools: Use alongside volume indicators, trend lines, or other technical tools.
- Backtesting: Review historical data to understand how the indicator signals would have impacted past trades.
- Stay Informed: Keep abreast of market news that might affect price movements beyond technical analysis.
- Risk Management: Always employ stop-loss orders and position sizing strategies.
Conclusion
The ADM Indicator is a valuable tool for traders seeking to understand and leverage market phases. By detecting Accumulation, Manipulation, and Distribution phases through specific price action criteria, it provides actionable insights into market dynamics.
Understanding the precise conditions under which each phase is detected empowers traders to make more informed decisions. Whether preparing for potential breakouts during accumulation, exercising caution during manipulation, or adjusting positions during distribution, the ADM Indicator aids in navigating the complexities of the financial markets.
Disclaimer:
The content provided, including all code and materials, is strictly for educational and informational purposes only. It is not intended as, and should not be interpreted as, financial advice, a recommendation to buy or sell any financial instrument, or an offer of any financial product or service. All strategies, tools, and examples discussed are provided for illustrative purposes to demonstrate coding techniques and the functionality of Pine Script within a trading context.
Any results from strategies or tools provided are hypothetical, and past performance is not indicative of future results. Trading and investing involve high risk, including the potential loss of principal, and may not be suitable for all individuals. Before making any trading decisions, please consult with a qualified financial professional to understand the risks involved.
By using this script, you acknowledge and agree that any trading decisions are made solely at your discretion and risk.
This indicator is inspired by the Super 6x Indicators: RSI, MACD, Stochastic, Loxxer, CCI, and Velocity . A special thanks to Loxx for their relentless effort, creativity, and contributions to the TradingView community, which served as a foundation for this work.
Best regards Chervolino
Overview of the Timeframe Levels in the `autotimeframe()` Function
The `autotimeframe()` function automatically adjusts the higher timeframe based on the current chart timeframe. Here are the specific timeframe levels used in the function:
- Current Timeframe ≤ 1 Minute
→ Higher Timeframe: 240 Minutes (4 Hours)
- Current Timeframe ≤ 5 Minutes
→ Higher Timeframe: 1 Day
- Current Timeframe ≤ 1 Hour
→ Higher Timeframe: 3 Days
- Current Timeframe ≤ 4 Hours
→ Higher Timeframe: 7 Days
- Current Timeframe ≤ 12 Hours
→ Higher Timeframe: 1 Month
- Current Timeframe ≤ 1 Day
→ Higher Timeframe: 3 Months
- Current Timeframe ≤ 7 Days
→ Higher Timeframe: 6 Months
- For All Higher Timeframes (over 7 Days)
→ Higher Timeframe: 12 Months
Summary:
The function assigns a corresponding higher timeframe based on the current timeframe to optimize the analysis:
- 1 Minute or Less → 4 Hours
- Up to 5 Minutes → 1 Day
- Up to 1 Hour → 3 Days
- Up to 4 Hours → 7 Days
- Up to 12 Hours → 1 Month
- Up to 1 Day → 3 Months
- Up to 7 Days → 6 Months
- Over 7 Days → 12 Months
This automated adjustment ensures that the indicator works effectively across different chart timeframes without requiring manual changes.

[SGM Auto Regressiv - significant lags only]This Pine Script™ is designed for traders seeking advanced statistical analysis based on autoregressive (AR) models, with automatic filtering of significant lags according to a customizable confidence threshold.
Key Features:
AR(p) Model with Significance Filtering:
Only statistically significant lags (based on the selected confidence level) are included in the model calculations.
Coefficient Weighting Options:
Uniform weighting.
Weighting based on the t-statistic.
Visualization of Key Indicators:
Dynamic plotting of autoregressive values, upper and lower bounds (based on standard deviation).
Buy ("Buy") and Sell ("Sell") signals when values exceed the defined bounds.
Robust Analysis:
Calculation of statistical parameters: T-stat, p-value, skewness, kurtosis, r², and the Jarque-Bera test to assess the robustness and normality of residuals.
Summary of results displayed in a visual table for simplified interpretation.
Interactive Tables:
Display of lags, coefficients, t-statistics, p-values, and their significance via a dynamic table.
Overall robustness indicator and interpretation of results ("Good," "Non-significant," etc.).
Easy Customization:
Adjustable confidence level (90% to 99%).
Configurable lengths for moving average and standard deviation to fine-tune signal thresholds.
Benefits for Traders:
Effortless Analysis:
Automatically identifies significant relationships between past and present values, removing unnecessary assumptions.
Enhanced Accuracy:
Filters signals based on rigorous statistical criteria to avoid false signals.
Clear Visualization:
Interactive tables and plots to quickly understand critical parameters.
Default Configuration:
Confidence level: 95%.
Lag weighting: Uniform.
Moving average length: 20 periods.
Standard deviation length: 15 periods.
Usage Recommendations:
Ideal for analyzing volatile assets or identifying potential reversal zones.
Use alongside other indicators to confirm signals.

Optimized Future Time Cycles V2Time Cycle-Based Indicator Overview
This script utilizes Time Cycles to visually display the periodic fluctuations of the past and future, helping to predict key market turning points and trend shifts.
The indicator is fully customizable and marks periodic vertical lines and labels on the chart based on a specified reference date.
1. Key Features
Time Cycle Settings
Displays various user-defined time cycles (e.g., 9 days, 17 days, 26 days) visually on the chart.
Each cycle is distinguished by unique colors and labels for clear identification.
Allows users to set a reference date, from which past and future cycles are calculated.
Past and Future Cycle Visualization
Future Cycles:
Predicts potential points of market fluctuations or trend changes in the future.
Vertical lines represent future turning points based on the defined time cycles.
Past Cycles:
Displays how cyclical patterns manifested in historical market data.
Helps identify recurring patterns and similar historical market conditions.
Customizable Visuals
Adjust line styles (solid, dashed, etc.) and label spacing for a cleaner chart, even with multiple cycles displayed.
Separately toggle the visibility of past and future cycles for a more tailored analysis experience.
2. How to Use and Interpret the Indicator
Setting the Reference Date
The reference date is crucial for this indicator and works best when set to significant market events or turning points.
Both past and future cycles are calculated based on the reference date, and overlapping cycles may indicate periods of high volatility or strong trend shifts.
Cycle Analysis
Interpretation by Cycle Duration:
Short-term Cycles (9, 17 days): Useful for predicting quick market fluctuations.
Mid- to Long-term Cycles (26, 52, 200 days): Ideal for identifying major trend changes.
Overlapping Cycles:
When multiple cycles converge, significant turning points or strong market movements are likely.
Importance of Past Cycles
Past cycles are invaluable for identifying repetitive patterns in the market.
For example, analyzing strong turning points from past cycles can help anticipate similar scenarios in the future.
3. Tips for Using the Indicator
Optimize Line Styles:
When displaying both past and future cycles, charts may become cluttered. Adjusting line styles or colors can help maintain visual clarity.
Short-term vs. Long-term Cycles:
Short-term Cycles: Best suited for strategies like scalping or day trading.
Long-term Cycles: Useful for capturing major trend shifts or identifying macroeconomic changes.
Recommended Combination with Other Indicators:
Combine the Time Cycle indicator with moving averages, wave indicators, RSI, or Bollinger Bands for better results.
The time cycle identifies the timing of turning points, while tools like moving averages or RSI provide insights into trend direction during these critical moments.
4. Conclusion
This Time Cycle indicator visualizes past and future periodic fluctuations, enabling effective predictions of market trends and turning points.
The reference date and overlapping cycles are essential for pinpointing critical turning points.
The newly added past cycle visualization feature enhances the ability to recognize recurring patterns and leverage historical data for more accurate predictions.
시간 주기(Time Cycle) 기반 지표 소개
이 스크립트는 **시간 주기(Time Cycle)**를 활용해 과거와 미래의 주기적 변동을 시각적으로 보여주어, 시장의 추세 변화 시점과 변곡점을 예측하는 데 도움을 줍니다.
지표는 사용자 정의가 가능하며, 설정된 기준 날짜를 기반으로 주기적인 수직선과 레이블을 차트에 표시합니다.
1. 주요 기능
시간 주기 설정
사용자가 설정한 다양한 시간 주기(예: 9일, 17일, 26일 등)를 시각적으로 표시.
각 주기는 고유한 색상과 레이블로 구분되어 명확하게 차트에 나타납니다.
**기준 날짜(reference date)**를 설정하여, 해당 날짜를 기준으로 과거와 미래의 주기를 계산합니다.
미래와 과거 주기 표시
미래 주기:
미래의 시장 변동 시점이나 추세 변화 가능성이 높은 지점을 예측할 수 있습니다.
설정된 시간 주기에 따라 미래 변곡점을 차트에 수직선으로 나타냅니다.
과거 주기:
과거 시장에서 주기적 변동이 어떻게 나타났는지 확인 가능합니다.
이를 통해 반복되는 패턴이나 과거와 유사한 시장 상황을 파악할 수 있습니다.
시각적 사용자 설정
수직선 스타일(실선, 점선 등)과 레이블 간격을 조정하여, 복잡한 차트에서도 깔끔하게 정보를 확인할 수 있습니다.
과거와 미래의 주기 표시를 개별적으로 조정 가능하여 사용자 맞춤형 분석이 가능합니다.
2. 지표 사용 및 해석 방법
기준 날짜 설정
**기준 날짜(reference date)**는 시장에서 중요한 변동이 있었던 날을 기준으로 설정하는 것이 가장 효과적입니다.
기준 날짜를 기반으로 과거와 미래 주기가 계산되며, 주기가 겹치는 시점에서 강한 변동성이 나타날 가능성이 높습니다.
주기 분석
주기별 해석:
단기 주기 (9일, 17일): 빠른 변동성을 예측.
중·장기 주기 (26일, 52일, 200일): 큰 추세 변화를 예측.
주기가 겹치는 시점은 중요한 변곡점이 될 가능성이 크며, 추세 전환의 신호로 볼 수 있습니다.
과거 주기의 중요성
과거 주기는 시장의 반복 패턴을 찾는 데 유용합니다.
예를 들어, 과거 주기에서 강한 변곡점이 나타났던 시점을 분석하면, 미래에도 유사한 상황이 발생할 가능성을 예측할 수 있습니다.
3. 지표 활용 팁
수직선 스타일 최적화:
과거와 미래 주기를 모두 표시하면 차트가 복잡해질 수 있으므로, 선 스타일이나 색상을 조정하여 시각적으로 덜 혼란스럽게 설정하세요.
단기 vs. 장기 주기:
단기 주기는 스캘핑과 같은 빠른 매매 전략에 유용하며,
장기 주기는 대세 추세 변화를 포착하는 데 유리합니다.
결합 사용 추천:
시간 주기(Time Cycle) 지표는 이평선 파동 지표 또는 RSI, 볼린저 밴드와 함께 사용하면 더욱 효과적입니다.
시간 주기는 변곡점의 시점을 알려주고, 이평선 파동이나 RSI는 그 시점에서의 추세 방향성을 보완해 줍니다.
4. 결론
이 시간 주기(Time Cycle) 지표는 과거와 미래의 주기적 변동을 시각화하여, 시장의 추세 변화와 변곡점을 효과적으로 예측할 수 있습니다.
특히, 기준 날짜 설정과 주기적 겹침은 중요한 변곡점을 파악하는 핵심입니다.
새롭게 추가된 과거 주기 표시 기능은 반복 패턴을 확인하고 과거 데이터를 바탕으로 더 정교한 예측을 가능하게 합니다.

Supply and Demand [tambangEA]Supply and Demand Indicator Overview
The Supply and Demand indicator on TradingView is a technical tool designed to help traders identify areas of significant buying and selling pressure in the market. By identifying zones where price is likely to react, it helps traders pinpoint key support and resistance levels based on the concepts of supply and demand. This indicator plots zones using four distinct types of market structures:
1. Rally-Base-Rally (RBR) : This structure represents a bullish continuation zone. It occurs when the price rallies (increases), forms a base (consolidates), and then rallies again. The base represents a period where buying interest builds up before the continuation of the upward movement. This zone can act as support, where buyers may step back in if the price revisits the area.
2. Drop-Base-Rally (DBR) : This structure marks a bullish reversal zone. It forms when the price drops, creates a base, and then rallies. The base indicates a potential exhaustion of selling pressure and a build-up of buying interest. When price revisits this zone, it may act as support, signaling a buying opportunity.
3. Rally-Base-Drop (RBD) : This structure signifies a bearish reversal zone. Here, the price rallies, consolidates into a base, and then drops. The base indicates a temporary balance before sellers overpower buyers. If price returns to this zone, it may act as resistance, with selling interest potentially re-emerging.
4. Drop-Base-Drop (DBD) : This structure is a bearish continuation zone. It occurs when the price drops, forms a base, and then continues dropping. This base reflects a pause before further downward movement. The zone may act as resistance, with sellers possibly stepping back in if the price revisits the area.
Features of Supply and Demand Indicator
Automatic Zone Detection : The indicator automatically identifies and plots RBR, DBR, RBD, and DBD zones on the chart, making it easier to see potential supply and demand areas.
Customizable Settings : Users can typically adjust the color and transparency of the zones, time frames for analysis, and zone persistence to suit different trading styles.
Visual Alerts : Many versions include alert functionalities, notifying users when price approaches a plotted supply or demand zone.
How to Use Supply and Demand in Trading
Identify High-Probability Reversal Zones : Look for DBR and RBD zones to identify potential areas where price may reverse direction.
Trade Continuations with RBR and DBD Zones : These zones can indicate strong trends, suggesting that price may continue in the same direction.
Combine with Other Indicators: Use it alongside trend indicators, volume analysis, or price action strategies to confirm potential trade entries and exits.
This indicator is particularly useful for swing and day traders who rely on price reaction zones for entering and exiting trades.
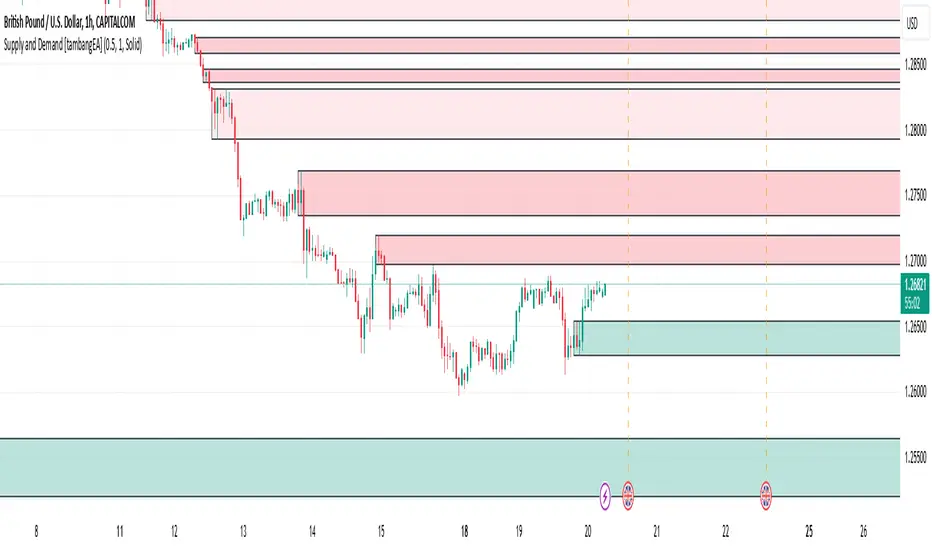
MACD+RSI+BBDESCRIPTION
The MACD + RSI + Bollinger Bands Indicator is a comprehensive technical analysis tool designed for traders and investors to identify potential market trends and reversals. This script combines three indicators: the Moving Average Convergence Divergence (MACD), the Relative Strength Index (RSI), and Bollinger Bands. Each of these indicators provides unique insights into market behavior.
FEATURES
MACD (Moving Average Convergence Divergence)
The MACD is a trend-following momentum indicator that shows the relationship between two moving averages of a security’s price.
The script calculates the MACD line, the signal line, and the histogram, which visually represents the difference between the MACD line and the signal line.
RSI (Relative Strength Index)
The RSI is a momentum oscillator that measures the speed and change of price movements. It ranges from 0 to 100 and is typically used to identify overbought or oversold conditions.
The script allows users to set custom upper and lower thresholds for the RSI, with default values of 70 and 30, respectively.
Bollinger Bands
Bollinger Bands consist of a middle band (EMA) and two outer bands (standard deviations away from the EMA). They help traders identify volatility and potential price reversals.
The script allows users to customize the length of the Bollinger Bands and the multiplier for the standard deviation.
Color-Coding Logic
The histogram color changes based on the following conditions:
Black: If the RSI is above the upper threshold and the closing price is above the upper Bollinger Band, or if the RSI is below the lower threshold and the closing price is below the lower Bollinger Band.
Green (#4caf50): If the RSI is above the upper threshold but the closing price is not above the upper Bollinger Band.
Light Green (#a5d6a7): If the histogram is positive and the RSI is not above the upper threshold.
Red (#f23645): If the RSI is below the lower threshold but the closing price is not below the lower Bollinger Band.
Light Red (#faa1a4): If the histogram is negative and the RSI is not below the lower threshold.
Inputs
Bollinger Bands Settings
Length: The number of periods for the moving average.
Basis MA Type: The type of moving average (SMA, EMA, SMMA, WMA, VWMA).
Source: The price source for the Bollinger Bands calculation.
StdDev: The multiplier for the standard deviation.
RSI Settings
RSI Length: The number of periods for the RSI calculation.
RSI Upper: The upper threshold for the RSI.
RSI Lower: The lower threshold for the RSI.
Source: The price source for the RSI calculation.
MACD Settings
Fast Length: The length for the fast moving average.
Slow Length: The length for the slow moving average.
Signal Smoothing: The length for the signal line smoothing.
Oscillator MA Type: The type of moving average for the MACD calculation.
Signal Line MA Type: The type of moving average for the signal line.
Usage
This indicator is suitable for various trading strategies, including day trading, swing trading, and long-term investing.
Traders can use the MACD histogram to identify potential buy and sell signals, while the RSI can help confirm overbought or oversold conditions.
The Bollinger Bands provide context for price volatility and potential breakout or reversal points.
Example:
From the example, it can clearly see that the Selling Climax and Buying Climax, marked as orange circle when a black histogram occurs.
Conclusion
The MACD + RSI + Bollinger Bands Indicator is a versatile tool that combines multiple technical analysis methods to provide traders with a comprehensive view of market conditions. By utilizing this script, traders can enhance their analysis and improve their decision-making process.

Enhanced Market Analyzer with Adaptive Cognitive LearningThe "Enhanced Market Analyzer with Advanced Features and Adaptive Cognitive Learning" is an advanced, multi-dimensional trading indicator that leverages sophisticated algorithms to analyze market trends and generate predictive trading signals. This indicator is designed to merge traditional technical analysis with modern machine learning techniques, incorporating features such as adaptive learning, Monte Carlo simulations, and probabilistic modeling. It is ideal for traders who seek deeper market insights, adaptive strategies, and reliable buy/sell signals.
Key Features:
Adaptive Cognitive Learning:
Utilizes Monte Carlo simulations, reinforcement learning, and memory feedback to adapt to changing market conditions.
Adjusts the weighting and learning rate of signals dynamically to optimize predictions based on historical and real-time data.
Hybrid Technical Indicators:
Custom RSI Calculation: An RSI that adapts its length based on recursive learning and error adjustments, making it responsive to varying market conditions.
VIDYA with CMO Smoothing: An advanced moving average that incorporates Chander Momentum Oscillator for adaptive smoothing.
Hamming Windowed VWMA: A volume-weighted moving average that applies a Hamming window for smoother calculations.
FRAMA: A fractal adaptive moving average that responds dynamically to price movements.
Advanced Statistical Analysis:
Skewness and Kurtosis: Provides insights into the distribution and potential risk of market trends.
Z-Score Calculations: Identifies extreme market conditions and adjusts trading thresholds dynamically.
Probabilistic Monte Carlo Simulation:
Runs thousands of simulations to assess potential price movements based on momentum, volatility, and volume factors.
Integrates the results into a probabilistic signal that informs trading decisions.
Feature Extraction:
Calculates a variety of market metrics, including price change, momentum, volatility, volume change, and ATR.
Normalizes and adapts these features for use in machine learning algorithms, enhancing signal accuracy.
Ensemble Learning:
Combines signals from different technical indicators, such as RSI, MACD, Bollinger Bands, Stochastic Oscillator, and statistical features.
Weights each signal based on cumulative performance and learning feedback to create a robust ensemble signal.
Recursive Memory and Feedback:
Stores and averages past RSI calculations in a memory array to provide historical context and improve future predictions.
Adaptive memory factor adjusts the influence of past data based on current market conditions.
Multi-Factor Dynamic Length Calculation:
Determines the length of moving averages based on volume, volatility, momentum, and rate of change (ROC).
Adapts to various market conditions, ensuring that the indicator is responsive to both high and low volatility environments.
Adaptive Learning Rate:
The learning rate can be adjusted based on market volatility, allowing the system to adapt its speed of learning and sensitivity to changes.
Enhances the system's ability to react to different market regimes.
Monte Carlo Simulation Engine:
Simulates thousands of random outcomes to model potential future price movements.
Weights and aggregates these simulations to produce a final probabilistic signal, providing a comprehensive risk assessment.
RSI with Dynamic Adjustments:
The initial RSI length is adjusted recursively based on calculated errors between true RSI and predicted RSI.
The adaptive RSI calculation ensures that the indicator remains effective across various market phases.
Hybrid Moving Averages:
Short-Term and Long-Term Averages: Combines FRAMA, VIDYA, and Hamming VWMA with specific weights for a unique hybrid moving average.
Weighted Gradient: Applies a color gradient to indicate trend strength and direction, improving visual clarity.
Signal Generation:
Generates buy and sell signals based on the ensemble model and multi-factor analysis.
Uses percentile-based thresholds to determine overbought and oversold conditions, factoring in historical data for context.
Optional settings to enable adaptation to volume and volatility, ensuring the indicator remains effective under different market conditions.
Monte Carlo and Learning Parameters:
Users can customize the number of Monte Carlo simulations, learning rate, memory factor, and reward decay for tailored performance.
Applications:
Scalping and Day Trading:
The fast response of the adaptive RSI and ensemble learning model makes this indicator suitable for short-term trading strategies.
Swing Trading:
The combination of long-term moving averages and probabilistic models provides reliable signals for medium-term trends.
Volatility Analysis:
The ATR, Bollinger Bands, and adaptive moving averages offer insights into market volatility, helping traders adjust their strategies accordingly.
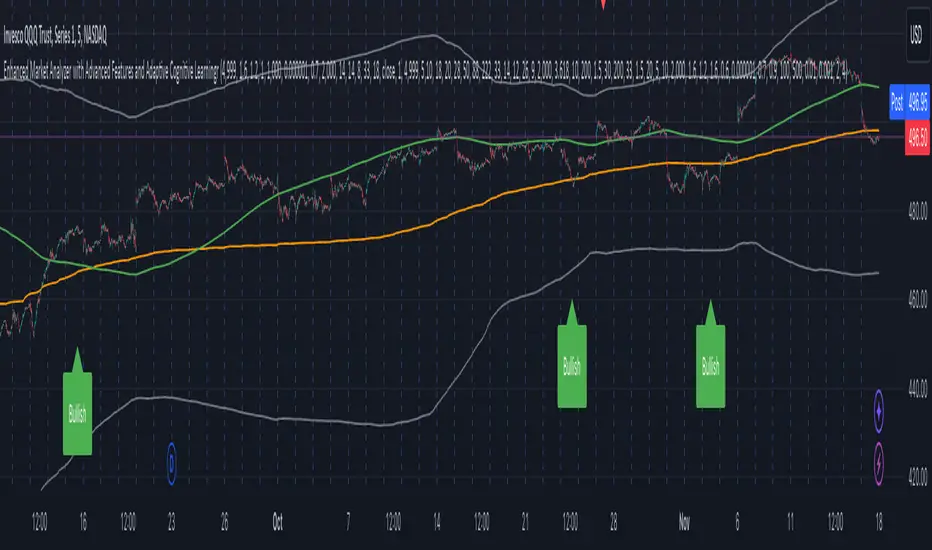
Rainbow EMA Areas with Volatility HighlightThe indicator provides traders with an enhanced visual tool to observe price movements, trend strength, and market volatility on their charts. It combines multiple EMAs (Exponential Moving Averages) with color-coded areas to indicate the market’s directional bias and a high-volatility highlight for detecting times of increased market activity.
Explanation of Key Components
Multiple EMAs (Exponential Moving Averages):
Six different EMAs are calculated for various periods (15, 45, 100, 150, 200, 300).
Each EMA period represents a different timeframe, from short-term to long-term trends, providing a well-rounded view of price behavior across different market cycles.
The EMAs are color-coded for easy differentiation:
Green shades indicate bullish trends when prices are above the EMAs.
Red shades indicate bearish trends when prices are below the EMAs.
The space between each EMA is filled with a gradient color, creating a "wave" effect that helps identify the market’s overall direction.
ATR-Based Volatility Detection:
The ATR (Average True Range), a measure of market volatility, is used to assess how much the price is fluctuating. When volatility is high, price movements are typically more significant, indicating potential trading opportunities or times to exercise caution.
The indicator calculates ATR and uses a customizable multiplier to set a high-volatility threshold.
When the ATR exceeds this threshold, it signals that the market is experiencing high volatility.
Visual High Volatility Highlight:
A yellow background appears on the chart during periods of high volatility, giving a subtle but clear visual indication that the market is active.
This highlight helps traders spot potential breakout areas or increased activity zones without obstructing the EMA areas.
Volatility Signal Markers:
Small, red triangular markers are plotted above price bars when high volatility is detected, marking these areas for additional emphasis.
These signals serve as alerts to help traders quickly recognize high volatility moments where price moves may be stronger.
How to Use This Indicator
Identify Trends Using EMA Areas:
Bullish Trend: When the price is above most or all EMAs, and the EMA areas are colored in shades of green, it indicates a strong bullish trend. Traders might look for buy opportunities in this scenario.
Bearish Trend: When the price is below most or all EMAs, and the EMA areas are colored in shades of red, it signals a bearish trend. This condition can suggest potential sell opportunities.
Consolidation or Neutral Trend: If the price is moving within the EMA bands without a clear green or red dominance, the market may be in a consolidation phase. This period often precedes a breakout in either direction.
Volatility-Based Entries and Exits:
High Volatility Areas: The yellow background and red triangular markers signal high-volatility areas. This information can be valuable for identifying potential breakout points or strong moves.
Trading in High Volatility: During high-volatility phases, the market may experience rapid price changes, which can be ideal for breakout trades. However, high volatility also involves higher risk, so traders may adjust their strategies accordingly (e.g., setting wider stops or adjusting position sizes).
Trading in Low Volatility: When the yellow background and markers are absent, volatility is lower, indicating a calmer market. In these times, traders may choose to look for range-bound trading opportunities or wait for the next trend to develop.
Combining with Other Indicators:
This indicator works well in combination with momentum or oscillating indicators like RSI or MACD, providing a well-rounded view of the market.
For example, if the indicator shows a bullish EMA area with high volatility, and an RSI is trending up, it could be a stronger buy signal. Conversely, if the indicator shows a bearish EMA area with high volatility and RSI is trending down, this could be a stronger sell signal.
Practical Trading Examples
Bullish Trend in High Volatility:
Price is above the EMAs, showing green EMA areas, and the high volatility background is active.
This indicates a strong bullish trend with significant price movement potential.
A trader could look for breakout or continuation entries in the direction of the trend.
Bearish Reversal Signal:
Price crosses below the EMAs, showing red EMA areas, while high volatility is also detected.
This suggests that the market may be reversing to a bearish trend with increased price movement.
Traders could consider taking short positions or setting stops on existing long trades.
This indicator is designed to provide a rich visual experience, making it easy to spot trends, consolidations, and volatility zones at a glance. It is best used by traders who benefit from visual cues and who seek a quick understanding of both trend direction and market activity. Let me know if you'd like further customization or additional functionalities!
