ICT Sweep + CHoCH + FVG Alerts
### 🔥 ICT Sweep + CHoCH + FVG Alerts
Script designed to automate ICT entry confirmations using:
• Liquidity Sweep (Buy/Sell Stops taken)
• Change of Character (CHoCH)
• Fair Value Gap (FVG) confirmation
### ✅ Conditions
**Long signal when:**
1. Bearish liquidity sweep
2. Bullish CHoCH
3. Bullish FVG forms and gets respected
**Short signal when:**
1. Bullish liquidity sweep
2. Bearish CHoCH
3. Bearish FVG forms and gets respected
### 🎯 Purpose
This script helps traders detect smart-money setup entries based on ICT logic and receive alerts in real time.
### 📡 Alerts
Supports webhook automation for bots, signal servers, or trading platforms.
*This script does not place trades automatically, alerts only.*
### ⚠️ Disclaimer
This tool is for educational purposes.
Always backtest and use proper risk management.
Wyszukaj w skryptach "ict"
ICT Sweep + FVG Entry (v6) • Pro Pack 📌 ICT Sweep + FVG Entry Pro Pack
This indicator combines key ICT price action concepts with practical execution tools to help traders spot high-probability setups faster and more objectively. It’s designed for scalpers and intraday traders who want to keep their chart clean but never miss critical market structure events.
🔑 Features
Liquidity Pools (HTF)
• Auto-detects recent swing highs/lows from higher timeframes (5m/15m).
• Draws both lines and optional rectangles/zones for clear liquidity areas.
Liquidity Sweeps (BSL/SSL)
• Identifies when price sweeps above/below liquidity pools and rejects back.
• Optional Grade-A sweep filter (wick size + strong re-entry).
Fair Value Gaps (FVGs)
• Highlights bullish/bearish imbalances.
• Optional midline (50%) entry for precision.
• Auto-invalidation when price fully closes inside the gap.
Killzones (New York)
• Highlights AM (9:30–11:30) and PM (14:00–15:30) killzones.
• Option to block signals outside killzones for higher strike rate.
Bias Badge (DR50)
• Displays if price is trading in a Bull, Bear, or Range context based on displacement range midpoint.
SMT Assist (NQ vs ES)
• Detects simple divergences between indices:
Bearish SMT → NQ makes HH while ES doesn’t.
Bullish SMT → NQ makes LL while ES doesn’t.
SL/TP Helper & R:R Label
• Automatically draws stop loss (at sweep extreme) and target (opposite pool or recent swing).
• Displays expected Risk:Reward ratio and blocks entries if below your chosen minimum.
Filters
• ATR filter ensures signals only appear in sufficient volatility.
• Sweep quality filter avoids weak wicks and fake-outs.
🎯 How to Use
Start on HTF (5m/15m) → Identify liquidity zones and bias.
Drop to LTF (1m) → Wait for a liquidity sweep confirmation.
Check for FVG in the sweep’s direction → Look for retest entry.
Use the SL/TP helper to validate your risk/reward before taking the trade.
Focus entries during NY Killzones for maximum effectiveness.
✅ Why this helps
This tool reduces screen time and hesitation by automating repetitive ICT concepts:
Liquidity pools, sweeps, and FVGs are marked automatically.
Killzone timing and SMT divergence are simplified.
Clear visual signals for entries with built-in RR filter help keep your trading mechanical.
⚠️ Disclaimer: This script is for educational purposes only. It does not provide financial advice or guarantee results. Always use proper risk management.

ICT Sweep + FVG Entry (v6) • Antoine📌 ICT Sweep + FVG Entry (Antoine)
This indicator is designed for price action traders who follow ICT concepts and want a mechanical tool to spot liquidity sweeps, fair value gaps (FVGs), and precise entry signals.
🔎 Key Features
Liquidity Pools (HTF)
• Automatically plots recent swing highs/lows from a higher timeframe (5m/15m).
• These act as Buy Side Liquidity (BSL) and Sell Side Liquidity (SSL) levels where stop orders accumulate.
Sweep Detection
• Identifies when price breaks a pool (BSL/SSL) but closes back inside → a classic liquidity grab.
• Plots a triangle on the chart when a sweep is confirmed.
Fair Value Gap (FVG) Highlighting
• Detects bullish and bearish FVGs on the execution timeframe (ideal for 1m).
• Option to display active FVG zones with shaded boxes.
Entry Signals
• A signal (cross) appears when:
A liquidity sweep occurs.
An FVG forms in the direction of the rejection.
Price retests the FVG (entry at the 50% mid-level or edge).
Alerts Ready
• Get alerted for sweeps (bullish/bearish) and for entry confirmations (long/short FVG retests).
🎯 How to Use
Choose your HTF (5m or 15m) → The indicator maps major liquidity pools.
Drop to LTF (1m) → Wait for a sweep signal at one of the pools.
Confirm with FVG → If an FVG appears in the sweep’s direction, the indicator waits for a retest.
Entry → Enter on the retest of the FVG (edge or 50%).
Risk Management
Stop loss: just beyond the sweep’s wick.
Target: opposite liquidity pool.
Minimum recommended R:R: 1:2.
✅ Why this helps
This tool makes it easier to trade ICT-style setups without missing opportunities:
No need to manually draw every swing high/low.
Automatic FVG detection saves time.
Clear sweep + FVG + retest logic keeps your entries mechanical and disciplined.
⚠️ Disclaimer: This script is for educational purposes only. It does not guarantee profits. Always use proper risk management.

ICT Silver Bullet Zones (All Sessions)This Pine Script v6 indicator highlights the ICT Silver Bullet windows (10:00–11:00 local time) for all major forex/trading sessions: London, New York AM, New York PM, and Asia.
✅ Features:
Clearly visualizes Silver Bullet zones for each session.
Labels are centered inside each zone for easy identification.
Fully compatible with Pine Script v6 and TradingView.
Adjustable opacity and label size for better chart visibility.
Works on any timeframe and keeps historical zones visible.
Use Case:
Perfect for ICT strategy traders who want to identify high-probability trading windows during major market sessions. Helps in planning entries and understanding liquidity timing without cluttering the chart.
Instructions:
Add the script to your TradingView chart.
Adjust opacity and label size to suit your chart style.
Observe the SB zones for all sessions and plan trades according to ICT methodology.

ICT Directional FVG Indicator (Buffered SL)This is the first indicator I have ever made, and I am very new to Pine Script. I’ve tried my best to create this as a strategy, but I’m still learning, so please be kind and constructive with your feedback!
ICT Directional FVG Indicator (Buffered SL)
This indicator is designed for traders who follow ICT (Inner Circle Trader) concepts, focusing on Fair Value Gaps (FVGs), liquidity sweeps, and session-based trading. It automatically detects bullish and bearish FVGs, highlights them on the chart, and identifies liquidity sweep events. The indicator features three customizable Kill Zones (London, New York, and Asia sessions), each with independent toggles and color-coded backgrounds for clear visual separation.
Key features:
Fair Value Gap Detection: Highlights bullish and bearish FVGs in real time.
Liquidity Sweep Alerts: Marks potential liquidity sweep events for both highs and lows.
Session Kill Zones: Toggle each Kill Zone (London, New York, Asia) independently; background color changes only in enabled zones.
Trade Signal Visualization: Plots entry, stop loss, and take profit levels based on FVG and sweep logic, with a user-defined stop loss buffer.
Customizable Display: Easily enable or disable FVGs, sweeps, trade levels, and each Kill Zone to suit your strategy.
This tool is ideal for ICT-based traders who want a clear, automated view of FVGs, sweeps, and session activity, with full control over which sessions and signals are displayed.

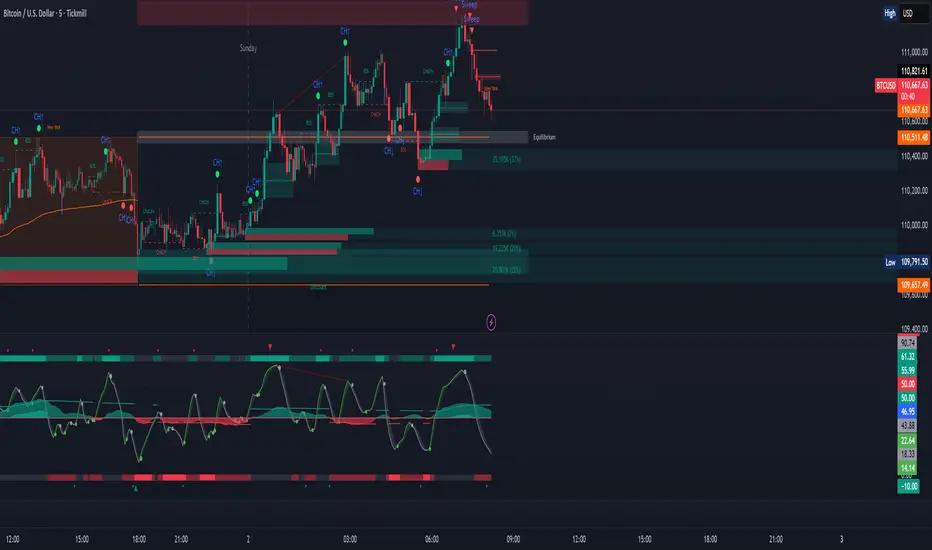
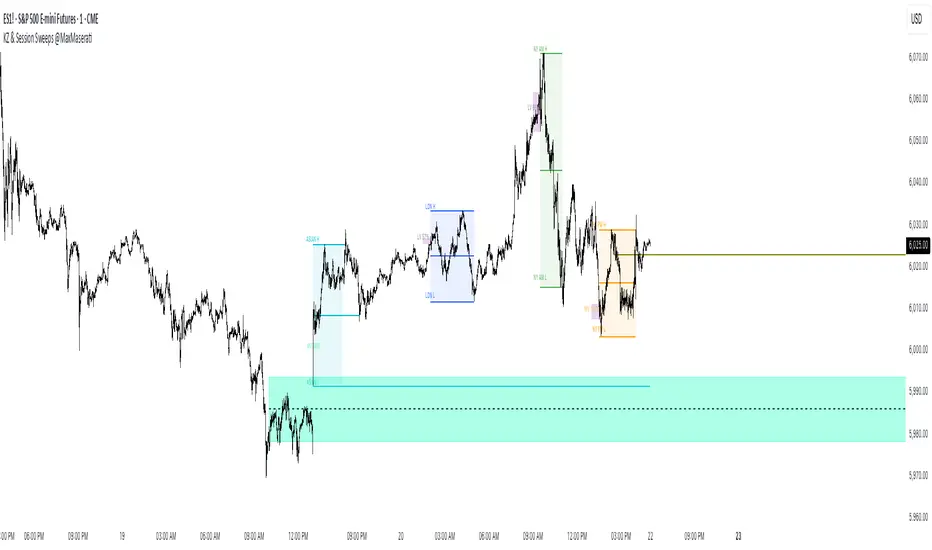
ICT Killzones Bias & Volume Sweeps @MaxMaserati📌 Overview
This indicator helps traders identify key ICT Killzones (Asian, London, NY AM, NY PM sessions) along with volume analysis and sweep detection. It highlights institutional order blocks, tracks session bias, and detects liquidity sweeps with volume confirmation.
Key Features:
✅ ICT Killzones (Asian, London, NY AM, NY PM)
✅ Volume Analysis (High/Low volume detection)
✅ Sweep Detection (Buyside/Sellside sweeps with volume confirmation)
✅ Session Bias (Bullish/Bearish bias based on price action)
✅ Customizable Sessions (Add personal trading hours)
✅ Institutional Order Build-up (30-min pre-session accumulation zones)
⚙️ Input Settings
1. Timezone Settings
Chart Timezone: Adjust to your local timezone (default: New York).
2. Session Toggles
Asian / London / NY AM / NY PM Sessions: Enable/disable each session.
NY Lunch Session: Optional session (disabled by default).
Personal Trading Time: Customize your trading hours.
3. Label Settings
Label Size: Tiny, Small, Normal, Large.
Session Labels: Customize text for High (H), Low (L), Mid (M) labels.
Background Transparency: Adjust session box opacity.
4. Volume Analysis
Show Volume Labels: Displays volume strength (🚀 Very High, 🔥 High, ⚖️ Normal, 💤 Low, 🐢 Very Low).
Volume Lookback Period: Adjusts volume comparison window.
High/Low Volume Thresholds: Define what constitutes high/low volume.
5. Sweep Detection
Buyside/Sellside Sweeps: Highlights liquidity sweeps.
Sweep Margin: Adjust sensitivity for sweep detection.
Fake Sweep Zones: Option to hide or highlight fakeouts.
Example of Session Sweep and Volume:
Here we have a Bullish Sweep of London Low session by NY AM
However, the volume was low suggesting buyers are not strong enough (M1)
And then the sellers took over and a pressure retest by the buyers of the level and then sellers entered with more power/pressure
6. Session Momentum & Bias
Show Session Bias: Indicates bullish/bearish bias for each session.
Bias Strength Threshold: Adjust sensitivity for bias detection.
📊 How It Works
1. Session Highs/Lows
The indicator tracks High, Low, and Mid prices for each session.
Lines and boxes are drawn to visualize the session range.
2. Volume Analysis
Compares current volume to historical average.
Displays volume strength with emojis (🚀, 🔥, ⚖️, 💤, 🐢).
Highlights high-volume sweeps for confirmation.
3. Sweep Detection
Detects buyside sweeps (liquidity above highs) and sellside sweeps (liquidity below lows).
Sweep zones expand if price lingers near the swept level.
4. 30 minute Pre-session Institutional order buildup
Highlights 30-minute pre-session zones where institutions may accumulate orders.
5. Session Bias
Calculates bias based on open/close price action within the session.
Displays Bullish, Bearish, or Neutral labels.
]
🎯 Trading Applications
1. Liquidity Sweeps
Look for sweeps with high volume as confirmation of institutional activity.
Fade fake sweeps (if enabled) when price reverses quickly.
2. Session Breakouts
Trade breakouts from Asian/London ranges during NY sessions.
Watch for volume expansion on breakouts for confirmation.
3. Pre- Session Institutional Block
Price often reacts to pre-session institutional position build-up (30-min before session opens).
LV:Low Volume, HV: High volume and MV: Medium Volume
NY AM Pre-Session institutional Order Build-up block with high sweep
🔧 Customization Tips
Adjust session times to normal future sessions to match your trading style.
Modify sweep sensitivity if too many/too few sweeps are detected.
Use volume thresholds to fine-tune high/low volume alerts.
📌 Final Notes
This indicator combines ICT concepts with volume analysis for a powerful trading edge. Use it alongside price action and market structure for best results at your own risk.
ICT Session by LasinsName: ICT Session by Lasins
Purpose: To visually identify and differentiate between the Asian, London, and New York trading sessions on the chart.
Features:
Highlights the background of the chart during each session.
Includes a mini dashboard in the top-right corner to show the active session.
Allows customization of time zones (exchange timezone or UTC).
Displays copyright and author information.
Key Components
Inputs:
useExchangeTimezone: A boolean input to toggle between using the exchange timezone or UTC for session times.
showDashboard: A boolean input to toggle the visibility of the mini dashboard.
Session Times:
The script defines three trading sessions:
Asian Session: 2000-0000 UTC (or adjusted for exchange timezone).
London Session: 0200-0500 UTC (or adjusted for exchange timezone).
New York Session: 0700-1000 UTC (or adjusted for exchange timezone).
Session Detection:
The is_session function checks if the current time falls within a specified session using the time function.
Background Coloring:
The bgcolor function is used to highlight the chart background during each session:
Asian Session: Red background.
London Session: Green background.
New York Session: Blue background.
Mini Dashboard:
A table is created in the top-right corner of the chart to display the active session and its corresponding color.
The dashboard includes:
A header row with "Session" and "Color".
Rows for each session (Asian, London, New York) with their respective colors.
Copyright and Author Information:
A label is added to the chart to display the copyright and author information ("© ICT Session by Lasins Raj").
How It Works
The script checks the current time and compares it to the predefined session times.
If the current time falls within a session, the chart background is highlighted with the corresponding color.
The mini dashboard updates to reflect the active session.
The copyright and author information is displayed at the bottom of the chart.
Customization
You can adjust the session times in the script to match your preferred timezone or trading hours.
The useExchangeTimezone input allows you to switch between UTC and the exchange timezone.
The showDashboard input lets you toggle the visibility of the mini dashboard.
Example Use Case
Traders who follow the ICT (Inner Circle Trader) methodology can use this indicator to identify key trading sessions and plan their trades accordingly.
The visual representation of sessions helps traders quickly recognize when major markets are open and active.

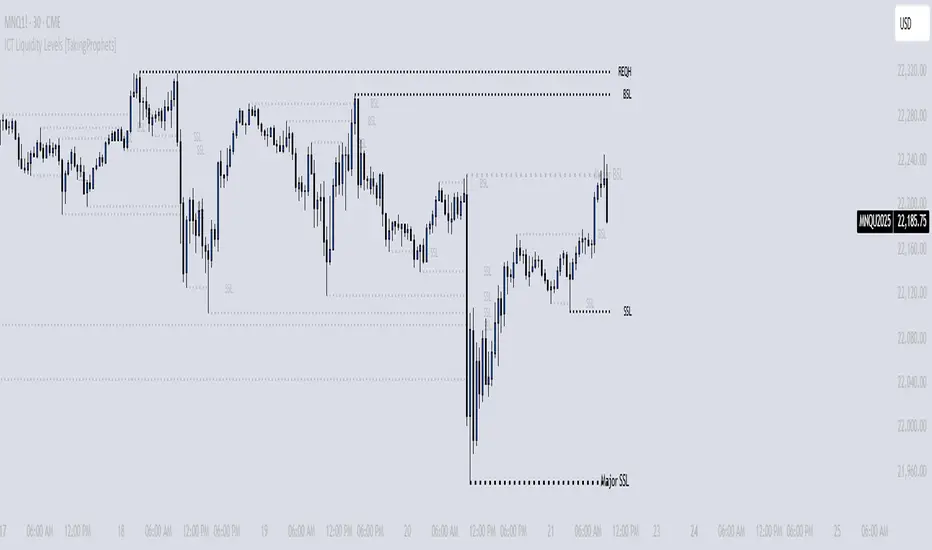
ICT Liquidity Levels [TakingProphets]Overview
This indicator is designed to dynamically identify and display key liquidity levels—areas where market participants are likely to engage. By analyzing price swing points, it highlights potential support and resistance zones that can signal reversals or breakouts. The script distinguishes between buyside and sellside liquidity levels, presenting them with customizable visual cues and labels for immediate clarity.
How It Works
Swing Point Detection:
The indicator uses a pivot-based method (with a configurable “Base Swing Strength”) to detect swing highs and lows. Each detected swing is evaluated for its “swing size” (percentage price movement), and if it exceeds a user-defined threshold, the level is classified as major.
Level Creation and Classification:
Overview
Built on core ICT principles, this indicator identifies key liquidity zones—areas where market imbalances can lead to liquidity sweeps. By dynamically analyzing swing points, it offers traders a real-time view of where liquidity is clustering, allowing for a deeper understanding of market structure. 🚀
How It Works
Swing Point Detection 🔍
• Uses a pivot-based method with a configurable “Base Swing Strength” to detect significant price swings.
• Calculates the swing size (percentage change) to flag zones that exceed the “Major Level Threshold” as major liquidity zones.
Level Creation & Classification 🛠️
• Buyside Liquidity Levels (BSL):
Identified from swing highs, marking zones where buying liquidity clusters.
• Sellside Liquidity Levels (SSL):
Identified from swing lows, highlighting zones of concentrated selling liquidity.
• Each zone is stored with its price, bar index, and classification (major or standard) before being drawn as a horizontal line on the chart.
Dynamic Level Management 🔄
• Extension: Liquidity lines automatically extend from their detection point to the current bar.
• Consolidation: When levels are close in price, the script merges them—updating labels (e.g., “REQH” or “REQL”) to denote unified liquidity zones.
• Traded-Through Detection: Adjusts or removes levels if the market moves beyond them, based on your settings.
• Age-Based Cleanup: Inactive zones are automatically removed after a set number of bars to maintain clarity.
Customization Options ⚙️
Visual Settings:
• Choose from solid, dashed, or dotted line styles and adjust line width.
• Option to display labels with customizable placement (left or right) for optimal clarity.
Color & Opacity:
• Set distinct colors for buyside and sellside liquidity zones.
• Configure opacity for zones that have been traded through, keeping them visible yet de-emphasized.
Detection & Cleanup Parameters:
• Adjust “Base Swing Strength” to control pivot detection sensitivity.
• Set the “Major Level Threshold %” to filter for significant liquidity zones.
• Decide whether to retain or remove zones once price moves through them.
• Define how many bars should pass before inactive zones are automatically deleted.
How to Use 🚀
Apply the Indicator:
Simply add the script to your chart—it automatically detects and marks key liquidity zones based on recent price action.
Adjust Inputs:
Fine-tune parameters like swing strength, threshold percentages, and visual settings to match the asset’s characteristics and your trading strategy.
Interpret the Visuals:
• Major Liquidity Zones:
Highlighted with thicker lines and distinct labels (e.g., “Major BSL/SSL”), indicating areas of heightened liquidity concentration.
• Consolidated Zones:
Merged labels (e.g., “REQH/REQL”) denote unified liquidity zones where clustering is significant.
• Traded-Through Zones:
Changes in opacity signal that the market has moved beyond a previously identified liquidity zone.
Underlying ICT Concepts 💡
Liquidity Pools & Sweeps:
Focused on identifying where liquidity is concentrated, the indicator aligns with ICT methodologies that highlight zones crucial for liquidity sweeps.
Pivot Analysis for Liquidity:
Enhances traditional pivot detection to spotlight liquidity clusters, providing a deeper insight into market structure.
Real-Time Adaptation:
With continuous updates and built-in cleanup, the indicator ensures that liquidity zones accurately reflect current market conditions.
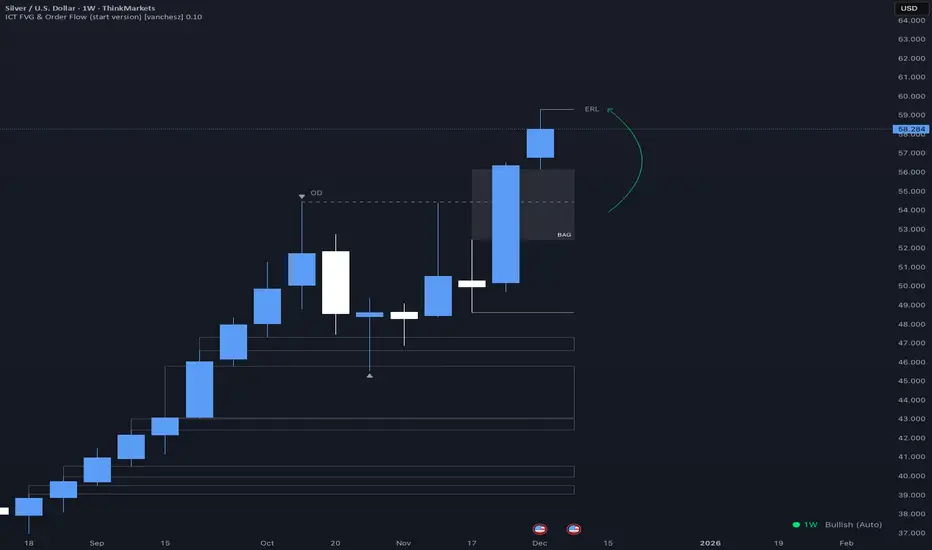
ICT FVG & Order Flow (start version) [vanchesz]Overview
Master liquidity with precision. This indicator brings the iCT trading concept to life by automatically detecting liquidity pools, fair value gaps, and key swing points. It shows you exactly where price is likely to move next — from Internal Range Liquidity (IRL) to External Range Liquidity (ERL). With built-in multi-timeframe validation, it helps you stay one step ahead of the market.
Concept
Markets move where liquidity is. According to iCT theory, price usually sweeps internal liquidity (IRL) first and then hunts for external liquidity (ERL). By mapping this process in real time, the indicator provides a clear framework for understanding market structure, liquidity grabs, and directional bias.
High Probability Leg
Context States
Key Features
Detects the High-Probability Leg (HPL) — the leg containing a fair value gap (FVG)
Highlights unmitigated FVGs within the current context.
Marks swing points (SP), IRL levels, and ERL targets automatically.
Identifies IRL rejections when liquidity is taken inside the leg
Multi-timeframe sweep check – if a single candle takes both IRL and ERL, the indicator zooms into a lower timeframe to confirm which liquidity was swept first
Flexible settings for swing points, look back bar count, depth, colors, and style
How to use
Start from the monthly chart to define the macro trend.
Analyze the latest order flow leg:
Bullish FVG = bullish context, Bearish FVG = bearish context
Step down to the daily timeframe and repeat the analysis.
Wait for price to reject from IRL (the indicator highlights it automatically).
Drop to a lower timeframe for entries — use timeframe alignment to select the right LTF.
Enter with the FVG model, targeting liquidity within the leg.
Place take profit inside the context — e.g., never above ERL(in a bullish setup).
Pro version gives you
Alerts for all context events (New context, New FVG, IRL rejection, Context failing by 2CR, ERL/SP sweep
Check of context failing by 2CR (two candle rejection)
Suggestions for every context state
This indicator is provided solely for educational and informational purposes.
It does not constitute financial advice, trading signals, or a recommendation to buy or sell any instrument.
ICT | SMC [Sky Eye] 體驗版12/15體驗版12/15
DC: discord.gg/8kE8XwmErc
輔助 SMC 位子畫線 幫助你加速學習
只需要知道這個位子是甚麼在去加強研究 ICT / SMC 即可
想學習更多可以到DC一起學習
DC: discord.gg/8kE8XwmErc
This tool helps you draw lines to indicate SMC positions, accelerating your learning.
You only need to know what each position represents before focusing your research on ICT/SMC.
To learn more, join us at DC.

ICT | SMC 工具箱 [Sky Eye]DC: discord.gg
輔助 SMC 位子畫線 幫助你加速學習
只需要知道這個位子是甚麼在去加強研究 ICT / SMC 即可
想學習更多可以到DC一起學習
DC: discord.gg
This tool helps you draw lines to indicate SMC positions, accelerating your learning.
You only need to know what each position represents before focusing your research on ICT/SMC.
To learn more, join us at DC.

ICT Key Levels: PDH / PDL / Daily Open//@version=5
indicator("ICT Key Levels: PDH / PDL / Daily Open", shorttitle="ICT Levels", overlay=true)
// --- Inputs
showPD = input.bool(true, "Mostrar PDH/PDL")
showOpen = input.bool(true, "Mostrar Daily Open")
pdhColor = input.color(color.new(color.green, 0), "Color PDH")
pdlColor = input.color(color.new(color.red, 0), "Color PDL")
openColor = input.color(color.new(color.orange, 0), "Color Daily Open")
lineWidth = input.int(1, "Ancho líneas", minval=1, maxval=4)
// --- Previous day high / low (using daily security)
pdh = request.security(syminfo.tickerid, "D", high )
pdl = request.security(syminfo.tickerid, "D", low )
// --- Daily open (current day's open on Daily timeframe)
dailyOpen = request.security(syminfo.tickerid, "D", open)
// --- Plots
plot(showPD and not na(pdh) ? pdh : na, title="PDH", color=pdhColor, linewidth=lineWidth, style=plot.style_line)
plot(showPD and not na(pdl) ? pdl : na, title="PDL", color=pdlColor, linewidth=lineWidth, style=plot.style_line)
plot(showOpen and not na(dailyOpen) ? dailyOpen : na, title="Daily Open", color=openColor, linewidth=lineWidth, style=plot.style_line)
// --- Optional: etiquetas en inicio de día (solo en la primera barra diaria)
isNewDay = ta.change(time("D"))
labelNewDayOpen = input.bool(true, "Mostrar etiqueta en apertura diaria")
if labelNewDayOpen and isNewDay
label.new(bar_index, dailyOpen, text="Open", style=label.style_label_down, color=color.new(openColor,50), textcolor=color.black, yloc=yloc.price)

ICT FVG & Order Flow (IRL to ERL)Overview
Master liquidity with precision. This indicator brings the iCT trading concept to life by automatically detecting liquidity pools, fair value gaps, and key swing points. It shows you exactly where price is likely to move next — from Internal Range Liquidity (IRL) to External Range Liquidity (ERL). With built-in alerts and multi-timeframe validation, it helps you stay one step ahead of the market.
Concept
Markets move where liquidity is. According to iCT theory, price usually sweeps internal liquidity (IRL) first and then hunts for external liquidity (ERL). By mapping this process in real time, the indicator provides a clear framework for understanding market structure, liquidity grabs, and directional bias.
How it works
Detects the High-Probability Leg (HPL) — the leg containing a fair value gap (FVG)
Highlights unmitigated FVGs within the current context.
Marks swing points (SPs), IRL levels, and ERL targets automatically.
Identifies IRL rejections when liquidity is taken inside the leg.
Identifies if a FVG is Respected or Disrespected by 2 Candle Rejection (2CR)
Notifies you of every critical liquidity event:
New context leg
New FVG
IRL rejection
ERL or SP liquidity sweep
FVG is Respected or Disrespected by 2CR
Key Features
Automatic drawing of IRL, ERL, and SP levels
FVG types: Simple FVG or Breakaway Gap (BAG)
Multi-timeframe sweep check – if a single candle takes both IRL and ERL, the indicator zooms into a lower timeframe to confirm which liquidity was swept first
Fully customizable alerts for all liquidity events
Flexible settings for swing points, lookback depth, colors, and style
How to use
Start from the monthly chart to define the macro trend.
Analyze the latest order flow leg:
Bullish FVG = bullish context
Bearish FVG = bearish context
Step down to the daily timeframe and repeat the analysis.
Wait for price to approach or reject from IRL (the indicator highlights it automatically).
Drop to a lower timeframe for entries — use timeframe alignment to select the right LTF.
Enter with the FVG model, targeting liquidity within the leg.
Place take profit inside the context — e.g., never above ERL in a bullish setup.
🔔 Alerts
New Context
New FVG
IRL Rejection
ERL Sweep
SP Sweep
2CR
⚙️ Customization
Context side (auto/manual)
LTF pointer (auto/manual)
Show/hide Resistance FVG, Overlapping Defense, ERL/SP sweeps, 2CR
Look back bars, swing lines, swing length, line offsets
* Full color customization (FVG, bullish/bearish, labels, boxes)

ICT Levels Breach Scanner (12M Timeframe)Detects and scans for breaches of key Inner Circle Trader (ICT) concepts on the yearly (12M) chart: Swing Lows (3-bar wick pivots), Rejection Blocks (3-bar body pivots), Fair Value Gaps (3-bar inefficiencies), and Volume Imbalances (bullish body gaps ≥0.15%, unmitigated).
Features:
Tracks active levels with arrays for real-time breach detection (price low below any level triggers alert).
Visuals: Blue solid lines (Swing Lows), orange dashed (Rejection Blocks), purple dotted (FVGs), green boxes (VIs)—all extending right.
Red triangle + bgcolor alert on breach bar; built-in alertcondition for notifications.
Optimized for Pine Screener: Filter stocks (e.g., US exchanges) showing symbols where price has traded below these levels on the latest 12M bar.
Usage: Apply to a 12M chart for viz, or add to Screener > Pine tab for multi-symbol scans. Customize gap % or add bearish variants via inputs. Ideal for spotting potential support in long-term trends.
ICT-inspired; test on liquid stocks like AAPL/TSLA. Not financial advice.

ICT Suspension BlocksICT Suspension Block (SB) Indicator
The ICT Suspension Block (SB) is a three-candle price action pattern that often act as support or resistance zones. A Suspension Block is a three-candle pattern showing a brief pause in price efficiency before continuation. These zones frequently serve as areas where price may later return, offering traders potential trading opportunities.
Pattern Definition
A Suspension Block forms when three consecutive candles move in the same direction but leave behind a specific body-to-body imbalance. (a gap between the bodies of consecutive candles).
Bullish Suspension Block (+SB):
All three candles are bullish (close > open).
Candle 1 close < Candle 2 open.
Candle 2 close < Candle 3 open.
Zone = from Candle 1 close to Candle 3 open.
Bearish Suspension Block (-SB):
All three candles are bearish (close < open).
Candle 1 close > Candle 2 open.
Candle 2 close > Candle 3 open.
Zone = from Candle 1 close to Candle 3 open.
These zones mark areas where price was temporarily imbalanced. Price often “respects” these levels later, either bouncing from them or breaking through them, which can provide valuable trade context.
Application
Suspension Blocks are used to mark areas where price may later react:
A Bullish SB can act as potential support.
A Bearish SB can act as potential resistance.
The significance of a block depends on market context. Blocks formed during strong, impulsive moves tend to be more meaningful than those in consolidation.
How the Indicator Works
Identifies bullish and bearish suspension blocks using body gap imbalances.
Draws colored zones (green = bullish, red = bearish) directly on the chart.
Extends zones forward until they are inversed by price action.
Once inversed, zones switch to a neutral color, allowing traders to annotate/extend them manually if desired.
Includes Consequent Encroachment (CE) lines (the 50% equilibrium of the block), which many traders use as reaction levels.
Features
Customizable colors for bullish, bearish, and inversed zones
Extend blocks indefinitely forward or limit them to a set number of bars
Adjustable maximum number of displayed blocks for performance control
Consequent Encroachment (CE) (Middle Point, 50%, Equilibrium) line feature
Configurable CE line style, color, and width
How to Use It
Trend Following: Blocks forming in the direction of trend can act as continuation zones.
Reversals: Opposite-direction blocks may signal exhaustion and potential turning points.
Liquidity Levels: CE lines (50% of block) often serve as reaction levels for entries, partials, or stop placement.
Context is Key: Suspension Blocks should not be used in isolation. Combine them with market structure, liquidity pools, or other confluence factors for best results.
Notes
This indicator is intended for technical analysis and research.
It should always be combined with proper risk management and a complete trading plan.
Past market behavior does not guarantee future results.
ICT SMC — OB & FVG (Enhanced v6)This indicator is a comprehensive implementation of ICT Smart Money Concepts (SMC), focusing on Order Blocks (OB) and Fair Value Gaps (FVG) with enhanced detection logic and session-based filtering.
🔍 Key Features
Impulse-Based OB Detection: Identifies bullish and bearish order blocks using configurable impulse bar logic and ATR-based movement thresholds.
Fair Value Gap Detection: Highlights FVGs based on price displacement logic, helping traders spot potential inefficiencies in price action.
Session Filtering: Allows users to filter signals based on major trading sessions (Sydney, Tokyo, London, New York).
Trend & Volume Confirmation: Integrates EMA slope, market structure breaks, and volume analysis to score trade signals.
Visual Zones: Displays OB and FVG zones using colored boxes with customizable transparency and color settings.
Signal Alerts: Generates long/short trade signals based on a scoring system and session validation, with built-in alert conditions.
⚙️ Customization
Adjustable EMA and ATR lengths
Configurable impulse bar count and movement thresholds
Toggleable session filters
Custom colors for OB and FVG zones
📈 Use Cases
This tool is ideal for traders who follow ICT concepts and want a visual, automated way to identify high-probability zones and trade setups based on smart money principles.

ICT 369 Sniper MSS Indicator (HTF Bias) - H2LThis script is an ICT (Inner Circle Trader) concept-based trading indicator designed to identify high-probability reversal or continuation setups, primarily focusing on intraday trading using a Higher Timeframe (HTF) directional bias.
Here are the four core components of the indicator:
Higher Timeframe (HTF) Bias Filter (Market Structure Shift - MSS): It determines the overall trend by checking if the current price has broken the most recent high or low swing point of a larger timeframe (e.g., 4H). This establishes a Bullish or Bearish bias, ensuring trades align with the dominant trend.
Fair Value Gap (FVG) and OTE: It identifies price imbalances (FVGs) and calculates the Optimal Trade Entry (OTE) levels (50%, 62%, 70.5%, etc.) within those gaps, looking for price to retrace into these specific areas.
Kill Zones (Timing): It incorporates specific time windows (London and New York Kill Zones, based on NY Time) where institutional trading activity is high, only allowing entry signals during these defined periods.
Signal and Targets: It triggers a Long or Short signal when all criteria are met (HTF Bias, FVG, OTE retracement, and Kill Zone timing). It then calculates and plots suggested trade levels, including a Stop Loss (SL) and three Take Profit targets (TP1, TP2, and a dynamic Runner Target based on the weekly Average True Range or ATR).
In summary, it's a comprehensive tool for traders following ICT principles, automating the confluence check across trend, structure, liquidity, and timing.

ICT SMC ToolKit By VIPIN | High Volume OB + BOS, CHoCH, FVG📌 ICT Smart Money Concepts (SMC) Toolkit
This indicator provides traders with a complete Smart Money Concepts (SMC) framework inside a single tool. It helps to visualize institutional trading footprints and market structure shifts more effectively without the need to combine multiple separate indicators.
---
🔹 Key Features
1. **Order Blocks (OB):**
- Automatically detects bullish and bearish order blocks.
- Helps traders identify institutional buying/selling zones where large players may be active.
- Volume filters included for more accurate signals.
2. **Break of Structure (BOS):**
- Marks market structure breaks that indicate continuation of the trend.
- Useful for identifying trend direction and confirming order flow.
3. **Change of Character (CHoCH):**
- Highlights early signs of market reversals.
- Shows when price transitions from bullish to bearish order flow (or vice versa).
4. **Fair Value Gaps (FVG):**
- Automatically draws zones of price imbalance.
- Traders can use these zones as possible retracement or entry levels.
- Helps to spot areas where price may return to "rebalance".
5. **Liquidity Sweeps:**
- Identifies liquidity grabs around recent highs and lows.
- Useful for spotting stop hunts and smart money manipulation before reversals.
6. **Custom Presets & Filters:**
- Users can toggle between OB-only, FVG-only, Sweep-only, or full SMC mode.
- Multiple color settings available for clear chart visualization.
---
🎯 Purpose of the Script
- Brings all major SMC tools (OB, BOS, CHoCH, FVG, Liquidity Sweep) together in one indicator.
- Reduces the need for multiple overlapping indicators.
- Helps traders simplify their workflow and keep charts clean.
- Focused on education, analysis, and market structure visualization.
---
⚠️ Disclaimer
This script is intended **for educational and analytical purposes only**.
It does not provide financial advice, trade recommendations, or guaranteed profits.
Traders should always manage their own risk and confirm setups with additional confluences.
---
ℹ️ Notes for Users
- This indicator works on multiple timeframes and instruments (Forex, Commodities, Indices, Crypto).
- Best used with a strong understanding of Smart Money Concepts (SMC) and ICT methodology.
- Combining this tool with your own analysis will provide the best results.

ICT Silver Bullet Zones (All Sessions, Custom Labels)CT Silver Bullet Zones
This indicator is designed for traders who follow the ICT *Silver Bullet* concept.
It automatically marks the **Silver Bullet window** (10:00–11:00 by default) across the **London, New York AM, New York PM, and Asia sessions**, with customizable settings for each session.
### Features:
* Separate adjustable time windows for **London, NY AM, NY PM, and Asia Silver Bullet sessions**.
* Colored session boxes with individual **opacity controls**.
* **Session labels placed at the top** of each zone, with customizable text size, color, and background opacity.
* Works on all timeframes and highlights only the Silver Bullet trading windows.
This tool is meant to help traders quickly identify ICT Silver Bullet opportunities in all major sessions without manual plotting.

ICT KEY LEVELS (L3J)📊 Overview
The ICT KEY LEVELS (L3J) indicator is a tool designed to automatically identify and display key levels based on Inner Circle Trader (ICT) concepts.
This indicator combines session-based levels with multi-timeframe highs/lows analysis to provide traders with critical price zones for decision-making.
Developed by L3J - This indicator can be used in conjunction with other indicators I have developed for enhanced market analysis.
🎯 Key Features
Session-Based Levels
- Previous Day High/Low (PDH/PDL): Automatically identifies and displays the previous trading day's high and low levels
- Asian Session Levels: Tracks high and low during Asian trading hours (20:00-03:00 GMT+4)
- European Session Levels: Captures London session high and low levels (03:00-08:30 GMT+4)
Multi-Timeframe Analysis
- H1 Pivot Levels: Identifies 2-candle reversal patterns on 1-hour timeframe
- H4 Pivot Levels: Detects 4-hour pivot points using advanced pattern recognition
- Smart Visibility: Levels are only shown on appropriate timeframes (H1 levels on H1, H4 levels on H4)
Advanced Features
- Priority System: Automatically hides overlapping levels based on importance (Previous Day > Sessions > H4 > H1)
- Dynamic Labels: Real-time labels that update with price action
- Intelligent Cleanup: Removes crossed or outdated levels to maintain chart clarity
- Customizable Anchoring: Choose between precise timestamp anchoring or candle middle anchoring
- Performance Optimized: Built with efficient code structure for smooth chart performance
⚙️ Configuration Options
Note: Currently, the user interface settings are displayed in French. This will be updated to English in a future version.
General Settings
- Timezone: Configurable timezone for session calculations (default: GMT+4)
- Trading Days: Number of trading days to analyze (1-20 days)
- Extension: Right extension length for level lines
- Anchoring Mode: Precise timestamp or candle middle anchoring
Visual Customization
Each level type (Asia, Europe, Previous Day, H1, H4) includes:
- Color Selection: Separate colors for highs and lows
- Line Styles: Solid, Dotted, or Dashed lines
- Line Width: Adjustable thickness (1-4 pixels)
- Show/Hide Toggle: Individual control for each level type
🕒 Session Times
- Trading Day: 18:00-16:00 (CME session)
- Asian Session: 20:00-03:00 GMT+4
- European Session: 03:00-08:30 GMT+4
All times are configurable and timezone-aware
📈 How It Works
Level Detection
1. Session Levels: Continuously tracks price action during specific trading sessions
2. Pivot Detection: Uses 2-candle reversal patterns (bullish then bearish for highs, bearish then bullish for lows)
3. Multi-Timeframe Data: Requests higher timeframe data for H1 and H4 analysis
Smart Management
- Automatic Cleanup: Removes levels that have been crossed or are too old
- Priority Filtering: Hides duplicate levels based on importance hierarchy
- Dynamic Updates: Real-time adjustment of level positions and labels
🎨 Visual Elements
- Horizontal Lines: Extend from level creation point to the right
- Dynamic Labels: Show level type and session information
- Color Coding: Different colors for each session and timeframe
- Transparency: Automatically hides overlapping or less important levels
🔧 Technical Specifications
- Pine Script Version: v6
- Chart Overlay: True
- Max Lines: 500
- Max Labels: 50
- Performance: Optimized with intelligent memory management
📋 Usage Tips
1. Best Timeframe: Works on all timeframes, but H1 and lower provide optimal detail
2. Combine with Price Action: Use levels as confluence zones for entry/exit decisions
3. Risk Management: Levels can serve as stop-loss and take-profit targets
4. Market Structure: Helps identify key support/resistance in market structure analysis
🔄 Compatibility
This indicator is designed to work alongside other L3J indicators for comprehensive market analysis.
📞 Support & Updates
For questions, suggestions, or updates, please contact L3J through TradingView messaging.
---
Disclaimer : This indicator is for educational and analysis purposes. Always practice proper risk management and never risk more than you can afford to lose.
Version: 1.0
Author: L3J
Last Updated: 30/08/2025

ICT Macro Time Window NYThis script highlights the typical ICT “macro” algorithm activity windows on your chart. It marks 10 minutes before to 10 minutes after each full hour, based on New York time (NY). The display is restricted to the 00:00 – 16:00 NY time range.
Overlay on chart with semi-transparent background
Automatically adjusts to the chart timeframe
Customizable: window start/end minutes, hours, and background color
Ideal for traders following ICT concepts to visually identify high-probability algorithm activity periods.

ICT-Elliott Hybrid Oscillator네이버 프리미엄 콘텐츠 > 재테크 사관학교 검색
This indicator uses Elliott Wave Theory and ICT (Inner Circle Trader) concepts to help easily and accurately predict when asset prices like cryptocurrencies or stocks will rise or fall.
📌 Easy Explanation of Terms
✅ What is Elliott Wave?
A theory stating that price movements follow a specific pattern (5 upward waves + 3 downward waves) repeatedly. Simply put, it's about repetitive cycles of rises and falls creating overall trends.
✅ What is ICT Theory?
A strategy that identifies optimal trading times by observing critical price areas traded by institutional investors (Order Blocks), imbalances in price (Fair Value Gaps - FVG), and major turning points (Break of Structure - BOS).
📈 Signals Provided by the Indicator
🔹 ① Pivot Highs & Lows
Red ▼: Short-term high (increased likelihood of price falling)
Green ▲: Short-term low (increased likelihood of price rising)
🔹 ② Fair Value Gap (FVG)
Green highlighted area: Zone where price is likely to rise again
Red highlighted area: Zone where price is likely to fall again
🔹 ③ Break of Structure (BOS)
Blue "BOS Up": Indicates a shift to an upward trend
Orange "BOS Down": Indicates a shift to a downward trend
⏳ Recommended Timeframe Combinations
| Major Trend (Basic Analysis) | Entry Point (Detailed Analysis) | Short-term Timing (Precision Analysis) |
| ---------------------------- | ------------------------------- | -------------------------------------- |
| 4-hour | 1-hour | 15-minute |
Use the 4-hour timeframe to gauge overall trends,
the 1-hour timeframe to pinpoint exact entry and exit points,
and the 15-minute timeframe for precise timing.
Include Source
🕯 Recommended Candle Patterns
* Pin Bar (Long wick candle) → Trend reversal signal
* Engulfing Candle (fully covering previous candle) → Strong trend reversal signal
* Hammer & Shooting Star (small body with a long wick) → Bullish or bearish reversal signal
* Doji (balance between buyers and sellers) → High potential for trend reversal

ICT Gold Trading ToolFirst, I recall the original code had elements like Break of Structure, Fair Value Gaps, Premium/Discount Zones, Liquidity Pools, and Buy/Sell signals. The user had previous feedback pointing out issues in the code, like incorrect timeframe usage for BOS and FVG inaccuracies. They also suggested improvements, which were incorporated into a revised version.
So, the brief note should highlight the main components of the tool without getting too technical. The user probably wants this for a quick overview, maybe to share with others or for their own reference. They might be a trader familiar with ICT concepts, so using terms like BOS or FVG is okay without explaining each one.
I need to mention that the tool combines multiple ICT strategies into one indicator. It uses higher timeframes for BOS, which is important for structure. FVG detection was corrected in the revised code, so I should note that it identifies 3-candle patterns. The zones and liquidity pools help in identifying market extremes and areas where price might reverse. The buy/sell signals are based on a combination of BOS and zones, which adds confluence.
Also, the user might appreciate knowing that the tool is customizable with inputs for periods, making it adaptable to different trading styles. Emphasizing that it's for visual assistance and not standalone signals is crucial to remind users to use additional analysis.
