Today High/Low Fibo LineDraw Fibonacci retracements using High/Low of the today
Draw Fibonacci retracements using High/Low of the week
A Fibonacci value of 0 will hide the line
Wyszukaj w skryptach "high low"

Stochastic RibbonA series of highs and lows of different lengths to create a ribbon-like indicator to emulate the stochastic oscillator's top (100), middle (50) and bottom (0). Traders can determine the strength of the support and resistance by the number of converging lines, choose price points and visualise momentum waves.
Inputs:
Theme: multiple colours/themes (theme 2)
Length: high/low length (14)
Start: plot number to start ribbon on (1)
PlotNumber: number of plots to show; maximum 10 per top, middle, bottom (10)
Example:
Length: 14
Start: 5
PlotNumber: 10

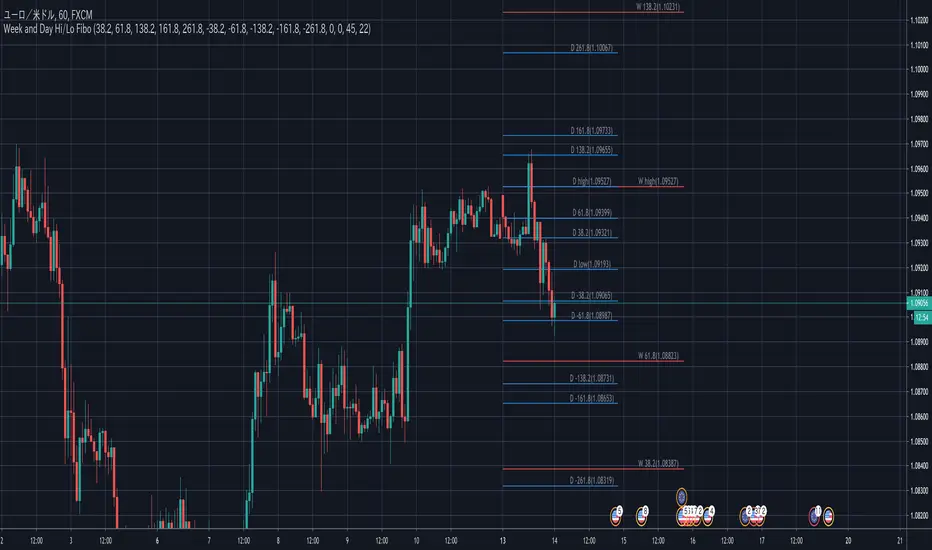
Week and DAY High/Low Fibo LineDraw Fibonacci retracements using High/Low of the previous week
Draw Fibonacci retracements using High/Low of the previous day
A Fibonacci value of 0 will hide the line
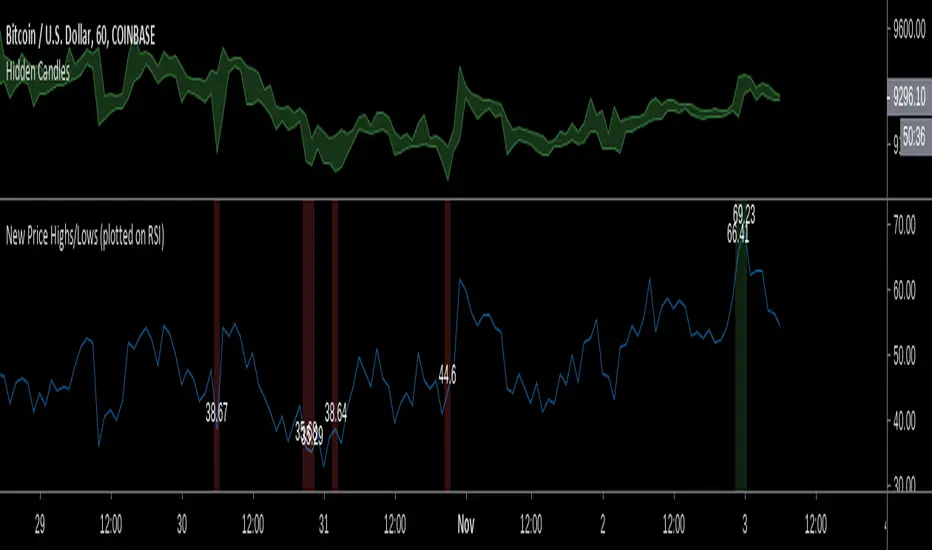
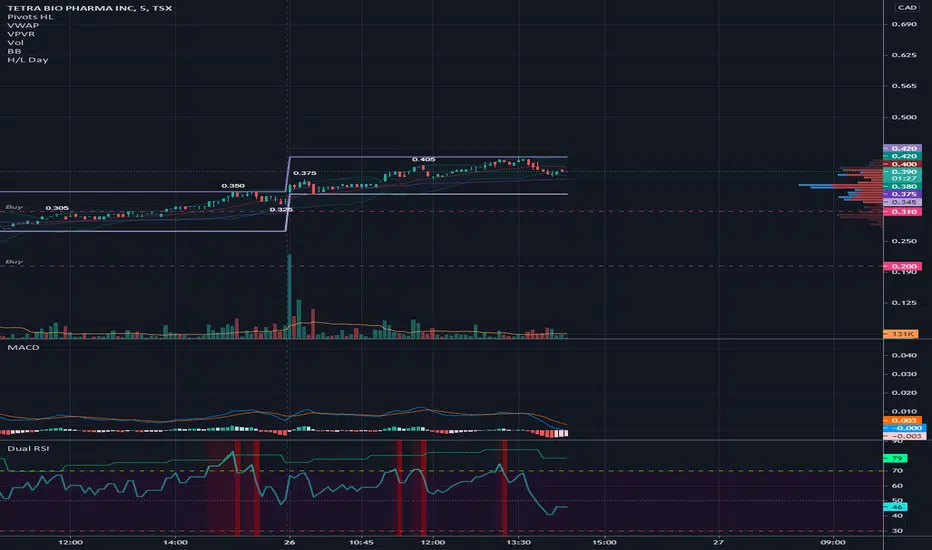
New Price Highs/Lows (plotted on RSI)Rather than rely on existing indicators for bullish/bearish divergence, I'd rather just identify it myself.
This indicator just makes this easier to see (hands-free) the relevant data on the RSI at points where the price hits new highs/lows by colouring the background on the RSI based on price action and also plotting the RSI values at those points so you dont need to keep hovering over the RSI with your mouse.
Stay aware of your lookback setting because it will effect how often the new price highs/lows are highlighted.
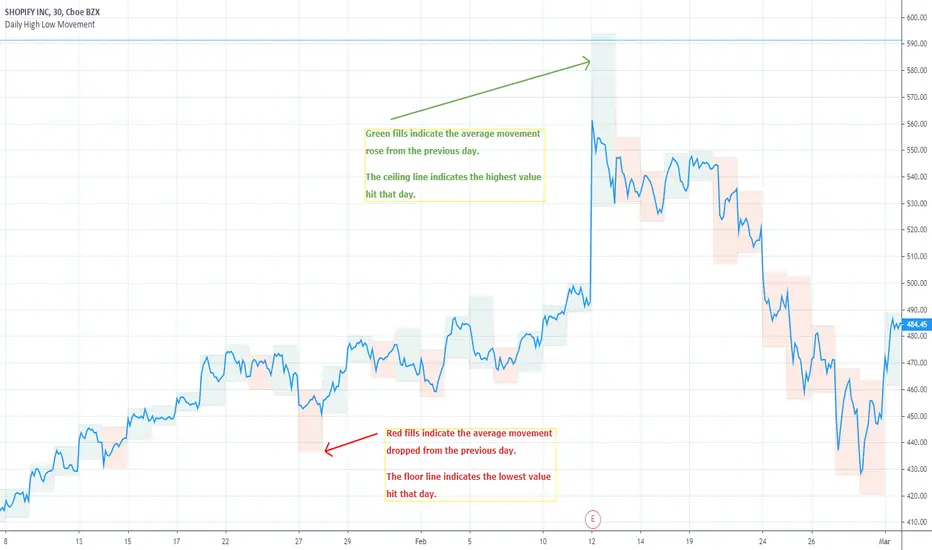
Daily High Low MovementIndicates the daily high and low drawn by green and red lines. Fill blocks indicate the average value movement relevant to the previous day. Green fills indicate that the value is moving higher than the previous day and red meaning lower.
NYSE:BA

AG Ultimate Bollinger BandsWe believe we have really built the ultimate Bollinger Bands! There are so many options with these Bands:
- use an SMA or EMA for the Basis Moving Average
- displaying the Average Highs/Lows (blue lines) to create a Moving Band
- show breakouts of the Upper/Lower Bollinger Bands with arrows for simplicity (no more wondering whether it closed out or not!)
- show a standard deviation of Highs/Lows alongside the traditional Upper/Lower Bollinger Bands.
All options are togglable, for full flexibility and customisation.

52 Week High/Low to YesterdayThis script adds the 52 weeks (one year) high/low to the chart but it wouldn't update the value on the current trading day, so that it would remain at the same level for the whole trading day. It can come really handy for day trading the day of the 52 weeks high/low breakout/breakdown.

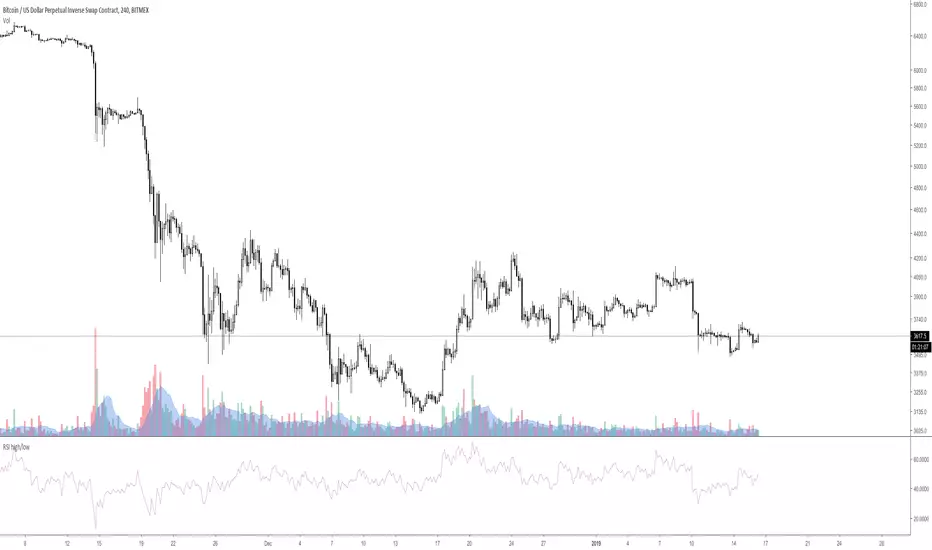
RSI high/low [experiment]This is an experiment.
This is a RSI based on candle high / low instead of close.
If the candle is up / green then the high is used.
If the candle is down / red then the low is used.
Feel free to ask if you have any question.
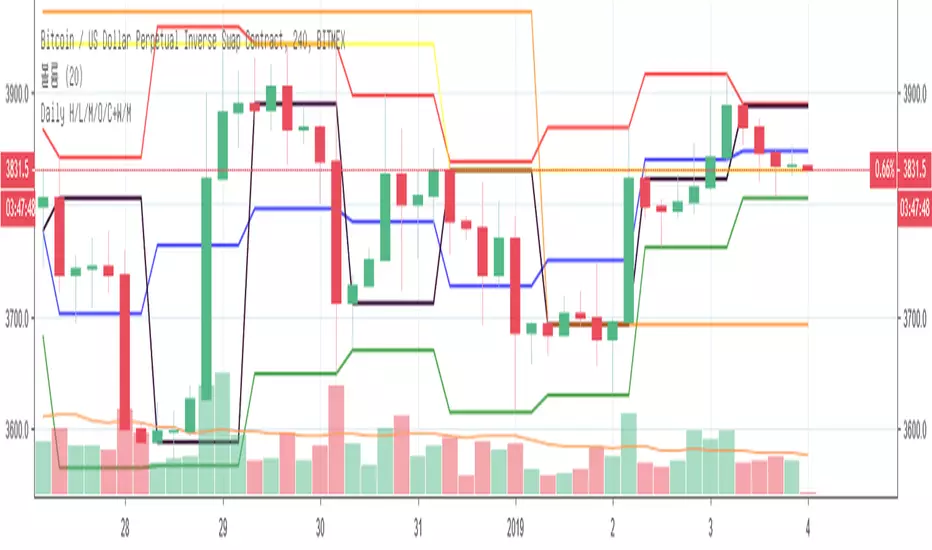
Daily High/Low/Mid/Open/CloseI modify existing scripts about Daily High/Low, Daily Open, Previous Daily Close, etc.
Daily High = red color
Daily Low = green color
Daily Mid = blue color
Daily Open = purple color
Previous Daily Close = black color
Nemesis Swing High Low Support/Resistance Pivot Points by ZekisNemesis Swing High Low Support and Resistance Pivot Points Channel
An indicator that project support and resistance, highs and lows and pivot points
There are a lot of strategies where it can be used, a little google or youtube search for more infos
I colored with black the channel and green when the price breaks the resistance and red when breaks the support for a better view
Values for support and resistance can be adjusted
*Soon i will add alerts for breakeouts
Enjoy!
@ Zekis


CMYK HIGH LOW◊ Introduction
This script is intended do display High and Low values, alongside Highest and Lowest of an adjustable period
◊ Adjustments
CMYK color theme applied.
Price color changes if EMA >< EMA
◊ Usage
For those who use Line, Break, or Area Type Charts.
Usefull to quickly display proper levels for buying selling on minute-term trading
◊ Future Prospects
Somehow displaying the highest & Lowest values in a large font.
◊ ◊ ◊ ◊ ◊ ◊ ◊ ◊ ◊ ◊ ◊ ◊ ◊ ◊ ◊ ◊ ◊ ◊ ◊ ◊ ◊ ◊ ◊ ◊ ◊ ◊ ◊ ◊ ◊ ◊ ◊ ◊ ◊ ◊ ◊ ◊ ◊ ◊ ◊ ◊ ◊ ◊ ◊ ◊ ◊ ◊ ◊ ◊ ◊ ◊ ◊ ◊ ◊ ◊ ◊ ◊ ◊ ◊ ◊ ◊ ◊ ◊ ◊ ◊ ◊ ◊ ◊ ◊ ◊ ◊ ◊ ◊ ◊ ◊ ◊ ◊ ◊ ◊ ◊ ◊ ◊ ◊ ◊ ◊ ◊ ◊ ◊ ◊ ◊ ◊ ◊ ◊ ◊ ◊ ◊ ◊ ◊ ◊ ◊ ◊ ◊ ◊ ◊ ◊ ◊ ◊

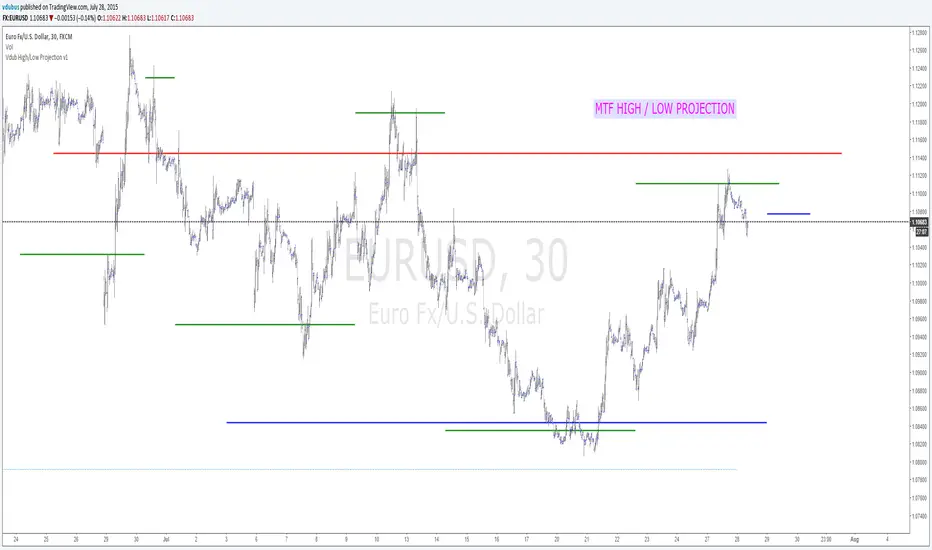
Vdub High/Low Projection v1Vdub High/Low Projection v1
Modified London Underground /
3 x MTF High/Low / projected targets Hourly, Daily, Weekly
Head Hunter HHHead Hunter HH - Advanced Market Structure & Volume Analysis Indicator
This indicator combines volume analysis, price action, and VWAP to identify high-probability trading opportunities across multiple timeframes.
Key Features:
• Smart Volume Analysis: Detects institutional volume patterns using dynamic thresholds
• VWAP-Based Market Structure: Multiple standard deviation bands for precision entry/exit
• Daily Level Integration: Previous day's high, low, close, and current day's open
• Advanced Signal Classification: Regular, Super Strong, and Scalp signals
Signal Types:
1. Regular Signals (White/Purple Triangles)
• Volume-confirmed reversals
• Institutional price levels
• Technical momentum alignment
2. Super Strong Signals (Green/Red Diamonds)
• High-volume breakouts
• Strong momentum confirmation
• Multiple timeframe alignment
3. Scalp Signals (Green/Magenta Circles)
• Quick reversal opportunities
• VWAP deviation analysis
• Volume surge confirmation
Visual Components:
• VWAP with Standard Deviation Bands
• 50 MA (optional)
• Daily Reference Levels
• Color-coded signals based on strength
• Bar color changes on confirmed signals
Best Practices:
• Most effective on higher timeframes (1H+)
• Use with major pairs/instruments
• Combine signals with support/resistance
• Monitor volume confirmation
• Wait for candle close confirmation
This indicator helps identify institutional order flow and high-probability reversal zones by analyzing volume patterns, price action, and market structure, providing traders with multiple confirmation layers before entry.
Note: Results may vary based on market conditions and timeframe selection. Always use proper risk management.

OBV High / LOW (On-Balance Volume )This is a simple application of OBV indicator (On-Balance Volume ), to visually determine when a given stock current obv is near the highest or lowest based on the number of lookback bars.
Indicator examples:
### OBV value is near an all-time high ##
breakthrough , stock value could set new all-time highs.
rejection , stock value could come down or consolidate.
Example
Inputs
OBV High Lookback -> numbers of bars to look back for the obv high.
OBV LowLookback -> numbers of bars to look back for the obv low.
OBV EMA Length -> Ema length
Notes:
This script also comes with an ema indicator based on obv for smoothing the obv signal since it gets noise at lower timeframes (by default comes disabled)
OBV information
www.investopedia.com
Comments:
This is my first script any ideas, suggestions, or detected errors (language/script) don´t hesitate to send a message.
Best regards, Mauro.

Higher Timeframe MA High Low BandsHigher Timeframe Customer MA High Low Bands. There are 3 different Moving Average Parameters Available. Indicator will plot 3 lines of MA Length With Source of High, Close and Low. User can change relevant MA parameters / Show or Hide MA.
Happy Trading

Forex Session High/Low TrackerThis indicator maps out each Forex session along with their relative highs and lows.

Intraday High/Low BandPlots an intraday high low band showing when the stock hits a new daily high/low.
Band can be defined as percentage of the daily range.

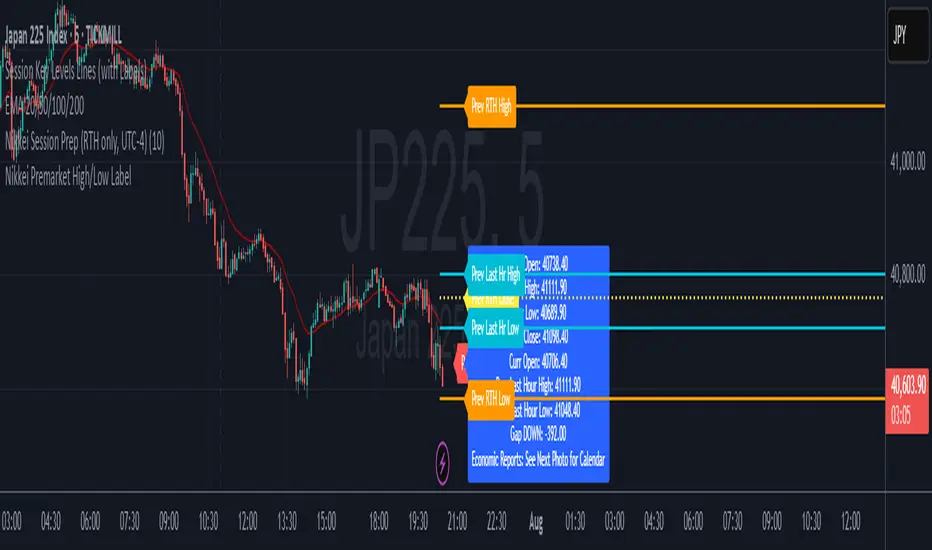
Nikkei Premarket High/Low LabelThis is Nikkei Premarket High/Low Label. shows you the premarket high and low. hope it helps :)
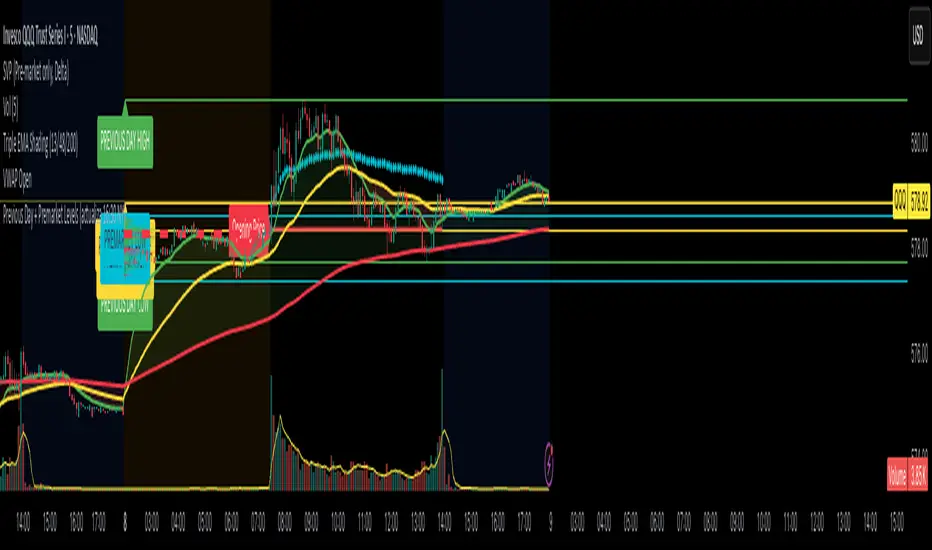
Previous Day Levels (High, Low, Open, Close)This TradingView Pine Script indicator plots the previous day’s price levels (High, Low, Open, and Close) as horizontal rays that extend across the current trading day.
Green lines mark the Previous Day High and Previous Day Low.
Yellow lines mark the Previous Day Open and Previous Day Close.
Labels are automatically displayed at the right edge of the chart, positioned above each line, making it easy to identify the corresponding level in real time.
The levels are updated daily and always begin at the start of the current day, ensuring that they cover the entire intraday session.
This tool helps traders quickly visualize key support and resistance levels from the previous trading day and incorporate them into intraday strategies.
Period High/Low Percentage DifferenceCheck for price away from 200 days high/low and from recent high and low. Found it difficult to keep switching from regular to percentage in chart. I use it for ETF investing.
