Basic Forex TerminalHello,
This script is a simple Forex terminal.
It serves the same purpose as Heatmaps.
You can also set the period to look back manually in the menu.
Major indicators are taken into account.
In this way, an idea can be obtained about all major and minor currencies.
Best regards.
Wyszukaj w skryptach "forex"

Day of week, Forex FixCalendar to work on instruments that trade a 24 hour day like crypto and forex, also does not display if you are above an intraday time. Main tweak was to end the trading day at 0000 (midnight) instead of 1700 (5pm) NYC time.
This update is geared towards Forex traders, which is why I chose to highlight Wednesday in yellow since that is commonly thought of as a midweek reversal point.
@airscape built a good calendar indicator based on the work of @ChrisMoody, this is really an update to their work and directed towards FX and Crypto
airscape:
ChrisMoody:
Future development:
Toggle for light and dark themes
Adjustment/offset for DLST and local vs/ server time
Additional color bands to denote Asian/London/NYC sessions?
Text label for days instead of color option?
Clean up the code and simplify

Forex strength meterCalculates the strength of a particular currency taking into account it's rate of change (% price change in a period) in all correlated and anti-correlated pairs. For instance, when looking for USD strength we will add ROC for USDCAD, USDCHF and USDJPY while subtract AUDUSD, EURUSD, GBPUSD and NZDUSD.
After ROC step, one can smooth the result using EMA, or MACD.
As the script needs to fetch values from multiple currencies it isn't the fastest one, but it gets its job done.
Important: Only major currencies (AUD, CAD, CHF, EUR, GBP, JPY, NZD and USD) are considered.

Forex Trading Sessions with Daylight Savings TimeV1 - Max WarrenDifferent version of the CM one but everything is configurable and easy to manage.
Daylight savings may also be toggled, I cannot automatically toggle it yet but hopefully with a pine update I will be able to.
It had the four main sessions but version two could possibly have all of them as optional toggles
Hope it is useful

Forex Master (EUR/USD)ATTENTION:
This is a symmetrical algorithm designed only for trading EUR/USD on the 1h time frame. For other currency pairs and time frames, you need to re-calibrate the RSI-EMAs as well as the profit targets and stop losses.
BACKTEST CONDITIONS:
Initial equity = $100,000 (no leverage)
Order size = 100% of equity
Pyramiding = disabled
TRADING RULES:
Long entry = EMA20(RSI10) cross> 50
Profit limit = 50 pips
Stop loss = 50 pips
Short entry = EMA30(RSI30) cross< 50
Profit limit = 50 pips
Stop loss = 50 pips
Long entry = Short exit
Short entry = long exit
DISCLAIMER: None of my ideas and posts are investment advice. Past performance is not an indication of future results. This strategy was constructed with the benefit of hindsight and its future performance cannot be guaranteed.

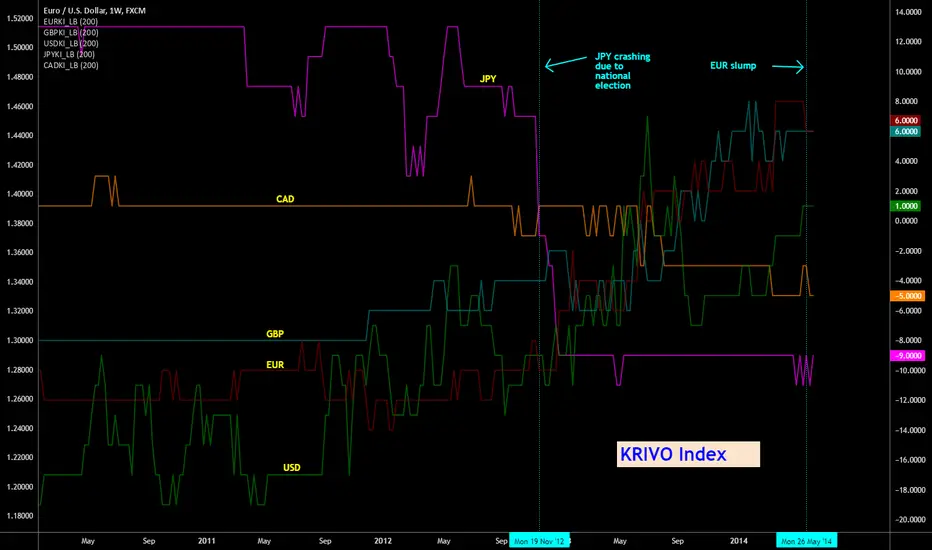
Indicator: Krivo Index [Forex]Krivo index, suggested by Richard Krivo, tries to quantify the "strength" of a currency by checking how many of its pairs are trading strongly (close above 200sma). As you can see from the chart, KI gives an excellent overview of their strength. Note how it correctly points out the JPY crash (Nov 2012).
I decided to implement KI for each currency separately to be compliant with Pine requirements. Also, this enables to add only the needed currency KI scripts (for ex., just CAD_KI and USD_KI). You can add the needed currency KI scripts and merge them all together to form a chart like this. Make sure you "right click" on all and select "Scale Right" (or "Scale Left". Thing to note is all KIs shd be aligned to the same scale).
I have published KI for only 5 currencies now, but can add more on request. BTW, this index is usable on all time frames.
More info on KrivoIndex:
-----------------------------
www.dailyfx.com
JPY crashing:
-----------------------------
webcache.googleusercontent.com
Euro Slump:
-----------------------------
www.bloomberg.com
Please see the comment below for the complete list of currency pairs I used for deriving these indexes.
Forex Midpoint Stratejisi For Nasdaq English Knowledge:
Midpoint Strategy;
The general calculation method is a strategy that helps determine direction by the intersection of a MA line and the value obtained by dividing the lowest and highest price in the specified length range.
Başlangıç Periyodu: The data length of the Midpoint Line.
Kaydırma Seviyesi: The number of steps forward or backward of the Midpoint Line.
Yüzde Seviyesi: the amount of vertical scrolling.
Uzunluk: The length of the MA line
represents.
This strategy is prepared for the Nasdaq 5-minute period. It needs to be optimized for use on other instruments.
There are take profit and stop loss levels within the codes. Friends who want to use it can remove the invisibility from the relevant sections. Also, I removed the midpoint and the MA line so that it does not crowd the image, you can add it if you want.
Thank you.
Turkish Knowledge:
Midpoint Stratejisi;
Genel hesaplama yöntemi, belirlenen uzunluk aralığındaki en düşük ve en yüksek fiyatın ikiye bölümü ile elde edilen değer ve bir ortalama çizgisinin kesişimleriyle yön belirlemeye yardımcı bir stratejidir.
Başlangıç Period: Midpoint Çizgisinin veri uzunluğunu.
Kaydırma Seviyesi: Midpoint Çizgisinin ileri veya geri adım sayısını.
Yüzde Seviyesi: dikey kaydırma miktarını.
Uzunluk: Ortalama çizgisinin uzunluğunu
temsil etmektedir.
Bu strateji Nasdaq 5 dakikalık periot için hazırlanmıştır. Diğer enstrümanlarda kullanılması için optimize edilmesi gerekir.
Kodların içinde Kar alma , zarar durdurma seviyeleri mevcuttur. Kullanmak isteyen arkadaşlar ilgili bölümlerden görünmezliği kaldırabilirler. ayrıca midpoint ve ortalama çizgisinide görüntü kalabalığı yapmaması için ben kaldırdım isterseniz siz ekleyebilirsiniz.
Teşekkürler.

Forex Multi Exchange VolumeHi traders! Forex Multi Exchange Volume (FMEV) aggregates and plots trading volumes for supported forex pairs over multiple different major forex exchanges.
Supported exchanges
- FXCM
- OANDA
- FOREX.COM
- PEPPERSTONE
- GLOBALPRIME
Limitations
Because of the fact that FMEV is pulling data from from multiple different exchanges and is computationally intensive it can take a couple of seconds to load while charting certain forex pairs.

Forex Scalp Triggersthe triggers only work to tell you go back 5 candles on 5 min, take either lowest or highest plus 3 pips and make entry and go 3 pip over under trigger for stop loss. can take half profit at 1x and move stop to break even and go 1x more for take rest profit, or create a trailing stop loss on Take Profit level 2 and ride the trend.
1 Hour chart has to be over under the emas that are faned out nicely to move to 5 min chart to look for the signals if 1hr chart isnt over under the emas nicely then NO TRADE
ForexSignalTV helped create this strategy, just my first script so learning, want to take it to next level but kind of stuck for now. More knowledge coming...
Forex indicator By petran Elevate your market analysis with this powerful, all-in-one visual toolkit designed for discretionary traders across Forex, indices, and commodities (metals).
Core Features:
Trading Sessions Overlay: Clear visual bands highlighting the Asian, London, and New York trading sessions directly on your chart. Never miss a market open or a session overlap again.
Smart Daily Levels: Automatically plots the most essential reference points from the previous day:
PDH / PDL (Previous Day High/Low) – Key support and resistance.
PWH / PWL (Previous Week High/Low) – Higher timeframe context.
DO (Day Open) – A crucial intraday pivot level.
Motivational Watermark: A unique and customizable text overlay at the top of your screen. Display your favorite trading quote, rule, or reminder to maintain the right mindset during the trading day.
Clean & Customizable: Designed for clarity. Adjust colors, session times, and watermark text to fit your personal trading style and chart aesthetics.
Why Traders Choose This Indicator:
Saves Time: No more manually drawing sessions or calculating yesterday's levels.
Improves Discipline: The visual sessions and watermark help you trade only during your planned times and follow your rules.
Universal Application: Works seamlessly on any liquid market where session activity and daily ranges matter.
Perfect for traders who rely on price action, session-based strategies, and need a clean, informative chart environment.

Forex Session TrackerForex Session Tracker - Professional Trading Session Indicator
The Forex Session Tracker is a comprehensive and visually intuitive indicator designed specifically for forex traders who need precise tracking of major global trading sessions. This powerful tool helps traders identify active market sessions, monitor session-specific price ranges, and capitalize on volatility patterns unique to each trading period.
Understanding when major financial centers are active is crucial for forex trading success. This indicator provides real-time visualization of the Tokyo, London, New York, and Sydney trading sessions, allowing traders to align their strategies with peak liquidity periods and avoid low-volatility trading windows.
---
Key Features
📊 Four Major Global Trading Sessions
The indicator tracks all four primary forex trading sessions with precision:
- Tokyo Session (Asian Market) - Captures the Asian trading hours, ideal for JPY, AUD, and NZD pairs
- London Session (European Market) - Monitors the most liquid trading period, perfect for EUR, GBP pairs
- New York Session (American Market) - Tracks US market hours, essential for USD-based currency pairs
- Sydney Session (Pacific Market) - Identifies the opening of the trading week and AUD/NZD activity
Each session is fully customizable with individual color schemes, making it easy to distinguish between different market periods at a glance.
🎯 Session Range Visualization
For each active trading session, the indicator automatically:
- Draws rectangular boxes that highlight the session's time period
- Tracks and displays session HIGH and LOW price levels in real-time
- Creates horizontal lines at session extremes for easy reference
- Positions session labels at the center of each trading period
- Updates dynamically as new highs or lows are formed within the session
This visual approach helps traders quickly identify:
- Session breakout opportunities
- Support and resistance zones formed during specific sessions
- Range-bound vs. trending session behavior
- Key price levels that institutional traders are watching
📱 Live Information Dashboard
A sleek, professional information panel displays:
- Real-time session status - Instantly see which sessions are currently active
- Color-coded indicators - Green dots for active sessions, gray for closed sessions
- Timezone information - Confirms your current timezone settings
- Customizable positioning - Place the dashboard anywhere on your chart (Top Left, Top Right, Bottom Left, Bottom Right)
- Adjustable size - Choose from Tiny, Small, Normal, or Large text sizes for optimal visibility
The dashboard provides at-a-glance awareness of market conditions without cluttering your chart analysis.
⚙️ Extensive Customization Options
Every aspect of the indicator can be tailored to your trading preferences:
Session-Specific Controls:
- Enable/disable individual sessions
- Customize colors for each trading period
- Adjust session times to match your broker's server time
- Toggle background highlighting on/off
- Show/hide session high/low lines independently
General Settings:
- UTC Offset Control - Adjust timezone from UTC-12 to UTC+14
- Exchange Timezone Option - Automatically use your chart's exchange timezone
- Background Transparency - Fine-tune the opacity of session highlighting (0-100%)
- Session Labels - Show or hide session name labels
- Information Panel - Toggle the live status dashboard on/off
Style Settings:
- Turn session backgrounds ON/OFF directly from the Style tab
- Maintain clean charts while keeping all analytical features active
🔔 Built-in Alert System
Stay informed about session openings with customizable alerts:
- Tokyo Session Started
- London Session Started
- New York Session Started
- Sydney Session Started
Set up notifications to never miss important market opening periods, even when you're away from your charts.
---
How to Use This Indicator
For Day Traders:
1. Identify High-Volatility Periods - Focus your trading during London and New York session overlaps for maximum liquidity
2. Monitor Session Breakouts - Watch for price breaks above/below session highs and lows
3. Avoid Low-Volume Periods - Recognize when major sessions are closed to avoid false signals
For Swing Traders:
1. Mark Key Levels - Use session highs and lows as support/resistance zones
2. Track Multi-Session Patterns - Observe how price behaves across different trading sessions
3. Plan Entry/Exit Points - Time your trades around session openings for better execution
For Currency-Specific Traders:
1. JPY Pairs - Focus on Tokyo session movements
2. EUR/GBP Pairs - Monitor London session activity
3. USD Pairs - Track New York session volatility
4. AUD/NZD Pairs - Watch Sydney and Tokyo sessions
---
Technical Specifications
- Pine Script Version: 5
- Overlay Indicator: Yes (displays directly on price chart)
- Maximum Bars Back: 500
- Drawing Objects: Up to 500 lines, boxes, and labels
- Performance: Optimized for real-time data processing
- Compatibility: Works on all timeframes (recommended: 5m to 1H for session tracking)
---
Installation & Setup
1. Add to Chart - Click "Add to Chart" after copying the script to Pine Editor
2. Configure Timezone - Set your UTC offset or enable "Use Exchange Timezone"
3. Customize Colors - Choose your preferred color scheme for each session
4. Adjust Display - Enable/disable features based on your trading style
5. Set Alerts - Create alert notifications for session starts
---
Best Practices
✅ Combine with Price Action - Use session ranges alongside candlestick patterns for confirmation
✅ Watch Session Overlaps - The London-New York overlap (1300-1600 UTC) typically shows highest volatility
✅ Respect Session Highs/Lows - These levels often act as intraday support and resistance
✅ Adjust for Your Broker - Verify session times match your broker's server clock
✅ Use Multiple Timeframes - View sessions on both lower (15m) and higher (1H) timeframes for context
---
Why Choose Forex Session Tracker Pro?
✨ Professional Grade Tool - Built with clean, efficient code following TradingView best practices
✨ Beginner Friendly - Intuitive design with clear visual cues
✨ Highly Customizable - Adapt every feature to match your trading style
✨ Performance Optimized - Lightweight code that won't slow down your charts
✨ Actively Maintained - Regular updates and improvements
✨ No Repainting - All visual elements are fixed once the session completes
---
Support & Updates
This indicator is designed to provide reliable, accurate session tracking for forex traders of all experience levels. Whether you're a scalper looking for high-volatility windows or a position trader marking key institutional levels, the Forex Session Tracker Pro delivers the insights you need to make informed trading decisions.
Happy Trading! 📈
---
Disclaimer
This indicator is a tool for technical analysis and should be used as part of a comprehensive trading strategy. Past performance does not guarantee future results. Always practice proper risk management and never risk more than you can afford to lose. Trading forex carries a high level of risk and may not be suitable for all investors.

Forex 5m Simple Scanner + RSI DivergenceHello everyone. this is a easy to use indicator.
I wanted something very easy to visualize and understand. Great for the beginner's.
About this script:
“Forex 5m Simple Scanner + RSI Divergence”
This scanner helps beginner traders quickly identify trade opportunities across the top 10 forex pairs. It combines a simple EMA crossover system with an optional RSI filter to confirm trend direction, and adds RSI divergence detection to spot potential reversals early.
The built-in table shows each pair’s trend, RSI value, buy/sell signal, and divergence status—all in one place.
For beginners, this makes it easier to:
Avoid flipping between multiple charts.
See clear BUY/SELL 🚀 signals instead of guessing.
Spot high-probability setups with RSI divergence markers (😊/☹️).
It simplifies decision-making by turning complex signals into a straightforward dashboard that highlights where attention is needed most.

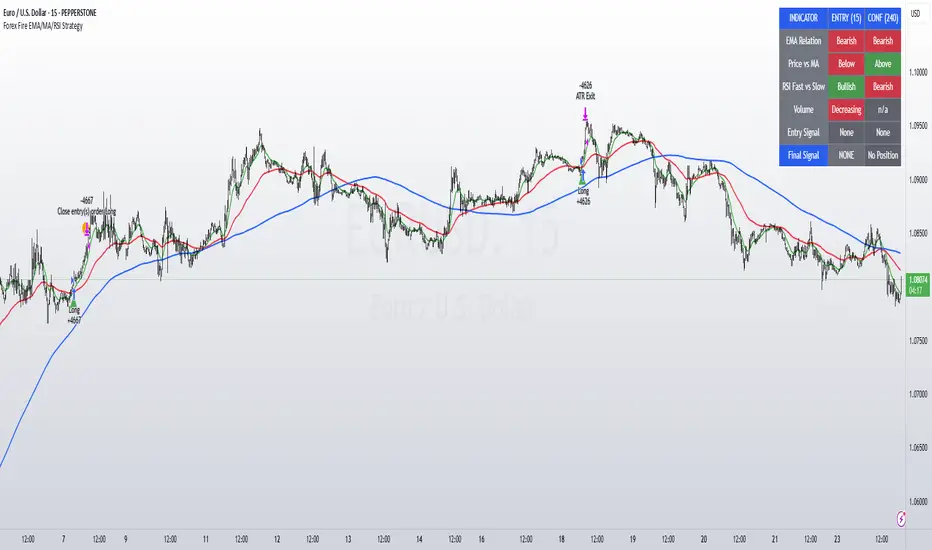
Forex Fire EMA/MA/RSI StrategyEURUSD
The entry method in the Forex Fire EMA/MA/RSI Strategy combines several conditions across two timeframes. Here's a breakdown of how entries are determined:
Long Entry Conditions:
15-Minute Timeframe Conditions:
EMA 13 > EMA 62 (short-term momentum is bullish)
Price > MA 200 (trading above the major trend indicator)
Fast RSI (7) > Slow RSI (28) (momentum is increasing)
Fast RSI > 50 (showing bullish momentum)
Volume is increasing compared to 20-period average
4-Hour Timeframe Confluence:
EMA 13 > EMA 62 (larger timeframe confirms bullish trend)
Price > MA 200 (confirming overall uptrend)
Slow RSI (28) > 40 (showing bullish bias)
Fast RSI > Slow RSI (momentum is supporting the move)
Additional Precision Requirement:
Either EMA 13 has just crossed above EMA 62 (crossover)
OR price has just crossed above MA 200
Short Entry Conditions:
15-Minute Timeframe Conditions:
EMA 13 < EMA 62 (short-term momentum is bearish)
Price < MA 200 (trading below the major trend indicator)
Fast RSI (7) < Slow RSI (28) (momentum is decreasing)
Fast RSI < 50 (showing bearish momentum)
Volume is increasing compared to 20-period average
4-Hour Timeframe Confluence:
EMA 13 < EMA 62 (larger timeframe confirms bearish trend)
Price < MA 200 (confirming overall downtrend)
Slow RSI (28) < 60 (showing bearish bias)
Fast RSI < Slow RSI (momentum is supporting the move)
Additional Precision Requirement:
Either EMA 13 has just crossed under EMA 62 (crossunder)
OR price has just crossed under MA 200
The key aspect of this strategy is that it requires alignment between the shorter timeframe (15m) and the larger timeframe (4h), which helps filter out false signals and focuses on trades that have strong multi-timeframe support. The crossover/crossunder requirement further refines entries by looking for actual changes in direction rather than just conditions that might have been in place for a long time.
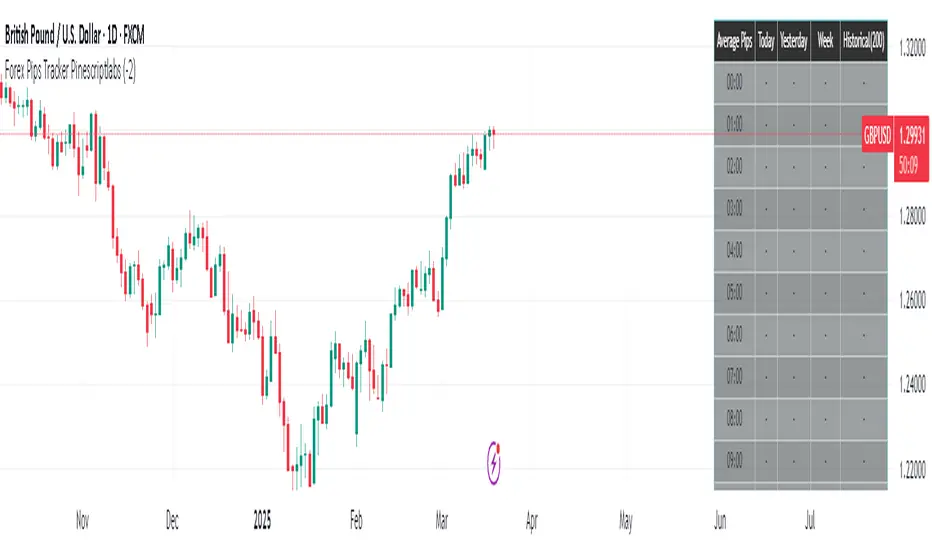
Forex Pips Tracker PinescriptlabsThis algorithm is exclusively designed for the Forex market 🌐 and serves as a tool to measure volatility, helping to determine on average how many pips positions move per hour. With this information, a trader can place take profit and stop loss orders with greater certainty, since they know the average pip movement range during each hour of the day.
What does it do and how does it work?
• Volatility measurement in pips 📊:
The algorithm calculates the size of the movement (or range) of each candle expressed in pips. To do this, it takes the difference between the highest and lowest price of each candle and converts it into pips.
👉
• Time zone adjustment ⏰:
It allows you to configure the time zone so that the data aligns with your desired schedule. This is especially useful for comparing movements at different times based on the trader's location.
• Analysis by time intervals 🕒:
The algorithm’s logic organizes the information for each hour of the day. It stores data for the current day, the previous day, weekly, and historically (200 candles). This allows you to see how volatility varies across different periods, providing a dynamic view of market behavior.
👉
• Directionality of movement 🔄:
In addition to averaging the pip range, the algorithm determines the predominant direction of each candle (bullish or bearish). This translates into visual indicators (like arrows) that help identify whether, on average, the movement during that hour tends to go up or down.
• Table visualization 📈:
Finally, the information is presented in an integrated table on the chart. Each row corresponds to an hour of the day and shows the average number of pips and the direction (bullish, bearish, or neutral) for each analyzed period. This table makes it easy to quickly and practically interpret the volatility data.
By combining these features, the algorithm becomes an essential tool for traders looking to better understand market dynamics and optimize their trading strategies! 💼✨
Español:
Este algoritmo está diseñado exclusivamente para el mercado Forex 🌐 y sirve como una herramienta para medir la volatilidad, ayudando a determinar en promedio cuántos pips se mueven las posiciones por hora. Con esta información, un trader puede colocar el take profit y el stop loss con mayor certeza, ya que conoce el rango promedio de movimiento en pips durante cada hora del día.
¿Qué hace y cómo funciona?
• Medición de volatilidad en pips 📊:
El algoritmo calcula el tamaño del movimiento (o rango) de cada vela expresado en pips. Para ello, toma la diferencia entre el precio máximo y el mínimo de cada vela y la convierte a pips.
👉
• Ajuste de zona horaria ⏰:
Permite configurar la zona horaria para que los datos se ajusten al horario deseado. Esto es especialmente útil para comparar movimientos durante distintas horas en función de la localización del trader.
• Análisis por intervalos de tiempo 🕒:
La lógica del algoritmo organiza la información por cada hora del día. Guarda datos para el día actual, el día anterior, a nivel semanal e histórico (200 velas). Esto permite ver cómo varía la volatilidad en diferentes periodos, proporcionando una visión dinámica del comportamiento del mercado.
👉
• Direccionalidad del movimiento 🔄:
Además de promediar el rango en pips, el algoritmo determina la dirección predominante de cada vela (alcista o bajista). Esto se traduce en indicadores visuales (como flechas) que permiten identificar si, en promedio, el movimiento en esa hora tiende a subir o bajar.
• Visualización en tabla 📈:
Finalmente, la información se presenta en una tabla integrada en el gráfico. Cada fila corresponde a una hora del día y muestra el promedio de pips y la dirección (alcista, bajista o neutral) para cada uno de los periodos analizados. Esta tabla facilita la interpretación rápida y práctica de los datos de volatilidad.
Al combinar estas funciones, el algoritmo se convierte en una herramienta esencial para traders que buscan entender mejor la dinámica del mercado y optimizar sus estrategias de trading! 💼✨
Forex Hammer and Hanging Man StrategyThe strategy is based on two key candlestick chart patterns: Hammer and Hanging Man. These chart patterns are widely used in technical analysis to identify potential reversal points in the market. Their relevance in the Forex market, known for its high liquidity and volatile price movements, is particularly pronounced. Both patterns provide insights into market sentiment and trader psychology, which are critical in currency trading, where short-term volatility plays a significant role.
1. Hammer:
• Typically occurs after a downtrend.
• Signals a potential trend reversal to the upside.
• A Hammer has:
• A small body (close and open are close to each other).
• A long lower shadow, at least twice as long as the body.
• No or a very short upper shadow.
2. Hanging Man:
• Typically occurs after an uptrend.
• Signals a potential reversal to the downside.
• A Hanging Man has:
• A small body, similar to the Hammer.
• A long lower shadow, at least twice as long as the body.
• A small or no upper shadow.
These patterns are a manifestation of market psychology, specifically the tug-of-war between buyers and sellers. The Hammer reflects a situation where sellers tried to push the price down but were overpowered by buyers, while the Hanging Man shows that buyers failed to maintain the upward movement, and sellers could take control.
Relevance of Chart Patterns in Forex
In the Forex market, chart patterns are vital tools because they offer insights into price action and market sentiment. Since Forex trading often involves large volumes of trades, chart patterns like the Hammer and Hanging Man are important for recognizing potential shifts in market momentum. These patterns are a part of technical analysis, which aims to forecast future price movements based on historical data, relying on the psychology of market participants.
Scientific Literature on the Relevance of Candlestick Patterns
1. Behavioral Finance and Candlestick Patterns:
Research on behavioral finance supports the idea that candlestick patterns, such as the Hammer and Hanging Man, are relevant because they reflect shifts in trader psychology and sentiment. According to Lo, Mamaysky, and Wang (2000), patterns like these could be seen as representations of collective investor behavior, influenced by overreaction, optimism, or pessimism, and can often signal reversals in market trends.
2. Statistical Validation of Chart Patterns:
Studies by Brock, Lakonishok, and LeBaron (1992) explored the profitability of technical analysis strategies, including candlestick patterns, and found evidence that certain patterns, such as the Hammer, can have predictive value in financial markets. While their study primarily focused on stock markets, their findings are generally applicable to the Forex market as well.
3. Market Efficiency and Candlestick Patterns:
The efficient market hypothesis (EMH) posits that all available information is reflected in asset prices, but some studies suggest that markets may not always be perfectly efficient, allowing for profitable exploitation of certain chart patterns. For instance, Jegadeesh and Titman (1993) found that momentum strategies, which often rely on price patterns and trends, could generate significant returns, suggesting that patterns like the Hammer or Hanging Man may provide a slight edge, particularly in short-term Forex trading.
Testing the Strategy in Forex Using the Provided Script
The provided script allows traders to test and evaluate the Hammer and Hanging Man patterns in Forex trading by entering positions when these patterns appear and holding the position for a specified number of periods. This strategy can be tested to assess its performance across different currency pairs and timeframes.
1. Testing on Different Timeframes:
• The effectiveness of candlestick patterns can vary across different timeframes, as market dynamics change with the level of detail in each timeframe. Shorter timeframes may provide more frequent signals, but with higher noise, while longer timeframes may produce more reliable signals, but with fewer opportunities. This multi-timeframe analysis could be an area to explore to enhance the strategy’s robustness.
2. Exit Strategies:
• The script incorporates an exit strategy where positions are closed after holding them for a specified number of periods. This is useful for testing how long the reversal patterns typically take to play out and when the optimal exit occurs for maximum profitability. It can also help to adjust the exit logic based on real-time market behavior.
Conclusion
The Hammer and Hanging Man patterns are widely recognized in technical analysis as potential reversal signals, and their application in Forex trading is valuable due to the market’s high volatility and liquidity. This strategy leverages these candlestick patterns to enter and exit trades based on shifts in market sentiment and psychology. Testing and optimization, as offered by the script, can help refine the strategy and improve its effectiveness.
For further refinement, it could be valuable to consider combining candlestick patterns with other technical indicators or using multi-timeframe analysis to confirm patterns and increase the probability of successful trades.
References:
• Lo, A. W., Mamaysky, H., & Wang, J. (2000). Foundations of Technical Analysis: Computational Algorithms, Statistical Inference, and Empirical Implementation. The Journal of Finance, 55(4), 1705-1770.
• Brock, W., Lakonishok, J., & LeBaron, B. (1992). Simple Technical Trading Rules and the Stochastic Properties of Stock Returns. The Journal of Finance, 47(5), 1731-1764.
• Jegadeesh, N., & Titman, S. (1993). Returns to Buying Winners and Selling Losers: Implications for Stock Market Efficiency. The Journal of Finance, 48(1), 65-91.
This provides a theoretical basis for the use of candlestick patterns in trading, supported by academic literature and research on market psychology and efficiency.

Forex Pair Yield Momentum This Pine Script strategy leverages yield differentials between the 2-year government bond yields of two countries to trade Forex pairs. Yield spreads are widely regarded as a fundamental driver of currency movements, as highlighted by international finance theories like the Interest Rate Parity (IRP), which suggests that currencies with higher yields tend to appreciate due to increased capital flows:
1. Dynamic Yield Spread Calculation:
• The strategy dynamically calculates the yield spread (yield_a - yield_b) for the chosen Forex pair.
• Example: For GBP/USD, the spread equals US 2Y Yield - UK 2Y Yield.
2. Momentum Analysis via Bollinger Bands:
• Yield momentum is computed as the difference between the current spread and its moving
Bollinger Bands are applied to identify extreme deviations:
• Long Entry: When momentum crosses below the lower band.
• Short Entry: When momentum crosses above the upper band.
3. Reversal Logic:
• An optional checkbox reverses the trading logic, allowing long trades at the upper band and short trades at the lower band, accommodating different market conditions.
4. Trade Management:
• Positions are held for a predefined number of bars (hold_periods), and each trade uses a fixed contract size of 100 with a starting capital of $20,000.
Theoretical Basis:
1. Yield Differentials and Currency Movements:
• Empirical studies, such as Clarida et al. (2009), confirm that interest rate differentials significantly impact exchange rate dynamics, especially in carry trade strategies .
• Higher-yields tend to appreciate against lower-yielding currencies due to speculative flows and demand for higher returns.
2. Bollinger Bands for Momentum:
• Bollinger Bands effectively capture deviations in yield momentum, identifying opportunities where price returns to equilibrium (mean reversion) or extends in trend-following scenarios (momentum breakout).
• As Bollinger (2001) emphasized, this tool adapts to market volatility by dynamically adjusting thresholds .
References:
1. Dornbusch, R. (1976). Expectations and Exchange Rate Dynamics. Journal of Political Economy.
2. Obstfeld, M., & Rogoff, K. (1996). Foundations of International Macroeconomics.
3. Clarida, R., Davis, J., & Pedersen, N. (2009). Currency Carry Trade Regimes. NBER.
4. Bollinger, J. (2001). Bollinger on Bollinger Bands.
5. Mendelsohn, L. B. (2006). Forex Trading Using Intermarket Analysis.

Forex - Lot size calculatorThis indicator is specifically designed for Forex traders who need a convenient lot size calculator directly on their charts. It allows users to input their account balance, risk percentage, and stop-loss distance in pips to easily determine the appropriate lot size for a given trade, ensuring effective risk management.
Key Features:
Lot Size Calculation: Automatically calculates the lot size based on user-defined inputs: account balance, risk percentage, and stop-loss distance.
Error Handling: The indicator only works with Forex pairs. If applied to non-Forex assets, a clear and prominent red error message will appear in the bottom-right corner of the chart, reminding the user that this script is intended exclusively for Forex trading.
Simple Visualization: The calculated lot size is displayed in an easy-to-read table directly on the chart.
How to Use:
Add the indicator to a Forex chart.
Enter your account balance, risk percentage, and stop-loss pips in the input fields.
The indicator will display the calculated lot size for the chosen Forex pair.
Important Notes:
This script is intended only for Forex assets. If used on other instruments (e.g., stocks, crypto, indices), an error message will be shown.
Always validate lot sizes with your broker, as there can be slight variations depending on broker specifications and leverage settings.

Forex SessionThis Trading View script highlights the trading sessions for New York, European, and Asian markets on the chart and adds labels at the start of each session. The script uses Pine Script version 5 and converts local session times to UTC to accurately display the session times regardless of your local Time zone.
Features :
Session Times:
New York: 8:30 AM to 3:00 PM (Eastern Time, GMT-4)
European: 8:00 AM to 4:30 PM (London Time, GMT+1)
Asian: 9:00 AM to 6:00 PM (Tokyo Time, GMT+9)
Background Highlighting: The script shades the background for each session.
New York Session: Blue
European Session: Green
Asian Session: Red
Today's sessions are shaded with 90% opacity.
Tomorrow's sessions are shaded with 70% opacity.
How It Works :
Session Times Conversion: The script converts the session times from local timezones to UTC
using the timestamp function.
Background Coloring: The bgcolor function is used to shade the background for each session.
Forex Multi-Factor IndicatorMoving Averages (MA):
Two moving averages are plotted on the chart: a fast MA (blue line) and a slow MA (red line).
The fast MA is calculated using a shorter period (10 periods by default), while the slow MA is calculated using a longer period (30 periods by default).
Moving averages help identify trends by smoothing out price fluctuations. When the fast MA crosses above the slow MA, it suggests a bullish trend, and when the fast MA crosses below the slow MA, it suggests a bearish trend.
Relative Strength Index (RSI):
The RSI indicator (orange line) is plotted on a separate axis.
RSI measures the speed and change of price movements and oscillates between 0 and 100.
RSI values above 70 are considered overbought, indicating a potential reversal to the downside, while RSI values below 30 are considered oversold, indicating a potential reversal to the upside.
Volume Moving Average (Volume MA):
The volume moving average (purple line) is plotted on the same axis as the volume.
The volume moving average is calculated over a specified period (20 periods by default).
Volume analysis provides insights into the strength of price movements. When the volume increases along with price movements, it suggests strong conviction from traders.
Buy and Sell Signals:
Buy signals (green triangle) are generated when all of the following conditions are met:
The fast MA crosses above the slow MA (indicating a bullish trend).
The RSI is below the oversold level (indicating potential upward momentum).
The current price is above the fast MA, and the volume is higher than the volume MA (indicating positive volume trend).
Sell signals (red triangle) are generated when all of the following conditions are met:
The fast MA crosses below the slow MA (indicating a bearish trend).
The RSI is above the overbought level (indicating potential downward momentum).
The current price is below the fast MA, and the volume is lower than the volume MA (indicating negative volume trend).
Overall, this multi-factor indicator combines moving averages, RSI, and volume analysis to identify potential buying and selling opportunities in the Forex market. Traders can use the signals generated by this indicator as part of their trading strategy, but it's important to consider other factors such as risk management and market conditions before making trading decisions

Forex Strength IndicatorThis indicator will display the strength of 8 currencies, EUR, AUD, NZD, JPY, USD, GBP, CHF, and CAD. Each line will represent each currency. Alongside that, Fibonacci levels will be plotted based on a standard deviation from linear regression, with customizable lengths.
For more steady Fibonacci levels, use higher lengths for both Standard Deviations and Linear Regression. All currency lines come from moving averages with options like EMA, SMA, WMA, RMA, HMA, SWMA, and Linear Regression.
When lines of the active pair are far from each other, it means higher divergence in those currency strengths among the other pairs. The closer the lines are, the lower the divergence.
You can use the Fibonacci levels as points for the reversal or end of the current trend. When the lines cross can be used as a parameter for a more accurate signal of the next movement.
All 28 pairs are loaded from the same time frame and will use the same moving average for all of them
Alerts from the line crossing are available.

FOREX MASTER PATTERN Value Lines by nnamThe Forex Master Pattern is form of technical analysis that provides a framework for spotting hidden price patterns that reveal the true movement of the market. The Forex Master Pattern Value Lines Indicator helps to identify this Phase 1 contraction of the Forex Master Pattern cycle.
HOW THIS INDICATOR WORKS
This indicator looks for a sustained contraction in price initially indicated by TWO contraction bars in a row, thus detecting a contraction point and a potential new master pattern origin point.
Once a contraction point is detected, a blue box will appear on the chart with a thick solid blue line projecting from its center. These are potential "Points of Origin" and "Value Lines" that institutional traders use to balance their books.
As shown above, when price begins to move (detected by engulfing and/or expansion candles), an Arrow is plotted to the chart identifying a possible expansion.
As shown above, previous Value Lines typically serve as future support / resistance points, however, due to the unique location of these lines, they are not typically identified as support or resistance levels on standard S/R indicators.
Color Coded Candles assist the user in quickly identifying contraction and expansion areas as well as trends away from the value-line. The expansion candles, Up/Down candles, and contraction BARS are all inspired by the STRAT (Rob Smith) and are specifically incorporated into this indicator to assist the user in finding potential reversals during the expansion phase. This helps to avoid the whiplash typically associated with the first phase of Forex Master Pattern.
USER DEFINED SETTINGS
- Line Settings Section -
#Max Lines to Show
This limits or extends the total number of lines shown on the chart. The Default is 12 (minimum is 1, maximum is 499).
#Show Lines on Chart
This setting turns all lines ON or OFF on the chart
#Show Value-Lines on Chart
This setting turns the Value Lines ON or OFF on the chart
#Set Value-Line Width
This setting sets the width of the value-line displayed on the chart
#Only show last value-line on the chart
This setting removes all but the most recent value-line from the chart
- Box Settings Section -
#Show Last Box Only
This setting turns OFF all previous boxes and only shows the most recent contraction box on the chart
- Expansion Area Settings Section -
#Show Expansion Area
This setting turns ON or OFF the expansion area fill
#Show Expansion Guidelines on Chart
This setting turns ON or OFF the guidelines that show the current direction of the price via an extended line.
- Candle Colors Section -
#Color Code the Candles
This setting turns on Color Coding for the Candles which changes the colors of each candle type:
1. Contraction Candle
2. Expansion Candle
3. Up Candle
4. Down Candle
5. Engulfing Candles (engulfing candles override other candle settings if turned ON)
- Engulfing Patterns Section -
#Show Engulfing Patterns
This setting turns ON or OFF engulfing candle plots globally
#Show Bullish Engulfing Candles
This setting allows the user to turn Bullish Engulfing signals ON or OFF
#Show Bearish Engulfing Candles
This setting allows the user to turn Bearish Engulfing signals ON or OFF
I hope you enjoy this indicator and that it provides some value. Please reach out to me with any suggestions or need training on the indicator.
