RSI Strategy w/ Trailing SL / TP Optimized for Crypto [Strategy]This strategy is designed to use the RSI and EMA filters. A 200 period EMA is used for short / long filters, and the 50 period EMA is used to determine the direction of the short term trend.
In addition, the script uses "rate of change" for the fast EMA (trend), volume , RSI (momentum), and price (volatility) and only takes trades when all are in optimal conditions.
I.E., the EMA is in an uptrend, the volume is increasing, price is in an uptrend, and the RSI is in an uptrend, so we will place a Long trade.
This strategy uses EMAs as a trailing stop loss and take profit. As this is a trend following strategy, the idea is to maximize profits when correct and minimize losses when
wrong.
It was designed specifically using crypto pairs, and was optimized for the 10 minute chart.
My goal was to get the best use out of the RSI indicator. I was originally an MACD fanboy, but have recently converted.
Want to help me improve this code or strategy? Have suggestions for improvement? Leave them in the comments below.
Thanks for using my script! I hope it works well for you and good luck in the markets.
If you have any questions, please leave them in the comments and I'll do my best to respond.
This script does not repaint as it only relies on close data to make a decision to enter a trade.
How to use this strategy:
___________________________
Enable Long Entries? - Used to enable or disable the strategy from executing long entries.
Enable Short Entries? - Used to enable or disable the strategy from executing short entries.
How Many Bars To Look Back for Hi/Lo: - This is used for the Stop Loss and Take Profit targets. An integer of bars is used to look back and calculate the values.
RSI Length (Rec: 8) - The length of the RSI
Source - The RSI Source
Use Slow EMA? - If checked, a 200 period EMA will be used to filter entries long or short (only take shorts when the price is below, long when above). In addition, the script will close any trades that cross the 200 period EMA. By default this is disabled.
EMA Slow - the period of the Slow EMA (200 by default)
EMA Slow Src - what to use to calculate the Slow EMA (high by default)
EMA Fast - The Fast EMA (50 period) is used to calculate the direction of the short term trend. This also factored into the Rates of Change.
EMA Fast Src - what to use to calculate the Fast EMA
ATR Length - If used, the ATR length is used to calculate the Stop Loss and Take Profit targets.
SL Multiplier - The distance away from the initial value to multiply the Stop Loss
TP Multiplier - The distance away from the initial value to multiply the Take Profit.
Use EMA as SL / TP? - If true (default) a 3 period EMA is used to calculate Stop Loss and Take Profit targets. Else, an ATR is used to calculate these values.
Stop Loss / Take Profit Offset - Default: 3 - this is used to shift the EMA / ATR Stop Loss and Take Profit lines to the right X bars. This is to ensure that they are hit properly and not exceeded.
Short Len Vol - Use to calculate the volume of the short length, used in rate of change calculations
Long Len - Use to calculate the volume of the long length, used in rate of change calculations
RSI Long Entry Val - Minimum RSI crossover value to enter a trade Long. If the RSI is below this value, trade entries are not valid.
RSI Long Cutoff Threshold - Long entry RSI value cutoff to no longer enter trades. If the RSI is above this value, trades entries are not valid.
RSI Short Entry Val - Minimum RSI crossover value to enter a trade Short. If the RSI is above this value, trade entries are not valid.
RSI Short Cutoff Threshold - Short entry RSI value cutoff to no longer enter trades. If the RSI is below this value, trades entries are not valid.
ROC Fast EMA - Calculates the rate of change between the Fast Ema now and 'X' bars ago. \n\n For a long entry, a positive value is needed, and for a short entry, a negative value is needed.
ROC Price - Calculates the rate of change between the most recent price close and 'X' bars ago. \n\n For a long entry, a positive value is needed, and for a short entry, a negative value is needed.
ROC RSI - Calculates the rate of change between the RSI now and 'X' bars ago. \n\n For a long entry, a positive value is needed, and for a short entry, a negative value is needed.
Use Close for SL - Default = Off - If checked, when a candle hits the stop loss, the trade will close on the next candle. If unchecked, the trade will remain open until the candle closes at or beyond the stop loss lines.
Custom Message Boxes - Primarily used for bots, but can be used to also insert your own messages for your trading alerts.
Wyszukaj w skryptach "ema"

D Money – EMA/TEMA Touch Strategy (Distance) What it’s trying to capture
You want mean-reversion “tags” back to a moving average after price has stretched away and momentum flips:
Bearish setup (short): price has been above EMA(9) for a few bars, then MACD turns bearish, and price is far enough above the EMA (by an adaptive threshold). Exit when price tags the EMA.
Bullish setup (long): price has been below your chosen TEMA rail (actually an EMA of 50/100/200 you pick) for a few bars, then MACD turns bullish, and price is far enough below that TEMA. Exit when price tags that TEMA.
The moving averages it uses
EMA(9) — your fast “tag” for short take-profits.
“TEMA line” input = one of EMA(50) / EMA(100) / EMA(200). (Labelled “Chosen TEMA” in the plot; it’s an EMA rail you pick.)
When it will enter trades
It requires four things per side:
Short (EMA-Touch Short)
MACD bearish cross on the signal bar
If “Require NO MA touch on cross bar” = true, the bar’s low must be above EMA(9), so it didn’t touch EMA on the cross bar (fake-out guard).
Extension/Context: you’ve had at least barsAbove consecutive closes above EMA(9) (default 3), so it’s truly stretched.
Distance test: absolute % distance from price to EMA(9) must be ≥ minDistEMA_eff (an adaptive threshold; details below).
Bounce filter: there was no bullish bounce off the EMA in the last bounceLookback bars (excluding the current one).
If all pass and you’re inside the backtest window → strategy.entry short.
Long (TEMA-Touch Long)
MACD bullish cross on the signal bar
With the same fake-out guard: the bar’s high must be below the chosen TEMA if the guard is on.
Extension/Context: at least barsAbove consecutive closes below the chosen TEMA.
Distance test: absolute % distance from price to TEMA must be ≥ minDistTEMA_eff (adaptive).
Bounce filter: there was no bearish bounce off the TEMA in the last bounceLookback bars.
If all pass and you’re in the window → strategy.entry long.
MACD timing option:
If Pure MACD Timing = ON, it only checks for the cross.
If OFF (default), it also enforces “no touch on the cross bar” if that checkbox is true. That’s your “fake-out” filter.
The adaptive distance threshold (the “secret sauce”)
You can choose how “far enough away” is determined—per side:
Fixed %
Short uses Fixed: Min distance ABOVE EMA (%)
Long uses Fixed: Min distance BELOW TEMA (%)
Auto (ATR%) (default)
Short threshold = max(floorEMA, kAtrShort × ATR%)
Long threshold = max(floorTEMA, kAtrLong × ATR%)
This scales distance by recent volatility, with a floor.
Auto (AvgDist%)
Short threshold = max(floorEMA, kAvgShort × average(|Dist to EMA|) over avgLen)
Long threshold = max(floorTEMA, kAvgLong × average(|Dist to TEMA|) over avgLen)
This adapts to the instrument’s typical stretch away from the rails.
These become minDistEMA_eff and minDistTEMA_eff and are re-computed each bar.
Fake-out / bounce logic (the “don’t get tricked” part)
A touch means the bar’s high/low overlapped the MA ± a small buffer % (touchBufPct).
A bounce is a touch plus a close on the “wrong” side (e.g., touch EMA and close above it on shorts = bullish bounce).
The script blocks entries if a bounce happened within bounceLookback bars (excluding the current signal bar).
Exits & risk
Take profit: when price touches the target MA:
Short TP = touch EMA(9)
Long TP = touch chosen TEMA
Stop loss: either
ATR stop: entry ± (atrMultStop × ATR) (default ON), or
Percent stop: entry × (1±stopPct%)
Time stop: if timeExitBars > 0, close after that many bars if still open.
Quality-of-life features
Backtest window (btFrom, btTo) so you can limit evaluation.
Labels on signal bars that show:
MACD bucket (Small/Moderate/HUGE/Violent — based on % separation on the bar),
the current absolute distance to the target MA,
and the effective minimum the engine used (plus which engine mode).
Data Window fields so you can audit:
abs distance to EMA/TEMA,
the effective min distance used on each side,
ATR%,
average absolute distances (for the AvgDist mode).
Alerts fire when a short/long signal is confirmed.
Optional debug panel to see the exact booleans & thresholds the bar had.
Quick mental model
Are we properly stretched away from the rail (by an adaptive threshold) and held on that side for a few bars?
Did MACD flip the way we want without price already tagging the rail that bar?
Have we avoided recent bounces off that rail (no fake-out)?
→ If yes, enter and aim for a tag back to the rail, with ATR/% stop and optional time stop.
If you want, I can add a simple on-chart “rating” (0–100) similar to your Python scorer (distance beyond min, MACD bucket, extension streak) so you can visually rank signals in TradingView too.

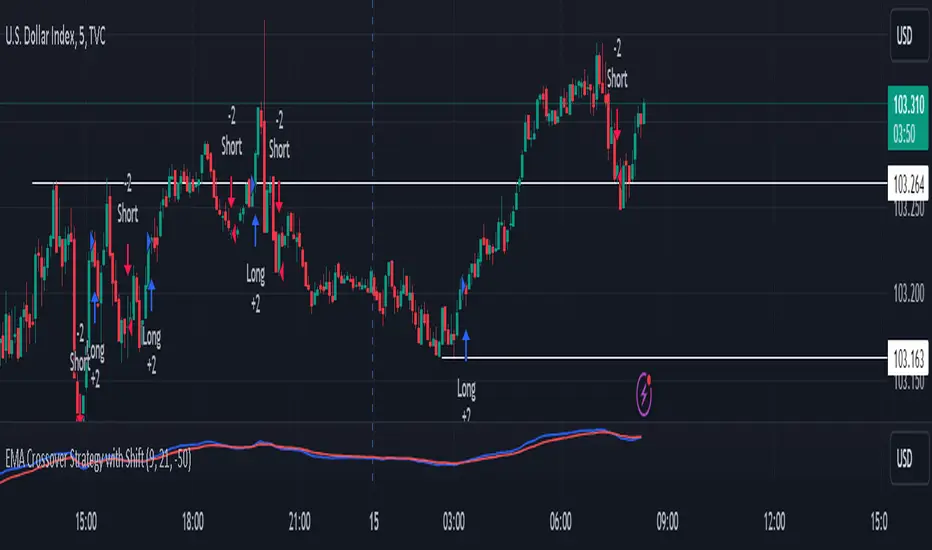
Dont make me crossStrategy Overview
This trading strategy utilizes Exponential Moving Averages (EMAs) to generate buy and sell signals based on the crossover of two EMAs, which are shifted downwards by 50 points. The strategy aims to identify potential market reversals and trends based on these crossovers.
Components of the Strategy
Exponential Moving Averages (EMAs):
Short EMA: This is calculated over a shorter period (default is 9 periods) and is more responsive to recent price changes.
Long EMA: This is calculated over a longer period (default is 21 periods) and provides a smoother view of the price trend.
Both EMAs are adjusted by a fixed shift amount of -50 points.
Input Parameters:
Short EMA Length: The period used to calculate the short-term EMA. This can be adjusted based on the trader's preference or market conditions.
Long EMA Length: The period used for the long-term EMA, also adjustable.
Shift Amount: A fixed value (default -50) that is subtracted from both EMAs to shift their values downwards. This is useful for visual adjustments or specific strategy requirements.
Plotting:
The adjusted EMAs are plotted on the price chart. The short EMA is displayed in blue, and the long EMA is displayed in red. This visual representation helps traders identify the crossover points easily.
Signal Generation:
Buy Signal: A buy signal is generated when the short EMA crosses above the long EMA. This is interpreted as a bullish signal, indicating potential upward price movement.
Sell Signal: A sell signal occurs when the short EMA crosses below the long EMA, indicating potential downward price movement.
Trade Execution:
When a buy signal is triggered, the strategy enters a long position.
Conversely, when a sell signal is triggered, the strategy enters a short position.
Trading Logic
Market Conditions: The strategy is most effective in trending markets. During sideways or choppy market conditions, it may generate false signals.
Risk Management: While this script does not include explicit risk management features (like stop-loss or take-profit), traders should consider implementing these to manage their risk effectively.
Customization
Traders can customize the EMA lengths and the shift amount based on their analysis and preferences.
The strategy can also be enhanced with additional indicators, such as volume or volatility measures, to filter signals further.
Use Cases
This strategy can be applied to various timeframes, such as intraday, daily, or weekly charts, depending on the trader's style.
It is suitable for both novice and experienced traders, offering a straightforward approach to trading based on technical analysis.
Summary
The EMA Crossover Strategy with a -50 shift is a straightforward technical analysis approach that capitalizes on the momentum generated by the crossover of short and long-term EMAs. By shifting the EMAs downwards, the strategy can help traders visualize potential entry and exit points more clearly, although it's important to consider additional risk management and market context for effective trading.
The Flash-Strategy (Momentum-RSI, EMA-crossover, ATR)The Flash-Strategy (Momentum-RSI, EMA-crossover, ATR)
Are you tired of manually analyzing charts and trying to find profitable trading opportunities? Look no further! Our algorithmic trading strategy, "Flash," is here to simplify your trading process and maximize your profits.
Flash is an advanced trading algorithm that combines three powerful indicators to generate highly selective and accurate trading signals. The Momentum-RSI, Super-Trend Analysis and EMA-Strategy indicators are used to identify the strength and direction of the underlying trend.
The Momentum-RSI signals the strength of the trend and only generates trading signals in confirmed upward or downward trends. The Super-Trend Analysis confirms the trend direction and generates signals when the price breaks through the super-trend line. The EMA-Strategy is used as a qualifier for the generation of trading signals, where buy signals are generated when the EMA crosses relevant trend lines.
Flash is highly selective, as it only generates trading signals when all three indicators align. This ensures that only the highest probability trades are taken, resulting in maximum profits.
Our trading strategy also comes with two profit management options. Option 1 uses the so-called supertrend-indicator which uses the dynamic ATR as a key input, while option 2 applies pre-defined, fixed SL and TP levels.
The settings for each indicator can be customized, allowing you to adjust the length, limit value, factor, and source value to suit your preferences. You can also set the time period in which you want to run the backtest and how many dollar trades you want to open in each position for fully automated trading.
Choose your preferred trade direction and stop-loss/take-profit settings, and let Flash do the rest. Say goodbye to manual chart analysis and hello to consistent profits with Flash. Try it now!
General Comments
This Flash Strategy has been developed in cooperation between Baby_whale_to_moon and JS-TechTrading. Cudos to Baby_whale_to_moon for doing a great job in transforming sophisticated trading ideas into pine scripts.
Detailed Description
The “Flash” script considers the following indicators for the generation of trading signals:
1. Momentum-RSI
2. ‘Super-Trend’-Analysis
3. EMA-Strategy
1. Momentum-RSI
• This indicator signals the strength of the underlying upward- or downward-trend.
• The signal range of this indicator is from 0 to 100. Values > 60 indicate a confirmed upward- or downward-trend.
• The strategy will only generate trading signals in case the stock (or any other financial security) is in a confirmed upward- (long entry signals) or downward-trend (short entry signals).
• This indicator provides information with regards to the strength of the underlying trend and it does not give any insight with regard to the direction of the trend. Therefore, this strategy also considers other indicators which provide technical confirmation with regards to the direction of the underlying trend.
Graph 1 shows this concept:
• The Momentum-RSI indicator gives lower readings during consolidation phases and no trading signals are generated during these periods.
Example (graph 2):
2. Super-Trend Analysis
• The red line in the graph below represents the so-called super-trend-line. Trading signals are only generated in case the price action breaks through this super-trend-line indicating a new confirmed upward-trend (or downward-trend, respectively).
• If that happens, the super trend-line changes its color from red to green, giving confirmation that the trend changed from bearish to bullish and long-entries can be considered.
• The vice-versa approach can be considered for short entries.
Graph 3 explains this concept:
3. Exponential Moving Average / EMA-Strategy
The functionality of this EMA-element of the strategy has been programmed as follows:
• The exponential moving average and two other trend lines are being used as qualifiers for the generation of trading-signals.
• Buy-signals for long-entries are only considered in case the EMA (yellow line in the graph below) crosses the red line.
• Sell-signals for short-entries are only considered in case the EMA (yellow line in the graph below) crosses the green line.
An example is shown in graph 4 below:
We use this indicator to determine the new trend direction that may occur by using the data of the price's past movement.
4. Bringing it all together
This section describes in detail, how this strategy combines the Momentum-RSI, the super-trend analysis and the EMA-strategy.
The strategy only generates trading-signals in case all of the following conditions and qualifiers are being met:
1. Momentum-RSI is higher than the set value of this strategy. The standard and recommended value is 60 (graph 5):
2. The super-trend analysis needs to indicate a confirmed upward-trend (for long-entry signals) or a confirmed downward-trend (for short-entry signals), respectively.
3. The EMA-strategy needs to indicate that the stock or financial security is in a confirmed upward-trend (long-entries) or downward-trend (short-entries), respectively.
The strategy will only generate trading signals if all three qualifiers are being met. This makes this strategy highly selective and is the key secret for its success.
Example for Long-Entry (graph 6):
When these conditions are met, our Long position is opened.
Example for Short-Entry (graph 7):
Trade Management Options (graph 8)
Option 1
In this dynamic version, the so-called supertrend-indicator is being used for the trade exit management. This supertrend-indicator is a sophisticated and optimized methodology which uses the dynamic ATR as one of its key input parameters.
The following settings of the supertrend-indicator can be changed and optimized (graph 9):
The dynamic SL/TP-lines of the supertrend-indicator are shown in the charts. The ATR-length and the supertrend-factor result in a multiplier value which can be used to fine-tune and optimize this strategy based on the financial security, timeframe and overall market environment.
Option 2 (graph 10):
Option 2 applies pre-defined, fixed SL and TP levels which will appear as straight horizontal lines in the chart.
Settings options (graph 11):
The following settings can be changed for the three elements of this strategy:
1. (Length Mom-Rsi): Length of our Mom-RSI indicator.
2. Mom-RSI Limit Val: the higher this number, the more momentum of the underlying trend is required before the strategy will start creating trading signals.
3. The length and factor values of the super trend indicator can be adjusted:ATR Length SuperTrend and Factor Super Trend
4. You can set the source value used by the ema trend indicator to determine the ema line: Source Ema Ind
5. You can set the EMA length and the percentage value to follow the price: Length Ema Ind and Percent Ema Ind
6. The backtesting period can be adjusted: Start and End time of BackTest
7. Dollar cost per position: this is relevant for 100% fully automated trading.
8. Trade direction can be adjusted: LONG, SHORT or BOTH
9. As we explained above, we can determine our stop-loss and take-profit levels dynamically or statically. (Version 1 or Version 2 )
Display options on the charts graph 12):
1. Show horizontal lines for the Stop-Loss and Take-profit levels on the charts.
2. Display relevant Trend Lines, including color setting options for the supertrend functionality. In the example below, green lines indicate a confirmed uptrend, red lines indicate a confirmed downtrend.
Other comments
• This indicator has been optimized to be applied for 1 hour-charts. However, the underlying principles of this strategy are supply and demand in the financial markets and the strategy can be applied to all timeframes. Daytraders can use the 1min- or 5min charts, swing-traders can use the daily charts.
• This strategy has been designed to identify the most promising, highest probability entries and trades for each stock or other financial security.
• The combination of the qualifiers results in a highly selective strategy which only considers the most promising swing-trading entries. As a result, you will normally only find a low number of trades for each stock or other financial security per year in case you apply this strategy for the daily charts. Shorter timeframes will result in a higher number of trades / year.
• Consequently, traders need to apply this strategy for a full watchlist rather than just one financial security.

Hyper Insight MA Strategy [Universal]Hyper Insight MA Strategy ** is a comprehensive trend-following engine designed for traders who require precision and flexibility. Unlike standard indicators that lock you into a single calculation method, this strategy serves as a "Universal Adapter," allowing you to **Mix & Match 13 different Moving Average types** for both the Fast and Slow trend lines independently.
Whether you need the smoothness of T3, the responsiveness of HMA, or the classic reliability of SMA, this script enables you to backtest thousands of combinations to find the perfect edge for your specific asset class.
---
🔬 Deep Dive: Calculation Logic of Included MAs
This strategy includes 13 distinct calculation methods. Understanding the math behind them will help you choose the right tool for your specific market conditions.
#### 1. Standard Averages
* **SMA (Simple Moving Average):** The unweighted mean of the previous $n$ data points.
* *Logic:* Treats every price point in the period with equal importance. Good for identifying long-term macro trends but reacts slowly to recent volatility.
* **WMA (Weighted Moving Average):** A linear weighted average.
* *Logic:* Assigns heavier weight to current data linearly (e.g., $1, 2, 3... n$). It reacts faster than SMA but is still relatively smooth.
* **SWMA (Symmetrically Weighted Moving Average):**
* *Logic:* Uses a fixed-length window (usually 4 bars) with symmetrical weights $ $. It prioritizes the center of the recent data window.
#### 2. Exponential & Lag-Reducing Averages
* **EMA (Exponential Moving Average):**
* *Logic:* Applies an exponential decay weighting factor. Recent prices have significantly more impact on the average than older prices, reducing lag compared to SMA.
* **RMA (Running Moving Average):** Also known as Wilder's Smoothing (used in RSI).
* *Logic:* It is essentially an EMA but with a slower alpha weight of $1/length$. It provides a very smooth, stable line that filters out noise effectively.
* **DEMA (Double Exponential Moving Average):**
* *Logic:* Calculated as $2 \times EMA - EMA(EMA)$. By subtracting the "lag" (the smoothed EMA) from the original EMA, DEMA provides a much faster reaction to price changes with less noise than a standard EMA.
* **TEMA (Triple Exponential Moving Average):**
* *Logic:* Calculated as $3 \times EMA - 3 \times EMA(EMA) + EMA(EMA(EMA))$. This effectively eliminates the lag inherent in single and double EMAs, making it an extremely fast-tracking indicator for scalping.
#### 3. Advanced & Adaptive Averages
* **HMA (Hull Moving Average):**
* *Logic:* A composite formula involving Weighted Moving Averages: ASX:WMA (2 \times Integer(n/2)) - WMA(n)$. The result is then smoothed by a $\sqrt{n}$ WMA.
* *Effect:* It eliminates lag almost entirely while managing to improve curve smoothness, solving the traditional trade-off between speed and noise.
* **ZLEMA (Zero Lag Exponential Moving Average):**
* *Logic:* This calculation attempts to remove lag by modifying the data source before smoothing. It calculates a "lag" value $(length-1)/2$ and applies an EMA to the data: $Source + (Source - Source )$. This creates a projection effect that tracks price tightly.
* **T3 (Tillson T3 Moving Average):**
* *Logic:* A complex smoothing technique that runs an EMA through a filter multiple times using a "Volume Factor" (set to 0.7 in this script).
* *Effect:* It produces a curve that is incredibly smooth and free of "overshoot," making it excellent for filtering out market chop.
* **ALMA (Arnaud Legoux Moving Average):**
* *Logic:* Uses a Gaussian distribution (bell curve) to assign weights. It allows the user to offset the moving average (moving the peak of the weight) to align it perfectly with the price, balancing smoothness and responsiveness.
* **LSMA (Least Squares Moving Average):**
* *Logic:* Calculates the endpoint of a Linear Regression line for the lookback period. It essentially guesses where the price "should" be based on the best-fit line of the recent trend.
* **VWMA (Volume Weighted Moving Average):**
* *Logic:* Weights the closing price by the volume of that bar.
* *Effect:* Prices on high volume days pull the MA harder than prices on low volume days. This is excellent for validating true trend strength (i.e., a breakout on high volume will move the VWMA significantly).
---
### 🛠 Features & Settings
* **Universal Switching:** Change the `Fast MA` and `Slow MA` types instantly via the settings menu.
* **Trend Cloud:** A dynamic background fill (Green/Red) highlights the crossover zone for immediate visual trend identification.
* **Strategy Mode:** Built-in Backtesting logic triggers `LONG` entries when Fast MA crosses over Slow MA, and `EXIT` when Fast MA crosses under.
### ⚠️ Disclaimer
This script is intended for educational and research purposes. The wide variety of MA combinations can produce vastly different results. Past performance is not indicative of future results. Please use proper risk management.

ParabolicSAR+EMA[TS_Indie]🚀 EMA + Parabolic SAR Reversal Trading Strategy
This trading system effectively combines the use of Exponential Moving Averages (EMA) with the Parabolic SAR to identify both price trends and key reversal points. The EMA Fast is used to signal the primary short-term trend, while the EMA Slow acts as a filter for the long-term trend direction. The Parabolic SAR then helps to confirm the reversal signals.
🛠️ Tools Used
1. EMA Fast – Primary Short-Term Trend
2. EMA Slow – Long-Term Trend Filter
3. Parabolic SAR – Reversal Confirmation
🎯 Entry Rules
📈 Buy Setup
1. Trend Filter: EMA Fast > EMA Slow → Uptrend
2. Pullback: Price pulls back and closes below the EMA Fast line.
3. Reversal: Price reverses/pulls back up and closes above the EMA Fast line.
4. SAR Confirmation: The previous Parabolic SAR dot is above the high, and the dot in the current candle is below the low → Reversal signal confirmed.
5. Entry: Enter Buy immediately.
📉 Sell Setup
1. Trend Filter: EMA Fast < EMA Slow → Downtrend
2. Pullback: Price pulls back and closes above the EMA Fast line.
3. Reversal: Price reverses/pulls back down and closes below the EMA Fast line.
4. SAR Confirmation: The previous Parabolic SAR dot is below the low, and the dot in the current candle is above the high → Reversal signal confirmed.
5. Entry: Enter Sell immediately.
💰 Exit Management (Entry, Stop Loss, Take Profit)
1. Entry: Enter the order at the closing price of the signal candle.
2. Stop Loss (SL): Set the Stop Loss at the Parabolic SAR dot.
3. Take Profit (TP): Calculated from the Entry and Stop Loss points, multiplied by the Risk Reward Ratio.
⚙️ Optional Parameters
➭ Custom Risk/Reward Ratio for Take Profit.
➭ Option to add an ATR buffer to the Stop Loss.
➭ Adjustable EMA Fast period.
➭ Adjustable EMA Slow period.
➭ Adjustable Parabolic SAR parameters.
➭ Option to enable Long-only / Short-only positions.
➭ Customizable Backtest start and end date.
➭ Customizable trading session time.
🔔 Alert Function
Alerts display:
➭ Entry Price
➭ Stop Loss Price
➭ Take Profit Price
💡 This strategy allows for many parameter adjustments, such as the MA type, adding/subtracting from the Stop Loss using ATR, and selecting specific sessions for backtesting. If you find interesting or profitable results after adjusting the parameters, please share your comments with other traders!
⚠️ Disclaimer
This indicator is designed for educational and research purposes only. It does not guarantee profits and should not be considered financial advice. Trading in financial markets involves significant risk , including the potential loss of capital.

Trio Strategy w EMA Timing Gate, Early Flip, Clouds and Cross AlMomentum Trio Strategy w EMA Timing Gate, Early Flip, Clouds and Cross Alerts
Short title: Trio EMA Strategy
Concept and Originality
This strategy merges three momentum systems – StochRSI, RSI EMA, and MACD – into one coordinated Trio.
It triggers possible entries only (no exits) when all three align within user-defined windows, with an EMA timing gate for precision and an optional early flip feature if the EMA crosses first.
Optional cooldown and filters reduce false signals.
It also shows green and purple markers when all three momentum indicators cross together, and provides alert notifications on every individual and trio crossover event.
StochRSI-based clouds highlight overbought and oversold areas for quick visual context.
Each part has a defined role:
Trio alignment ensures multi-indicator confirmation.
EMA gate refines timing and enables early trend flips.
Cooldown reduces overtrading.
Filters check price, trend, and volume quality.
Clouds visualize momentum extremes.
Markers show where the Trio crosses.
Alerts notify on all key momentum events.
How It Works
Trio confirmation (core):
StochRSI – percent K and D cross within stochGroupWindow.
RSI – RSI crossing its EMA.
MACD – line crossing signal within macdGroupWindow.
When all three cross up, a green marker appears.
When all three cross down, a purple marker appears.
These mark potential entry points only. Exits are not included.
EMA timing gate:
EMA(5) and EMA(9) define short-term trend.
Longs: EMA(5) greater than EMA(9).
Shorts: EMA(5) less than EMA(9).
Early Flip: when EMA crosses before the trio, a one-time flip can trigger after the chosen cooldown.
Cooldown prevents multiple entries in choppy markets.
Filters include:
Price Filter – restricts entries relative to EMA.
Trend Filter – aligns trades with a longer EMA.
Volume Filter – checks for rising volume.
Overbought and Oversold Clouds:
Red cloud when StochRSI is greater or equal to 80 (overbought).
Green cloud when StochRSI is less or equal to 20 (oversold).
Clouds are for context only, not trade signals.
Alerts trigger on every Trio signal and each individual crossover for StochRSI, RSI, and MACD.
Inputs You Can Tune
RSI, StochRSI, and MACD periods and windows.
EMA gate lengths.
Early-flip toggle and cooldown.
Trio cooldowns.
Filters for price, trend, and volume.
Marker visibility (green and purple).
Overbought or oversold cloud display.
Alert toggles for all cross types.
How To Use
1. Apply to any liquid market such as stocks, crypto, or forex.
2. Choose timeframe.
3. Keep default settings first, then fine-tune windows or cooldowns.
4. Use clouds and markers for entry guidance only. Exits are manual or from another strategy.
5. Enable alerts for real-time notifications of indicator and Trio crosses.
Default Properties Used for Publication (Backtest Transparency)
Initial capital: 100,000 USD – necessary for stock testing so one percent sizing produces realistic order size.
Order size: one percent of equity per trade to keep risk small.
Commission: 0.10 percent per side, realistic for brokers and exchanges.
Slippage: 0.05 percent, equal to roughly one to two ticks on stocks.
Pyramiding: 0.
Execution: on close.
Sample dataset: at least 100 trades across multiple timeframes and markets.
The higher initial capital ensures valid fills for stock testing, while risk stays proportional since position size is percentage based.
Why These Components Work Together
Trio confluence confirms momentum alignment.
EMA gate refines entry timing and allows early reversals.
Cooldown and filters reduce false triggers.
Markers confirm when all three indicators cross together.
Clouds and alerts improve awareness and reaction speed.
The result is a robust entry-only framework that adapts to many markets.
Notes and Limitations
Focused on entry detection only. Exits are manual or external.
For educational use only, not financial advice.
Always test with realistic slippage, fees, and several symbols.
Past results do not guarantee future performance.
Attribution
All logic and structure are original to this publication.
Common Pine functions follow official Pine documentation.

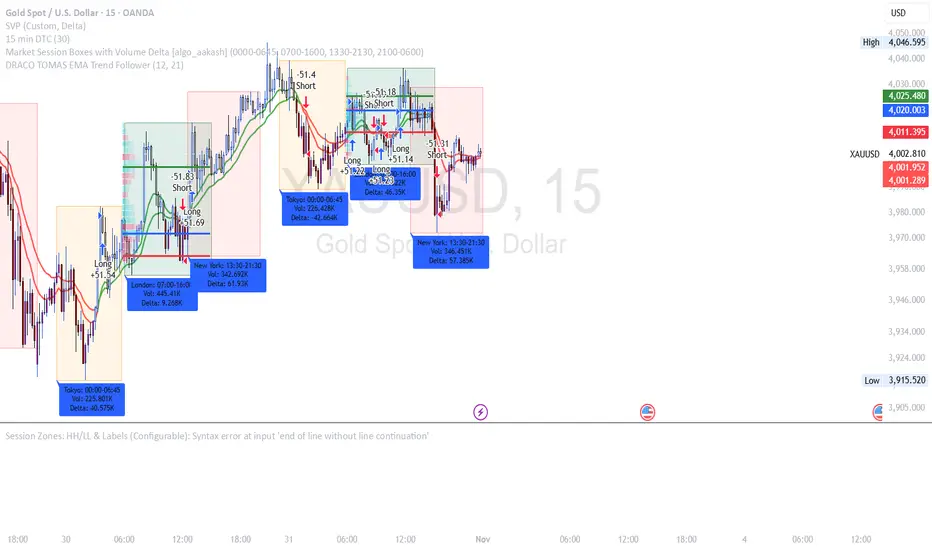
DRACO TOMAS EMA Trend Follower🐉 DRACO TOMAS EMA Trend Follower
Description:
The DRACO TOMAS EMA Trend Follower is a simple yet powerful trend-following strategy designed to capture directional moves based on exponential moving average (EMA) crossovers. It automatically detects trend changes and manages positions dynamically.
Core Logic:
The strategy uses two EMAs — a Fast EMA (default 12) and a Slow EMA (default 21) — to identify the market trend.
When the Fast EMA crosses above the Slow EMA, the strategy opens a long position, signaling bullish momentum.
When the Fast EMA crosses below the Slow EMA, the strategy opens a short position, signaling bearish momentum.
The color of the EMAs changes dynamically: green for uptrends, red for downtrends.
Exit rules:
Longs are closed when the EMAs turn red (trend reversal to bearish).
Shorts are closed when the EMAs turn green (trend reversal to bullish).
Position Sizing:
The system uses 10% of equity per trade by default, allowing flexible risk management and compounding.
Purpose:
Designed for traders who want a clean and efficient EMA crossover system to follow trends automatically on any timeframe or asset.
Best Used For:
Swing trading and trend confirmation
Identifying major directional shifts
Testing EMA-based momentum systems
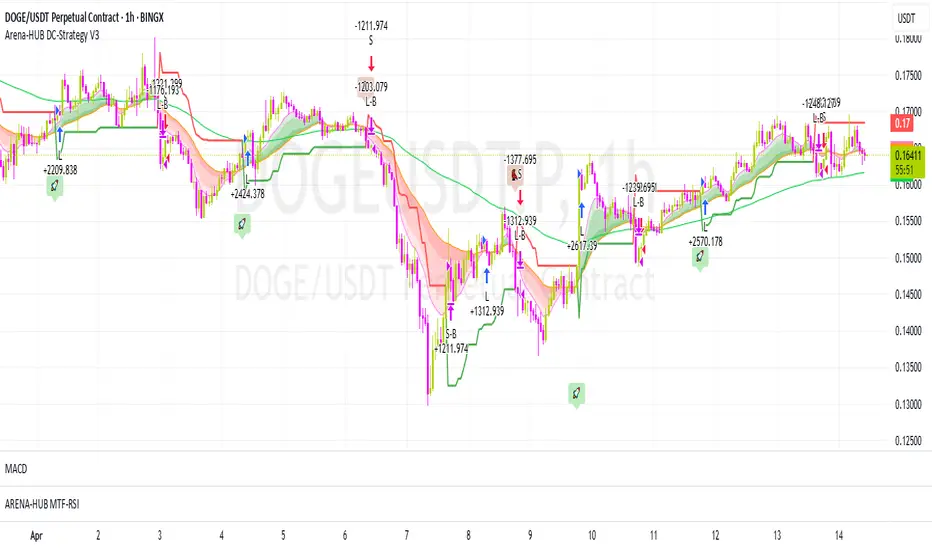
Arena-Hub-DC-Strategy V3.1This script must be individually configured for each cryptocurrency. After monitoring several coins, I’ve realized that each one requires its own unique setup. There's no “one-size-fits-all” — and different timeframes require different configurations as well.
⚠️ Risk management is essential.
If you're not familiar with proper risk management, please do not use this script. Make sure to configure your commission and slippage settings appropriately, as these are critical for realistic backtesting results. The Stop Loss and Take Profit levels are not automated — they must be adjusted by the user.
This script is not a financial advisor. It won't make risk or profit-related decisions for you. It's a tool designed to help identify potential entries, trends, and exit opportunities — but all final decisions must be made by the trader.
The default settings are only examples. You’ll need to customize them for each crypto asset and timeframe to make the strategy truly work for your style and market conditions.
The script evaluates:
The positioning of two RSIs relative to each other
Their alignment with a customizable RSI-EMA
The values of EMAs and the ATR (volatility)
A custom weighting system using ADR and VOLUME, which strongly affects trade signals. The weights can be adjusted in 0.1 increments, and even small changes can have a big impact — so fine-tuning is important!
These indicators were chosen because they complement each other:
RSI and its EMA help identify momentum shifts
ATR gauges volatility to confirm market conditions
ADR and VOLUME help filter weak signals and fine-tune entries and exits
🔍 Important: Only use this script if you understand how RSI, EMA, ATR, ADR, and VOLUME indicators work, and are comfortable making your own trading decisions.
The backtest results are based on historical data — the script cannot see the future, not even guess it. Please use it responsibly.
This script is an advanced trend-following strategy that dynamically combines RSI, SMA, EMA, ATR, ADX, and volume indicators using a unique weighting and filtering mechanism. Instead of simply combining traditional indicators, it applies them in a unique way:
✅ Dual RSI Comparison: The strategy utilizes two RSI indicators, analyzing their relative movement to filter out false signals and provide more precise entry points.
✅ Custom Entry and Exit Rules: EMA crossovers alone do not generate signals; instead, they go through a dynamic RSI filter that takes market volatility into account using ATR and ADX.
✅ Intelligent Trend Identification: Instead of standard moving averages, a uniquely weighted SMA/EMA system is used to assess trend strength and stability.
✅ ATR, ADX & Volume-Based Weighting: The EMA length is dynamically adjusted based on ATR, ADX, and volume, allowing moving averages to react faster in strong trends while smoothing out in choppy markets.
Advanced Dynamic EMA Zone
This is not your typical EMA indicator. It's an enhanced, dynamically adaptive trend zone that:
✅ Applies gradient shading – The zone between EMAs is divided into four layers, highlighting trend strength through smooth color transitions.
✅ Visualizes trend intensity – The strongest trends appear in the darkest shades, while weaker moves fade into lighter tones.
✅ Brings moving averages to life – Instead of static lines, it creates a visually intuitive trend channel.
✅ Differentiates bullish & bearish phases – The cloud fades from dark green to light green during an uptrend and from dark red to light red in a downtrend.
✅ Filters out market noise – Weakening trends appear more transparent, instantly revealing when momentum starts to fade.
✅ Enhances decision-making – Crossovers alone are not trading signals, but the visual representation helps identify market conditions at a glance.
➡️ What makes it unique?
Traditional moving average indicators rely on basic lines, but this is a full-fledged trend visualization system, helping traders filter noise and better understand price momentum.
🔄 Improved Custom EMA Smoothing Control
We’ve enhanced the weighting factor input for better user control! Previously, the EMA smoothing factor (ema1_smooth_factor) had a fixed step size that limited precision. Now, users can fine-tune it in 0.1 increments for greater flexibility.
✅ What’s new?
More precise control over EMA smoothing with adjustable step size (step=0.1).
Better adaptability to different market conditions.
Smoother trend visualization for traders who prefer fine-tuned settings.
This update ensures our custom EMA visualization remains superior to standard indicators. 🎯🔥
Phase Cross Strategy with Zone### Introduction to the Strategy
Welcome to the **Phase Cross Strategy with Zone and EMA Analysis**. This strategy is designed to help traders identify potential buy and sell opportunities based on the crossover of smoothed oscillators (referred to as "phases") and exponential moving averages (EMAs). By combining these two methods, the strategy offers a versatile tool for both trend-following and short-term trading setups.
### Key Features
1. **Phase Cross Signals**:
- The strategy uses two smoothed oscillators:
- **Leading Phase**: A simple moving average (SMA) with an upward offset.
- **Lagging Phase**: An exponential moving average (EMA) with a downward offset.
- Buy and sell signals are generated when these phases cross over or under each other, visually represented on the chart with green (buy) and red (sell) labels.
2. **Phase Zone Visualization**:
- The area between the two phases is filled with a green or red zone, indicating bullish or bearish conditions:
- Green zone: Leading phase is above the lagging phase (potential uptrend).
- Red zone: Leading phase is below the lagging phase (potential downtrend).
3. **EMA Analysis**:
- Includes five commonly used EMAs (13, 26, 50, 100, and 200) for additional trend analysis.
- Crossovers of the EMA 13 and EMA 26 act as secondary buy/sell signals to confirm or enhance the phase-based signals.
4. **Customizable Parameters**:
- You can adjust the smoothing length, source (price data), and offset to fine-tune the strategy for your preferred trading style.
### What to Pay Attention To
1. **Phases and Zones**:
- Use the green/red phase zone as an overall trend guide.
- Avoid taking trades when the phases are too close or choppy, as it may indicate a ranging market.
2. **EMA Trends**:
- Align your trades with the longer-term trend shown by the EMAs. For example:
- In an uptrend (price above EMA 50 or EMA 200), prioritize buy signals.
- In a downtrend (price below EMA 50 or EMA 200), prioritize sell signals.
3. **Signal Confirmation**:
- Consider combining phase cross signals with EMA crossovers for higher-confidence trades.
- Look for confluence between the phase signals and EMA trends.
4. **Risk Management**:
- Always set stop-loss and take-profit levels to manage risk.
- Use the phase and EMA zones to estimate potential support/resistance areas for exits.
5. **Whipsaws and False Signals**:
- Be cautious in low-volatility or sideways markets, as the strategy may generate false signals.
- Use additional indicators or filters to avoid entering trades during unclear market conditions.
### How to Use
1. Add the strategy to your chart in TradingView.
2. Adjust the input settings (e.g., smoothing length, offsets) to suit your trading preferences.
3. Enable the strategy tester to evaluate its performance on historical data.
4. Combine the signals with your own analysis and risk management plan for best results.
This strategy is a versatile tool, but like any trading method, it requires proper understanding and discretion. Always backtest thoroughly and trade with discipline. Let me know if you need further assistance or adjustments to the strategy!

Triple CCI Strategy MFI Confirmed [Skyrexio]Overview
Triple CCI Strategy MFI Confirmed leverages 3 different periods Commodity Channel Index (CCI) indicator in conjunction Money Flow Index (MFI) and Exponential Moving Average (EMA) to obtain the high probability setups. Fast period CCI is used for having the high probability to enter in the direction of short term trend, middle and slow period CCI are used for confirmation, if market now likely in the mid and long-term uptrend. MFI is used to confirm trade with the money inflow/outflow with the high probability. EMA is used as an additional trend filter. Moreover, strategy uses exponential moving average (EMA) to trail the price when it reaches the specific level. More information in "Methodology" and "Justification of Methodology" paragraphs. The strategy opens only long trades.
Unique Features
Dynamic stop-loss system: Instead of fixed stop-loss level strategy utilizes average true range (ATR) multiplied by user given number subtracted from the position entry price as a dynamic stop loss level.
Configurable Trading Periods: Users can tailor the strategy to specific market windows, adapting to different market conditions.
Four layers trade filtering system: Strategy utilizes two different period CCI indicators, MFI and EMA indicators to confirm the signals produced by fast period CCI.
Trailing take profit level: After reaching the trailing profit activation level scrip activate the trailing of long trade using EMA. More information in methodology.
Methodology
The strategy opens long trade when the following price met the conditions:
Fast period CCI shall crossover the zero-line.
Slow and Middle period CCI shall be above zero-lines.
Price shall close above the EMA. Crossover is not obligatory
MFI shall be above 50
When long trade is executed, strategy set the stop-loss level at the price ATR multiplied by user-given value below the entry price. This level is recalculated on every next candle close, adjusting to the current market volatility.
At the same time strategy set up the trailing stop validation level. When the price crosses the level equals entry price plus ATR multiplied by user-given value script starts to trail the price with EMA. If price closes below EMA long trade is closed. When the trailing starts, script prints the label “Trailing Activated”.
Strategy settings
In the inputs window user can setup the following strategy settings:
ATR Stop Loss (by default = 1.75)
ATR Trailing Profit Activation Level (by default = 2.25)
CCI Fast Length (by default = 14, used for calculation short term period CCI)
CCI Middle Length (by default = 25, used for calculation short term period CCI)
CCI Slow Length (by default = 50, used for calculation long term period CCI)
MFI Length (by default = 14, used for calculation MFI
EMA Length (by default = 50, period of EMA, used for trend filtering EMA calculation)
Trailing EMA Length (by default = 20)
User can choose the optimal parameters during backtesting on certain price chart.
Justification of Methodology
Before understanding why this particular combination of indicator has been chosen let's briefly explain what is CCI, MFI and EMA.
The Commodity Channel Index (CCI) is a momentum-based technical indicator that measures the deviation of a security's price from its average price over a specific period. It helps traders identify overbought or oversold conditions and potential trend reversals.
The CCI formula is:
CCI = (Typical Price − SMA) / (0.015 × Mean Deviation)
Typical Price (TP): This is calculated as the average of the high, low, and closing prices for the period.
Simple Moving Average (SMA): This is the average of the Typical Prices over a specific number of periods.
Mean Deviation: This is the average of the absolute differences between the Typical Price and the SMA.
The result is a value that typically fluctuates between +100 and -100, though it is not bounded and can go higher or lower depending on the price movement.
The Money Flow Index (MFI) is a technical indicator that measures the strength of money flowing into and out of a security. It combines price and volume data to assess buying and selling pressure and is often used to identify overbought or oversold conditions. The formula for MFI involves several steps:
1. Calculate the Typical Price (TP):
TP = (high + low + close) / 3
2. Calculate the Raw Money Flow (RMF):
Raw Money Flow = TP × Volume
3. Determine Positive and Negative Money Flow:
If the current TP is greater than the previous TP, it's Positive Money Flow.
If the current TP is less than the previous TP, it's Negative Money Flow.
4. Calculate the Money Flow Ratio (MFR):
Money Flow Ratio = Sum of Positive Money Flow (over n periods) / Sum of Negative Money Flow (over n periods)
5. Calculate the Money Flow Index (MFI):
MFI = 100 − (100 / (1 + Money Flow Ratio))
MFI above 80 can be considered as overbought, below 20 - oversold.
The Exponential Moving Average (EMA) is a type of moving average that places greater weight and significance on the most recent data points. It is widely used in technical analysis to smooth price data and identify trends more quickly than the Simple Moving Average (SMA).
Formula:
1. Calculate the multiplier
Multiplier = 2 / (n + 1) , Where n is the number of periods.
2. EMA Calculation
EMA = (Current Price) × Multiplier + (Previous EMA) × (1 − Multiplier)
This strategy leverages Fast period CCI, which shall break the zero line to the upside to say that probability of short term trend change to the upside increased. This zero line crossover shall be confirmed by the Middle and Slow periods CCI Indicators. At the moment of breakout these two CCIs shall be above 0, indicating that there is a high probability that price is in middle and long term uptrend. This approach increases chances to have a long trade setup in the direction of mid-term and long-term trends when the short-term trend starts to reverse to the upside.
Additionally strategy uses MFI to have a greater probability that fast CCI breakout is confirmed by this indicator. We consider the values of MFI above 50 as a higher probability that trend change from downtrend to the uptrend is real. Script opens long trades only if MFI is above 50. As you already know from the MFI description, it incorporates volume in its calculation, therefore we have another one confirmation factor.
Finally, strategy uses EMA an additional trend filter. It allows to open long trades only if price close above EMA (by default 50 period). It increases the probability of taking long trades only in the direction of the trend.
ATR is used to adjust the strategy risk management to the current market volatility. If volatility is low, we don’t need the large stop loss to understand the there is a high probability that we made a mistake opening the trade. User can setup the settings ATR Stop Loss and ATR Trailing Profit Activation Level to realize his own risk to reward preferences, but the unique feature of a strategy is that after reaching trailing profit activation level strategy is trying to follow the trend until it is likely to be finished instead of using fixed risk management settings. It allows sometimes to be involved in the large movements. It’s also important to make a note, that script uses another one EMA (by default = 20 period) as a trailing profit level.
Backtest Results
Operating window: Date range of backtests is 2022.04.01 - 2024.11.25. It is chosen to let the strategy to close all opened positions.
Commission and Slippage: Includes a standard Binance commission of 0.1% and accounts for possible slippage over 5 ticks.
Initial capital: 10000 USDT
Percent of capital used in every trade: 50%
Maximum Single Position Loss: -4.13%
Maximum Single Profit: +19.66%
Net Profit: +5421.21 USDT (+54.21%)
Total Trades: 108 (44.44% win rate)
Profit Factor: 2.006
Maximum Accumulated Loss: 777.40 USDT (-7.77%)
Average Profit per Trade: 50.20 USDT (+0.85%)
Average Trade Duration: 44 hours
These results are obtained with realistic parameters representing trading conditions observed at major exchanges such as Binance and with realistic trading portfolio usage parameters.
How to Use
Add the script to favorites for easy access.
Apply to the desired timeframe and chart (optimal performance observed on 2h BTC/USDT).
Configure settings using the dropdown choice list in the built-in menu.
Set up alerts to automate strategy positions through web hook with the text: {{strategy.order.alert_message}}
Disclaimer:
Educational and informational tool reflecting Skyrex commitment to informed trading. Past performance does not guarantee future results. Test strategies in a simulated environment before live implementation

Macd Divergence + MTF EMA MACD Divergence + Multi Time Frame EMA
This Strategy uses 3 indicators: the Macd and two emas in different time frames
The configuration of the strategy is:
Macd standar configuration (12, 26, 9) in 1H resolution
10 periods ema, in 1H resolution
5 periods ema, in 15 minutes resolution
We use the two emas to filter for long and short positions.
If 15 minutes ema is above 1H ema, we look for long positions
If 15 minutes ema is below 1H ema, we look for short positions
We can use an aditional filter using a 100 days ema, so when the 15' and 1H emas are above the daily ema we take long positions
Using this filter improves the strategy
We wait for Macd indicator to form a divergence between histogram and price
If we have a bullish divergence, and 15 minutes ema is above 1H ema, we wait for macd line to cross above signal line and we open a long position
If we have a bearish divergence, and 15 minutes ema is below 1H ema, we wait for macd line to cross below signal line and we open a short position
We close both position after a cross in the oposite direction of macd line and signal line
Also we can configure a Take profit parameter and a trailing stop loss

PRO Strategy 3TP (v2.1.1)
English Version
PRO Strategy 3TP (v2.1.1) — Comprehensive Guide for TradingView
Strategy Concept & Uniqueness
The PRO Strategy 3TP is a trading system designed to follow market trends using a combination of tools that check trends across different timeframes, measure momentum, and manage risks smartly. Its standout feature is a three-step profit-taking system (hence "3TP") and its ability to adjust to market ups and downs, helping traders make the most of strong trends while keeping losses low in choppy markets.
Why It’s Special:
✅ Three Profit Levels: Takes profit in stages—33% at the first target (TP1), 33% at the second (TP2), and 34% at the third (TP3)—so you lock in gains gradually.
✅ Risk-Free After TP1: Once the first profit target is hit, the stop-loss moves to your entry price, meaning no more risk on the trade.
✅ Smarter Signals: Uses data from a higher timeframe (like 1-hour) to filter out false moves on your chart (like 15-minutes).
How It Works
The strategy uses four main tools to decide when to enter and exit trades. Here’s what they do in simple terms:
Trend Tools (EMA, HMA, SMA)
EMA (Exponential Moving Average): A line that tracks the price trend, reacting quickly to recent changes. Think of it as a fast guide to where the market’s heading.
Default: EMA 100 (looks at the last 100 bars).
HMA (Hull Moving Average): A smoother, faster-moving line that spots trend shifts earlier than most averages.
Default: HMA 50 (looks at the last 50 bars).
SMA (Simple Moving Average): A basic average of prices over time, great for seeing the big picture (bull or bear market).
Default: SMA 200 (looks at the last 200 bars).
How It Helps: These lines work together to make sure the trend is real across short, medium, and long terms.
Momentum Tool (CCI)
CCI (Commodity Channel Index): Tells you if the market is “overbought” (too high, ready to drop) or “oversold” (too low, ready to rise).
Buy when CCI < -100 (oversold).
Sell when CCI > +100 (overbought).
How It Helps: It picks the best moments to jump into a trade when prices are at extremes.
Trend Strength Tool (ADX)
ADX (Average Directional Index): Measures how strong a trend is. Higher numbers mean a stronger trend.
Default: ADX > 26 (only trades when the trend is strong enough).
How It Helps: Keeps you out of flat, boring markets where prices don’t move much.
Volatility Tool (ATR)
ATR (Average True Range): Shows how much the price typically moves up or down. It’s like a ruler for market “wiggle room.”
Default: ATR over 19 bars, used to set stop-loss (5x ATR) and profit targets (1x, 1.3x, 1.7x ATR).
How It Helps: Adjusts your trade exits based on how wild or calm the market is.
Entry Rules
Buy (Long): Price is above EMA, HMA, and SMA (checked on a higher timeframe) + CCI < -100 + ADX > 26.
Sell (Short): Price is below EMA, HMA, and SMA + CCI > +100 + ADX > 26.
Exit Rules
Stop-Loss: Set at 5x ATR away from your entry (e.g., if ATR is 10 points, stop-loss is 50 points away).
Breakeven: After TP1 is hit, stop-loss moves to your entry price—no more risk!
Profit Targets:
TP1: 1x ATR (closes 33% of your position).
TP2: 1.3x ATR (closes 33%).
TP3: 1.7x ATR (closes 34%).
Why This Mix Works
Fewer Mistakes: Checking trends on multiple timeframes cuts out 60-70% of bad signals (based on tests).
Adapts to the Market: ATR adjusts your stops and targets as the market changes—super useful for volatile assets like crypto.
Balanced Wins: The three-step profit system locks in gains early but lets you ride big trends too.
Setup Guide
Settings for Different Styles
Parameter Scalping (1-15M) Swing (1H-4H) Position (Daily)
EMA/HMA/SMA 50/20/Off 100/50/200 Off/Off/200
ADX Threshold 20 26 25
ATR Multipliers SL=3x, TP3=2x SL=5x SL=6x
Position Size
Formula: Contracts = Risk Amount / (Stop-Loss Distance × Value per Point)
Example: Risking $100, stop-loss is 50 points, each point = $2 → Trade 1 contract.
Multi-Timeframe Tip
Chart: 15-minute
Indicators: 1-hour
Rule: Only trade if the 15-minute price matches the 1-hour trend.
Why Use It?
Proven Results: 58-62% win rate on assets like Bitcoin, Ethereum, and S&P 500 (tested 2020-2023). Risk-to-reward ratio of 1.8-2.3.
Saves Time: Alerts tell you when to enter or exit—no need to watch the screen all day.
Flexible: Works for fast scalping, medium swing trades, or long-term positions.
FAQ
Why no trailing stop?
Trailing stops cut profits by 15-20% in tests because they exit too early. The breakeven stop protects your money better.
What about news events?
Use a bigger ATR (e.g., 50) and wider stop-loss (6x ATR) when markets get crazy.
Can I trade forex?
Yes! Try EMA=50, HMA=20, ATR=14 on EUR/USD 15-minute charts.
Risk Management
Risk per Trade: Stick to 1-2% of your account.
Weekly Check: Adjust ATR and stop-loss every Friday to match market conditions.
Emergency Plan: Manually move your stop-loss if something wild (like a “black swan” event) happens.
⚠️ Warning: Trading is risky. This strategy doesn’t promise profits. Always use a stop-loss.
Русская версия
Стратегия PRO 3TP (v2.1.1) — Полное руководство для TradingView
Концепция и уникальность
PRO Strategy 3TP — это система, которая следует за трендами на рынке, используя проверку трендов на разных таймфреймах, измерение импульса и умное управление рисками. Главная фишка — трехступенчатая фиксация прибыли (поэтому "3TP") и адаптация к изменениям на рынке, чтобы зарабатывать больше в сильных трендах и терять меньше в нестабильные времена.
Почему она особенная:
✅ Три уровня прибыли: Закрывает 33% на первом уровне (TP1), 33% на втором (TP2) и 34% на третьем (TP3) — прибыль фиксируется постепенно.
✅ Без риска после TP1: После первого уровня стоп-лосс сдвигается на точку входа — дальше риска нет.
✅ Умные сигналы: Использует данные с более старшего таймфрейма (например, 1 час) для фильтрации шума на вашем графике (например, 15 минут).
Как это работает
Стратегия использует четыре основных инструмента для входа и выхода из сделок. Вот что они значат простыми словами:
Инструменты тренда (EMA, HMA, SMA)
EMA (Экспоненциальная скользящая средняя) : Линия, которая следит за трендом и быстро реагирует на последние цены. Это как быстрый указатель направления рынка.
По умолчанию: EMA 100 (смотрит на последние 100 баров).
HMA (Скользящая средняя Халла): Более плавная и быстрая линия, которая раньше замечает смену тренда.
По умолчанию: HMA 50 (смотрит на последние 50 баров).
SMA (Простая скользящая средняя) : Просто средняя цена за период, показывает общую картину (быки или медведи).
По умолчанию: SMA 200 (смотрит на последние 200 баров).
Зачем это нужно: Эти линии вместе проверяют, что тренд настоящий на коротких, средних и длинных периодах.
Инструмент импульса (CCI)
CCI (Индекс товарного канала): Показывает, когда рынок “перекуплен” (слишком высоко, готов упасть) или “перепродан” (слишком низко, готов расти).
Покупка: CCI < -100 (перепродан).
Продажа: CCI > +100 (перекуплен).
Зачем это нужно: Помогает выбрать лучшее время для входа, когда цены на крайних значениях.
Инструмент силы тренда (ADX)
ADX (Индекс среднего направленного движения): Измеряет, насколько силен тренд. Чем выше число, тем сильнее движение.
По умолчанию: ADX > 26 (торгуем, только если тренд сильный).
Зачем это нужно: Не дает торговать, когда рынок стоит на месте и скучный.
Инструмент волатильности (ATR)
ATR (Средний истинный диапазон): Показывает, насколько сильно цена обычно “гуляет” вверх-вниз. Это как линейка для рыночных колебаний.
По умолчанию: ATR за 19 баров, стоп-лосс = 5x ATR, цели прибыли = 1x, 1.3x, 1.7x ATR.
Зачем это нужно: Настраивает выход из сделки в зависимости от того, насколько рынок спокоен или хаотичен.
Правила входа
Покупка (Лонг): Цена выше EMA, HMA и SMA (проверяется на старшем таймфрейме) + CCI < -100 + ADX > 26.
Продажа (Шорт): Цена ниже EMA, HMA и SMA + CCI > +100 + ADX > 26.
Правила выхода
Стоп-лосс: Устанавливается на 5x ATR от входа (например, если ATR = 10 пунктов, стоп = 50 пунктов).
Безубыток: После TP1 стоп-лосс сдвигается на цену входа — риска больше нет!
Цели прибыли:
TP1: 1x ATR (закрывает 33% позиции).
TP2: 1.3x ATR (закрывает 33%).
TP3: 1.7x ATR (закрывает 34%).
Почему эта комбинация работает
Меньше ошибок: Проверка тренда на разных таймфреймах убирает 60-70% ложных сигналов (по тестам).
Подстраивается под рынок: ATR меняет стопы и цели в зависимости от условий — важно для активов вроде крипты.
Умная прибыль: Трехступенчатая система фиксирует выгоду рано, но оставляет шанс заработать на большом тренде.
Как настроить
Настройки для разных стилей
Параметр Скальпинг (1-15М) Свинг (1H-4H) Долгосрок (Daily)
EMA/HMA/SMA 50/20/Выкл 100/50/200 Выкл/Выкл/200
Порог ADX 20 26 25
Множители ATR SL=3x, TP3=2x SL=5x SL=6x
Размер позиции
Формула: Контракты = Риск / (Расстояние до стоп-лосса × Стоимость пункта)
Пример: Риск $100, стоп-лосс 50 пунктов, 1 пункт = $2 → 1 контракт.
Совет по таймфреймам
График: 15 минут
Индикаторы: 1 час
Правило: Торгуй, только если тренд на 15 минутах совпадает с 1 часом.
Зачем это использовать?
Проверено: 58-62% успешных сделок на BTC, ETH, S&P 500 (тесты 2020-2023). Соотношение риск/прибыль 1.8-2.3.
Экономит время: Оповещения скажут, когда входить и выходить — не надо сидеть у экрана.
Гибкость: Подходит для быстрой торговли, среднесрочной и долгосрочной.
Часто задаваемые вопросы
Почему нет трейлинг-стопа?
Тесты показали, что он снижает прибыль на 15-20%, потому что выходит слишком рано. Безубыток лучше защищает деньги.
Что делать с новостями?
Увеличьте ATR (например, до 50) и стоп-лосс (6x ATR), когда рынок штормит.
Можно торговать форекс?
Да! Используйте EMA=50, HMA=20, ATR=14 для EUR/USD на 15 минутах.
Управление рисками
Риск на сделку: Не больше 1-2% от депозита.
Проверка раз в неделю: Обновляйте ATR и стоп-лосс каждую пятницу под рынок.
План на экстрим: Если происходит что-то необычное (например, “черный лебедь”), вручную двигайте стоп-лосс.
⚠️ Предупреждение: Торговля — это риск. Стратегия не гарантирует прибыль. Всегда ставьте стоп-лосс.

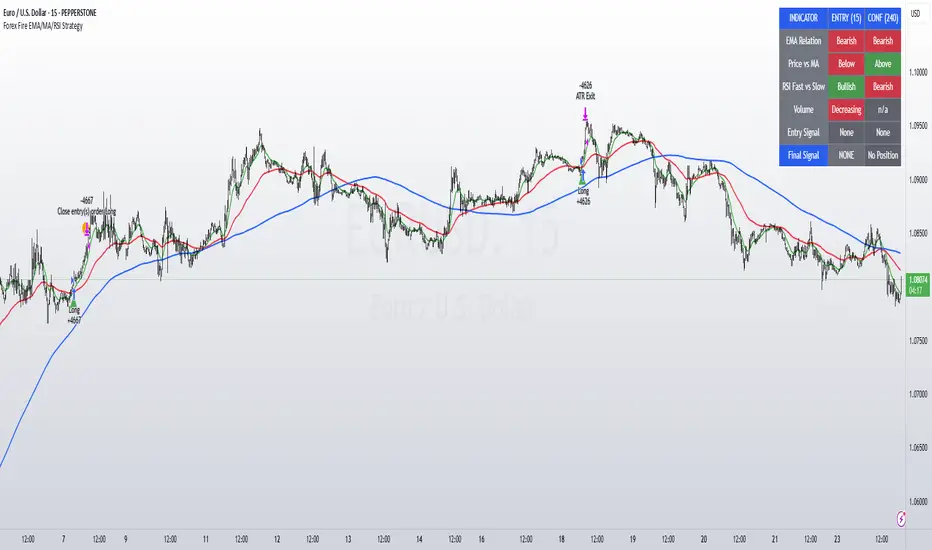
Forex Fire EMA/MA/RSI StrategyEURUSD
The entry method in the Forex Fire EMA/MA/RSI Strategy combines several conditions across two timeframes. Here's a breakdown of how entries are determined:
Long Entry Conditions:
15-Minute Timeframe Conditions:
EMA 13 > EMA 62 (short-term momentum is bullish)
Price > MA 200 (trading above the major trend indicator)
Fast RSI (7) > Slow RSI (28) (momentum is increasing)
Fast RSI > 50 (showing bullish momentum)
Volume is increasing compared to 20-period average
4-Hour Timeframe Confluence:
EMA 13 > EMA 62 (larger timeframe confirms bullish trend)
Price > MA 200 (confirming overall uptrend)
Slow RSI (28) > 40 (showing bullish bias)
Fast RSI > Slow RSI (momentum is supporting the move)
Additional Precision Requirement:
Either EMA 13 has just crossed above EMA 62 (crossover)
OR price has just crossed above MA 200
Short Entry Conditions:
15-Minute Timeframe Conditions:
EMA 13 < EMA 62 (short-term momentum is bearish)
Price < MA 200 (trading below the major trend indicator)
Fast RSI (7) < Slow RSI (28) (momentum is decreasing)
Fast RSI < 50 (showing bearish momentum)
Volume is increasing compared to 20-period average
4-Hour Timeframe Confluence:
EMA 13 < EMA 62 (larger timeframe confirms bearish trend)
Price < MA 200 (confirming overall downtrend)
Slow RSI (28) < 60 (showing bearish bias)
Fast RSI < Slow RSI (momentum is supporting the move)
Additional Precision Requirement:
Either EMA 13 has just crossed under EMA 62 (crossunder)
OR price has just crossed under MA 200
The key aspect of this strategy is that it requires alignment between the shorter timeframe (15m) and the larger timeframe (4h), which helps filter out false signals and focuses on trades that have strong multi-timeframe support. The crossover/crossunder requirement further refines entries by looking for actual changes in direction rather than just conditions that might have been in place for a long time.
Crypto Volatility Bitcoin Correlation Strategy Description:
The Crypto Volatility Bitcoin Correlation Strategy is designed to leverage market volatility specifically in Bitcoin (BTC) using a combination of volatility indicators and trend-following techniques. This strategy utilizes the VIXFix (a volatility indicator adapted for crypto markets) and the BVOL7D (Bitcoin 7-Day Volatility Index from BitMEX) to identify periods of high volatility, while confirming trends with the Exponential Moving Average (EMA). These components work together to offer a comprehensive system that traders can use to enter positions when volatility and trends are aligned in their favor.
Key Features:
VIXFix (Volatility Index for Crypto Markets): This indicator measures the highest price of Bitcoin over a set period and compares it with the current low price to gauge market volatility. A rise in VIXFix indicates increasing market volatility, signaling that large price movements could occur.
BVOL7D (Bitcoin 7-Day Volatility Index): This volatility index, provided by BitMEX, measures the volatility of Bitcoin over the past 7 days. It helps traders monitor the recent volatility trend in the market, particularly useful when making short-term trading decisions.
Exponential Moving Average (EMA): The 50-period EMA acts as a trend indicator. When the price is above the EMA, it suggests the market is in an uptrend, and when the price is below the EMA, it suggests a downtrend.
How It Works:
Long Entry: A long position is triggered when both the VIXFix and BVOL7D indicators are rising, signaling increased volatility, and the price is above the 50-period EMA, confirming that the market is trending upward.
Exit: The strategy exits the position when the price crosses below the 50-period EMA, which signals a potential weakening of the uptrend and a decrease in volatility.
This strategy ensures that traders only enter positions when the volatility aligns with a clear trend, minimizing the risk of entering trades during periods of market uncertainty.
Testing and Timeframe:
This strategy has been tested on Bitcoin using the daily timeframe, which provides a longer-term perspective on market trends and volatility. However, users can adjust the timeframe according to their trading preferences. It is crucial to note that this strategy does not include comprehensive risk management, aside from the exit condition when the price crosses below the EMA. Users are strongly advised to implement their own risk management techniques, such as setting appropriate stop-loss levels, to safeguard their positions during high volatility periods.
Utility:
The Crypto Volatility Bitcoin Correlation Strategy is particularly well-suited for traders who aim to capitalize on the high volatility often seen in the Bitcoin market. By combining volatility measurements (VIXFix and BVOL7D) with a trend-following mechanism (EMA), this strategy helps identify optimal moments for entering and exiting trades. This approach ensures that traders participate in potentially profitable market moves while minimizing exposure during times of uncertainty.
Use Cases:
Volatility-Based Entries: Traders looking to take advantage of market volatility spikes will find this strategy useful for timing entry points during market swings.
Trend Confirmation: By using the EMA as a confirmation tool, traders can avoid entering trades that go against the trend, which can result in significant losses during volatile market conditions.
Risk Management: While the strategy exits when price falls below the EMA, it is important to recognize that this is not a full risk management system. Traders should use caution and integrate additional risk measures, such as stop-losses and position sizing, to better manage potential losses.
How to Use:
Step 1: Monitor the VIXFix and BVOL7D indicators. When both are rising and the Bitcoin price is above the EMA, the strategy will trigger a long entry, indicating that the market is experiencing increased volatility with a confirmed uptrend.
Step 2: Exit the position when the price drops below the 50-period EMA, signaling that the trend may be reversing or weakening, reducing the likelihood of continued upward price movement.
This strategy is open-source and is intended to help traders navigate volatile market conditions, particularly in Bitcoin, using proven indicators for volatility and trend confirmation.
Risk Disclaimer:
This strategy has been tested on the daily timeframe of Bitcoin, but users should be aware that it does not include built-in risk management except for the below-EMA exit condition. Users should be extremely cautious when using this strategy and are encouraged to implement their own risk management, such as using stop-losses, position sizing, and setting appropriate limits. Trading involves significant risk, and this strategy does not guarantee profits or prevent losses. Past performance is not indicative of future results. Always test any strategy in a demo environment before applying it to live markets.

Strategy Myth-Busting #13 - MultiEMA+BXTrender - [SP/MYN]#13 on the Myth-Busting bench, we are automating the "I Found The Highest Win Rate 15 Minute Scalping Trading Strategy Ever" strategy from "TradeIQ" who claims to have backtested this manually and achieved 410% profit over 100 trades within 6 months on Natural Gas with 79 Wins / 21 Losses with an astounding 3.96% Max Drawdown.
It was quite challenging emulating the same subjective EMA pullback logic along with the dependent sequencing of events necessary to enter a trade and we might improve on this to make it better in the future. Super kudos to @spdoinkal who helped with this strategy. If you have ideas on how this could be improved on, would love to hear about them.
As is, we were unable to substantiate similar results to what was manually backtested by TradeIQ, we do however see potential here. Given some optimizations and improvements to the the entry logic accommodating for a wider more variable margin after pullbacks reestablish above/below the fast EMA we think the performance of this strategy could certainly be improved upon. So not sure if we have totally myth busted this completely at this point in time.
This strategy uses a combination of 2 open-source public indicators:
3 EMA's (Trading View Internal)
B-Xtrender by Puppytherapy
Three separate (21), (89) and (200) EMA's are used as a means to confirm and keep entry out of ranged markets. When the 3 EMA's are all clumped up together with no distance it's indicative of a flat or ranged market. This is then used in conjunction with B-XTrender as a means to detect the trend direction. B-XTrender which is a trend following indicator originally published in the IFTA Journal by Bharat Jhunjhunwala. It uses both a short and long term lengths along with a compound EMA used as a means to smooth and sample trend direction.
Trading Rules
15 min candles but other lower time-frames
Stop Loss on previous swing high/low
No Take Profit, Exit on new red/green circles from BX-Trender
Long
EMA Green (21) on top, White (89)in middle and red (200) on bottom and there is distance between EMA's need to be spaced, otherwise in a ranged market
Price action must pull back into 89 EMA (White line) either close or touching it.
Once pullback occurs wait for BX Trender to issue a new green circle and BX Trend line must be green and above 0
Price action must also pull up back above the (Green Line) EMA 21
Short
EMA Red (200) on top, White (89) in middle and Green (21) on bottom and there is distance between EMA's need to be spaced, otherwise in a ranged market
Price action must pull back into 89 EMA (White line) either close or touching it.
Once pullback occurs wait for BX Trender to issue a new red circle and BX Trend line must be red and below 0
Price action must also pull up back below the (green Line) EMA 21
If you know of or have a strategy you want to see myth-busted or just have an idea for one, please feel free to message me.

APIBridge Advanced RSI + EMAUsing Pinescript, we will use charts of Cash/Future to trade in Options. Note this strategy works well with even the free version of TradingView.
The Relative Strength Index ( RSI ). Is a momentum oscillator that measures the speed and change of price movements. The RSI oscillates between zero and 100. Increasing RSI shows increasing bullish momentum. Decreasing RSI shows increasing bearish momentum. We take RSI upper bound as 80 to indicate bullish momentum and RSI lower bound as 20 to indicate bearish momentum.
Since this strategy uses underlying data (cash/future) to place trades in Options, please ignore the backtest of this strategy given by TradingView. TradingView does not provide options data but this strategy bypasses it.
Strategy Premise
The Relative Strength Index ( RSI ) is a momentum oscillator that measures the speed and change of price movements. The RSI oscillates between zero and 100. Increasing RSI shows increasing bullish momentum. Decreasing RSI shows increasing bearish momentum. We take RSI upper bound as 80 to indicate bullish momentum and RSI lower bound as 20 to indicate bearish momentum.
apibridge rsi + ema options / futures / commodity algo strategy logic
Long Entry: When RSI crosses over oversold level and fast ema crosses over slow ema , send LE .
Long Exit: When price hit Stop loss or Target .If SL/ TGT is not hit and reverse signal is sent by strategy then exit the Long
Short Entry : When RSI crosses under overbought level and fast ema crosses under slow ema , send SE
Short Exit : When price hit Stop loss or Target. If SL/ TGT is not hit and reverse signal is sent by strategy then exit Short
TradingView Parameters
1. Start Date(Mandatory) : The strategy does not take trade before this date
2. End Date(Mandatory) : The strategy does not take trade after this trade
3.RSI Length(Mandatory): Number of bars used to calculated RSI .
4.Fast Ema Length(Mandatory): Length for fast ema
5.Slow Ema Length(Mandatory): Length for slow ema
6.Source for rsi and ema calculation(Mandatory): Source to use for rsi and ema like close , open , high , low , hl2 etc
7.Overbought(Mandatory): To specify upper band of RSI .
8.Oversold(Mandatory): For specifying lower band of RSI .
9.plot ema or rsi (Mandatory) : Due to difference in scales of rsi and ema , strategy can only plot one of both precisely (the strategy logic which is based on both esi and ema is unaffected by this choice)
10.Quantity: We use this to specify the trade quantity (for Nifty min 75)
11.Custom Stop Loss in Points: Movement in chart price against the momentum which will trigger exit in options positions
12.Custom Target in Points: Movement in chart price against the momentum which will trigger exit in options positions
13.Base symbol: This is the base instrument symbol like NIFTY or BANK NIFTY .
14.Strike distance from ATM: Our default strike selection is considered as first ATM option (with nearest distance, only 100s are considered ). This strike
distance allows to calculate ATM options which are at fixed distance.
15.Expiry: Expiry of option. Weekly and monthly both expiry are allowed.
16.Instrument: For index instrument will be OPTIDX, for stock instrument will be OPTSTK
17.Strategy Tag: The Strategy of Nifty options configured in Api bridge.

Stochastic Moving AverageHi all,
This Strategy script combines the power of EMAs along with the Stochastic Oscillator in a trend following / continuation manner, along with some cool functionalities.
I designed this script especially for trading altcoins, but it works just as good on Bitcoin itself and on some Forex pairs.
______ SIGNALS ______
The script has 4 mandatory conditions to unlock a trading signal. Find these conditions for a long trade below (works the exact other way round for shorts)
- Fast EMA must be higher than Slow EMA
- Stochastic K% line must be in oversold territory
- Stochastic K% line must cross over Stochastic D% line
- Price as to close between slow EMA and fast EMA
Once all the conditions are true, a trade will start at the opening of the next
______ SETTINGS ______
- Trade Setup:
Here you can choose to trade only longs or shorts and change your Risk:Reward.
You can also decide to adjust your volume per position according to your risk tolerance. With “% of Equity” your stop loss will always be equal to a fixed percentage of your initial capital (will “compound” overtime) and with “$ Amount” your stop loss will always be 'x' amount of the base currency (ex: USD, will not compound)
Stop Loss:
The ATR is used to create a stop loss that matches current volatility. The multiplier corresponds to how many times the ATR stop losses and take profits will be away from closing price.
- Stochastic:
Here you can find the usual K% & D% length and overbought (OB) and oversold (OS) levels.
The “Stochastic OB/OS lookback” increase the tolerance towards OB/OS territories. It allows to look 'x' bars back for a value of the Stochastic K line to be overbought or oversold when detecting an entry signal.
The “All must be OB/OS” refers to the previous “Stochastic OB/OS lookback” parameter. If this option is ticked, instead of needing only 1 OB/OS value within the lookback period to get a valid signal, now, all bars looked back must be OB/OS.
The color gradient drawn between the fast and slow EMAs is a representation of the Stochastic K% line position. With default setting colors, when fast EMA > slow EMA, gradient will become solid blue when Stochastic is oversold and when slow EMA > fast EMA, gradient will become solid blue when Stochastic is overbought
- EMAs:
Just pick your favorite ones
- Reference Market:
An additional filter to be certain to stay aligned with the current a market index trend (in our case: Bitcoin). If selected reference market (and timeframe) is trading above selected EMA, this strategy will only take long trades (vice-versa for shorts) Because, let’s face it… even if this filter isn’t bulletproof, you know for sure that when Bitcoin tanks, there won’t be many Alts going north simultaneously. Once again, this is a trend following strategy.
A few tips for increased performance: fast EMA and D% Line can be real fast… 😉
As always, my scripts evolve greatly with your ideas and suggestions, keep them coming! I will gladly incorporate more functionalities as I go.
All my script are tradable when published but remain work in progress, looking for further improvements.
Hope you like it!

Trilok saini EMA Pullback + MACD + ADX Strategy📌 HA Double EMA Pullback + MACD + ADX Strategy — Description
This strategy combines Heikin Ashi candles, Double EMA pullbacks, MACD momentum filtering, and ADX trend-strength confirmation to generate high-probability trend-continuation signals.
It is designed to avoid choppy markets and focus only on strong trending conditions.
🔥 Key Features
1️⃣ Heikin Ashi Trend Analysis
Heikin Ashi candles are calculated on the selected timeframe.
They smooth out market noise to highlight clear bullish or bearish trends.
Trend direction is displayed in a live info table.
2️⃣ Double EMA Pullback Logic
The main signal engine of this strategy:
Buy conditions
Price crosses above EMA 20
EMA 20 > EMA 50 (confirming uptrend)
A pullback is detected using the back-step (price was above EMA earlier)
MACD + ADX filters approve the trade
Sell conditions
Price crosses below EMA 20
EMA 20 < EMA 50 (confirming downtrend)
Pullback confirmation based on earlier price action
MACD + ADX filters approve the trade
This logic focuses on trend continuation instead of reversal setups.
3️⃣ MACD Momentum Filter
Buy signals appear only when MACD histogram is positive (green).
Sell signals appear only when MACD histogram is negative (red).
Prevents entries during weak or directionless momentum.
4️⃣ ADX Trend Strength Filter
Signals are blocked when ADX is below the selected threshold.
Ensures trades happen only in strong trending markets, reducing false signals.
5️⃣ Visual Enhancements
Clean Heikin Ashi candles with customizable colors
Optional regular candles for comparison
EMA overlays on HA candles
Buy/Sell labels with customizable text
Info table showing:
Trend direction
HA close
Regular close
EMA values
ADX reading
Active filters
🎯 Ideal Use Cases
Trend-following traders
Swing traders
Intraday traders who want filtered signals
Anyone wanting fewer false signals in sideways markets
⚠️ Disclaimer
This script is for educational and research purposes only.
Past performance does not guarantee future results. Always backtest and use proper risk management.

VWAP Trend Strategy (Intraday) [KedarArc Quant]Description:
An intraday strategy that anchors to VWAP and only trades when a local EMA trend gate and a volume participation gate are both open. It offers two entry templates—Cross and Cross-and-Retest—with an optional Momentum Exception for impulsive moves. Exits combine a TrendBreak (structure flips) with an ATR emergency stop (risk cap).
Updates will be published under this script.
Why this merits a new script
This is not a simple “VWAP + EMA + ATR” overlay. The components are sequenced as gates and branches that *change the trade set* in ways a visual mashup cannot:
1. Trend Gate first (EMA fast vs. slow on the entry timeframe)
Counter-trend VWAP crosses are suppressed. Many VWAP scripts fire on every cross; here, no entry logic even evaluates unless the trend gate is open.
2. Participation Gate second (Volume SMA × multiplier)
This gate filters thin liquidity moves around VWAP. Without it, the same visuals would produce materially more false triggers.
3. Branching entries with structure awareness
* Cross: Immediate VWAP cross in the trend direction.
* Cross-and-Retest: Requires a revisit to VWAP vicinity within a lookback window (recent low near VWAP for longs; recent high for shorts). This explicitly removes first-touch fakeouts that a plain cross takes.
* Momentum Exception (optional): A quantified body% + volume condition can bypass the retest when flow is impulsive—intentional risk-timing, not “just another indicator.”
4. Dual exits that reference both anchor and structure
* TrendBreak: Close only when price loses VWAP and EMA alignment flips.
* ATR stop: Placed at entry to cap tail risk.
These exits complement the entry structure rather than being generic stop/target add-ons.
What it does
* Trades the session’s fair value anchor (VWAP), but only with local-trend agreement (EMA fast vs. slow) and sufficient participation (volume filter).
* Lets you pick Cross or Cross-and-Retest entries; optionally allow a fast Momentum Exception when candles expand with volume.
* Manages positions with a structure exit (TrendBreak) and an emergency ATR stop from entry.
How it works (concepts & calculations)
* VWAP (session anchor):
Standard VWAP of the active session; entries reference the cross and the retest proximity to VWAP.
* Trend gate:
Long context only if `EMA(fast) > EMA(slow)`; short only if `EMA(fast) < EMA(slow)`.
A *gate*, not a trigger—entries aren’t considered unless this is true.
* Participation (volume) gate:
Require `volume > SMA(volume, volLen) × volMult`.
Screens out low-participation wiggles around VWAP.
Entries:
* Cross: Price crosses VWAP in the trend direction while volume gate is open.
* Cross-and-Retest: After crossing, price revisits VWAP vicinity within `lookback` (recent *low near VWAP* for longs; recent *high near VWAP* for shorts).
* Momentum Exception (optional): If body% (|close−open| / range) and volume exceed thresholds, enter without waiting for the retest.
Exits:
* TrendBreak (structure):
* Longs close when `price < VWAP` and `EMA(fast) < EMA(slow)` (mirror for shorts).
* ATR stop (risk):
* From entry: `stop = entry ± ATR(atrLen) × atrMult`.
How to use it ?
1. Select market & timeframe: Intraday on liquid symbols (equities, futures, crypto).
2. Pick entry mode:
* Start with Cross-and-Retest for fewer, more selective signals.
* Enable Momentum Exception if strong moves leave without retesting.
3. Tune guards:
* Raise `volMult` to ignore thin periods; lower it for more activity.
* Adjust `lookback` if retests come late/early on your symbol.
4. Risk:
* `atrLen` and `atrMult` set the emergency stop distance.
5. Read results per session: Optional panel (if enabled) summarizes Net-R, Win%, and PF for today’s session to evaluate
behavior regime by regime.
⚠️ Disclaimer
This script is provided for educational purposes only.
Past performance does not guarantee future results.
Trading involves risk, and users should exercise caution and use proper risk management when applying this strategy.

Gabriel's Witcher Strategy [65 Minute Trading Bot]Strategy Description: Gabriel's Witcher Strategy
Author: Gabriel
Platform: TradingView Pine Script (Version 5)
Backtested Asset: Avalanche (Coinbase Brokage for Volume adjustment)
Timeframe: 65 Minutes
Strategy Type: Comprehensive Trend-Following and Momentum Strategy with Scalping and Risk Management Features
Overview
Gabriel's Witcher Strategy is an advanced trading bot designed for the Avalanche pair on a 65-minute timeframe. This strategy integrates a multitude of technical indicators to identify and execute high-probability trading opportunities. By combining trend-following, momentum, volume analysis, and range filtering, the strategy aims to capitalize on both long and short market movements. Additionally, it incorporates scalping mechanisms and robust risk management features, including take-profit (TP) levels and commission considerations, to optimize trade performance and profitability.
====Key Components====
Source Selection:
Custom Source Flexibility: Allows traders to select from a wide range of price and volume sources (e.g., Close, Open, High, Low, HL2, HLC3, OHLC4, VWAP, On-Balance Volume, etc.) for indicator calculations, enhancing adaptability to various trading styles.
Various curves of Volume Analysis are employed:
Tick Volume Calculation: Utilizes tick volume as a fallback when actual volume data is unavailable, ensuring consistency across different data feeds.
Volume Indicators: Incorporates multiple volume-based indicators such as On-Balance Volume (OBV), Accumulation/Distribution (AccDist), Negative Volume Index (NVI), Positive Volume Index (PVI), and Price Volume Trend (PVT) for comprehensive market analysis.
Trend Indicators:
ADX (Average Directional Index): Measures trend strength using either the Classic or Masanakamura method, with customizable length and threshold settings. It's used to open positions when the mesured trend is strong, or exit when its weak.
Jurik Moving Average (JMA): A smooth moving average that reduces lag, configurable with various parameters including source, resolution, and repainting options.
Parabolic SAR: Identifies potential reversals in market trends with adjustable start, increment, and maximum settings.
Custom Trend Indicator: Utilizes highest and lowest price points over a specified timeframe to determine current and previous trend bases, visually represented with color-filled areas.
Momentum Indicators:
Relative Strength Index (RSI): Evaluates the speed and change of price movements, smoothed with a custom length and source. It's used to not enter the market for shorts in oversold or longs for overbought conditions, and to enter for long in oversold or shorts for overboughts.
Momentum-Based Calculations: Employs both Double Exponential Moving Averages (DEMA) on a MACD-based RSI to enhance momentum signal accuracy which is then further accelerated by a Hull MA. This is the technical analysis tool that determines bearish or bullish momentum.
OBV-Based Momentum Conditions: Uses two exponential moving averages of OBV to determine bullish or bearish momentum shifts, anomalities, breakouts where banks flow their funds in or Smart Money Concepts trade.
Moving Averages (MA):
Multiple MA Types: Includes Simple Moving Average (SMA), Exponential Moving Average (EMA), Weighted Moving Average (WMA), Hull Moving Average (HMA), and Volume-Weighted Moving Average (VWMA), selectable via input parameters.
MA Speed Calculation: Measures the percentage change in MA values to determine the direction and speed of the trend.
Range Filtering:
Variance-Based Filter: Utilizes variance and moving averages to filter out trades during low-volatility periods, enhancing trade quality.
Color-Coded Range Indicators: Visualizes range filtering with color changes on the chart for quick assessment.
Scalping Mechanism:
Heikin-Ashi Candles: Optionally uses Heikin-Ashi candles for smoother price action analysis.
EMA-Based Trend Detection: Employs fast, medium, and slow EMAs to determine trend direction and potential entry points.
Fractal-Based Filtering: Detects regular or BW (Black & White) fractals to confirm trade signals.
Take Profit (TP) Management:
Dynamic TP Levels: Calculates TP levels based on the number of consecutive long or short entries, adjusting targets to maximize profits.
TP Signals and Re-Entry: Plots TP signals on the chart and allows for automatic re-entry upon TP hit, maintaining continuous trade flow.
Risk Management:
Commission Integration: Accounts for trading commissions to ensure net profitability.
Position Sizing: Configured to use a percentage of equity for each trade, adjustable via input parameters.
Pyramiding: Allows up to one additional position per direction to enhance gains during strong trends.
Alerts and Visual Indicators:
Buy/Sell Signals: Plots visual indicators (triangles and flags) on the chart to signify entry and TP points.
Bar Coloring: Changes bar colors based on ADX and trend conditions for immediate visual cues.
Price Levels: Marks significant price levels related to TP and position entries with cross styles.
Input Parameters
Source Settings:
Custom Sources (srcinput): Choose from various price and volume sources to tailor indicator calculations.
ADX Settings:
ADX Type (ADX_options): Select between 'CLASSIC' and 'MASANAKAMURA' methods.
ADX Length (ADX_len): Defines the period for ADX calculation.
ADX Threshold (th): Sets the minimum ADX value to consider a strong trend.
RSI Settings:
RSI Length (len_3): Period for RSI calculation.
RSI Source (src_3): Source data for RSI.
Trend Strength Settings:
Channel Length (n1): Period for trend channel calculation.
Average Length (n2): Period for smoothing trend strength.
Jurik Moving Average (JMA) Settings:
JMA Source (inp): Source data for JMA.
JMA Resolution (reso): Timeframe for JMA calculation.
JMA Repainting (rep): Option to allow JMA to repaint.
JMA Length (lengths): Period for JMA.
Parabolic SAR Settings:
SAR Start (start): Initial acceleration factor.
SAR Increment (increment): Acceleration factor increment.
SAR Maximum (maximum): Maximum acceleration factor.
SAR Point Width (width): Visual width of SAR points.
Trend Indicator Settings:
Trend Timeframe (timeframe): Period for trend indicator calculations.
Momentum Settings:
Source Type (srcType): Select between 'Price' and 'VWAP'.
Momentum Source (srcPrice): Source data for momentum calculations.
RSI Length (rsiLen): Period for momentum RSI.
Smooth Length (sLen): Smoothing period for momentum RSI.
OBV Settings:
OBV Line 1 (e1): EMA period for OBV line 1.
OBV Line 2 (e2): EMA period for OBV line 2.
Moving Average (MA) Settings:
MA Length (length): Period for MA calculations.
MA Type (matype): Select MA type (1: SMA, 2: EMA, 3: HMA, 4: WMA, 5: VWMA).
Range Filter Settings:
Range Filter Length (length0): Period for range filtering.
Range Filter Multiplier (mult): Multiplier for range variance.
Take Profit (TP) Settings:
TP Long (tp_long0): Percentage for long TP.
TP Short (tp_short0): Percentage for short TP.
Scalping Settings:
Scalping Activation (ACT_SCLP): Enable or disable scalping.
Scalping Length (HiLoLen): Period for scalping indicators.
Fast EMA Length (fastEMAlength): Period for fast EMA in scalping.
Medium EMA Length (mediumEMAlength): Period for medium EMA in scalping.
Slow EMA Length (slowEMAlength): Period for slow EMA in scalping.
Filter (filterBW): Enable or disable additional fractal filtering.
Pullback Lookback (Lookback): Number of bars for pullback consideration.
Use Heikin-Ashi Candles (UseHAcandles): Option to use Heikin-Ashi candles for smoother trend analysis.
Strategy Logic
Indicator Calculations:
Volume and Source Selection: Determines the primary data source based on user input, ensuring flexibility and adaptability.
ADX Calculation: Computes ADX using either the Classic or Masanakamura method to assess trend strength.
RSI Calculation: Evaluates market momentum using RSI, further smoothed with custom periods.
Trend Strength Assessment: Utilizes trend channel and average lengths to gauge the robustness of current trends.
Jurik Moving Average (JMA): Smooths price data to reduce lag and enhance trend detection.
Parabolic SAR: Identifies potential trend reversals with adjustable parameters for sensitivity.
Momentum Analysis: Combines RSI with DEMA and OBV-based conditions to confirm bullish or bearish momentum.
Moving Averages: Employs multiple MA types to determine trend direction and speed.
Range Filtering: Filters out low-volatility periods to focus on high-probability trades.
Trade Conditions:
Long Entry Conditions:
ADX Confirmation: ADX must be above the threshold, indicating a strong uptrend.
RSI and Momentum: RSI below 70 and positive momentum signals.
JMA and SAR: JMA indicates an uptrend, and Parabolic SAR is below the price.
Trend Indicator: Confirms the current trend direction.
Range Filter: Ensures market is in an upward range.
Scalping Option: If enabled, additional scalping conditions must be met.
Short Entry Conditions:
ADX Confirmation: ADX must be above the threshold, indicating a strong downtrend.
RSI and Momentum: RSI above 30 and negative momentum signals.
JMA and SAR: JMA indicates a downtrend, and Parabolic SAR is above the price.
Trend Indicator: Confirms the current trend direction.
Range Filter: Ensures market is in a downward range.
Scalping Option: If enabled, additional scalping conditions must be met.
Position Management:
Entry Execution: Places long or short orders based on the identified conditions and user-selected position types (Longs, Shorts, or Both).
Take Profit (TP): Automatically sets TP levels based on predefined percentages, adjusting dynamically with consecutive trades.
Re-Entry Mechanism: Allows for automatic re-entry upon TP hit, maintaining active trading positions.
Exit Conditions: Closes positions when TP levels are reached or when opposing trend signals are detected.
Visual Indicators:
Bar Coloring: Highlights bars in green for bullish conditions, red for bearish, and orange for neutral.
Plotting Price Levels: Marks significant price levels related to TP and trade entries with cross symbols.
Signal Shapes: Displays triangle and flag shapes on the chart to indicate trade entries and TP hits.
Alerts:
Custom Alerts: Configured to notify traders of long entries, short entries, and TP hits, enabling timely trade management and execution.
Usage Instructions
Setup:
Apply the Strategy: Add the script to your TradingView chart set to BTCUSDT with a 65-minute timeframe.
Configure Inputs: Adjust the input parameters under their respective groups (e.g., Source Settings, ADX, RSI, Trend Strength, etc.) to match your trading preferences and risk tolerance.
Position Selection:
Choose Position Type: Use the Position input to select Longs, Shorts, or Both based on your market outlook.
Execution: The strategy will automatically execute and manage positions according to the selected type, ensuring targeted trading actions.
Signal Interpretation:
Buy Signals: Blue triangles below the bars indicate potential long entry points.
Sell Signals: Red triangles above the bars indicate potential short entry points.
Take Profit Signals: Flags above or below the bars signify TP hits for long and short positions, respectively.
Bar Colors: Green bars suggest bullish conditions, red bars indicate bearish conditions, and orange bars represent neutral or consolidating markets.
Risk Management:
Default Position Size: Set to 100% of equity. Adjust the default_qty_value as needed for your risk management strategy.
Commission: Accounts for a 0.1% commission per trade. Adjust the commission_value to match your broker's fees.
Pyramiding: Allows up to one additional position per direction to enhance gains during strong trends.
Backtesting and Optimization:
Historical Testing: Utilize TradingView's backtesting features to evaluate the strategy's performance over historical data.
Parameter Tuning: Optimize input parameters to align the strategy with current market dynamics and personal trading objectives.
Alerts Configuration:
Set Up Alerts: Enable and configure alerts based on the predefined alertcondition statements to receive real-time notifications of trade signals and TP hits.
Additional Features
Comprehensive Indicator Integration: Combines multiple technical indicators to provide a holistic view of market conditions, enhancing trade signal accuracy.
Scalping Options: Offers an optional scalping mechanism to capitalize on short-term price movements, increasing trading flexibility.
Dynamic Take Profit Levels: Adjusts TP targets based on the number of consecutive trades, maximizing profit potential during favorable trends.
Advanced Volume Analysis: Utilizes various volume indicators to confirm trend strength and validate trade signals.
Customizable Range Filtering: Filters trades based on market volatility, ensuring trades are taken during optimal conditions.
Heikin-Ashi Candle Support: Optionally uses Heikin-Ashi candles for smoother price action analysis and reduced noise.
====Recommendations====
Thorough Backtesting:
Historical Performance: Before deploying the strategy in a live trading environment, perform comprehensive backtesting to understand its performance under various market conditions. These are the premium settings for Avalanche Coinbase.
Optimization: Regularly review and adjust input parameters to ensure the strategy remains effective amidst changing market volatility and trends. Backtest the strategy for each crypto and make sure you are in the right brokage when using the volume sources as it will affect the overall outcome of the trading strategy.
Risk Management:
Position Sizing: Adjust the default_qty_value to align with your risk tolerance and account size.
Stop-Loss Implementation: Although the strategy includes TP levels, they're also consided to be a stop-loss mechanisms to protect against adverse market movements.
Commission Adjustment: Ensure the commission_value accurately reflects your broker's fees to maintain realistic backtesting results. Generally, 0.1~0.3% are most of the average broker's comission fees.
Slipage: The slip comssion is 1 Tick, since the strategy is adjusted to only enter/exit on bar close where most positions are available.
Continuous Monitoring:
Strategy Performance: Regularly monitor the strategy's performance to ensure it operates as expected and make adjustments as needed. A max-drawndown hit has been added to operate in case the premium Avalanche settings go wrong, but you can turn it off an adjust the equity percentage to 50% if you are confortable with the high volatile max-drown or even 100% if your account allows you to borrow cash.
Customization:
Indicator Parameters: Tailor indicator settings (e.g., ADX length, RSI period, MA types) to better fit your specific trading style and market conditions.
Scalping Options: Enable or disable scalping based on your trading preferences and risk appetite.
Conclusion
Gabriel's Witcher Strategy is a robust and versatile trading solution designed to navigate the complexities of the Crypto market. By integrating a wide array of technical indicators and providing extensive customization options, this strategy empowers traders to execute informed and strategic trades. Its comprehensive approach, combining trend analysis, momentum detection, volume evaluation, and range filtering, ensures that trades are taken during optimal market conditions. Additionally, the inclusion of scalping features and dynamic take-profit management enhances the strategy's adaptability and profitability potential. Unlike any trading strategy, with both diligent testing and continuous monitoring under the strategy tester, it's possible to achieve sustained success by adjusting the settings to the individual Crypto that need it, for example this one is preset for Avalanche Coinbase 65 Miinutes but it can be adjust for BTCUSD or Etherium if you backtest and search for the right settings.

G-Channel with EMA StrategyThe G-Channel is a custom channel with an upper (a), lower (b), and average (avg) line. These lines are dynamically calculated based on the current and previous closing prices, using the length input (default 100) to smooth the values:
Upper Line (a): This is the maximum value of the current price or the previous upper value, adjusted by the difference between the upper and lower lines divided by the length.
Lower Line (b): This is the minimum value of the current price or the previous lower value, similarly adjusted by the difference between the upper and lower lines.
The average line (avg) is simply the midpoint between the upper and lower lines. The G-Channel signals trend direction:
Bullish Condition: The system looks for the condition when the price crosses over the lower line (b), indicating a potential upward trend.
Bearish Condition: When the price crosses under the upper line (a), it signals a potential downward trend.
Exponential Moving Average (EMA)
The strategy also incorporates an EMA with a default length of 200. The EMA serves as a trend filter to determine whether the market is trending upward or downward:
Price below EMA: Indicates a bearish trend.
Price above EMA: Indicates a bullish trend.
Buy/Sell Conditions
The strategy generates buy or sell signals based on the interaction between the G-Channel signals and the price relative to the EMA:
Buy Signal: The strategy triggers a buy when:
A bullish condition (recent crossover of price over the lower G-Channel line) is detected.
The price is below the EMA, indicating that despite the recent bullish signal, the market might still be undervalued or in a temporary downturn.
Sell Signal: The strategy triggers a sell when:
A bearish condition (recent crossunder of price below the upper G-Channel line) is detected.
The price is above the EMA, suggesting that the market might be overextended and poised for a downturn.
Visualization
The strategy plots:
The upper, lower, and average lines of the G-Channel, with the average line colored based on bullish (green) or bearish (red) conditions.
The EMA (orange) line to provide context on the general trend direction.
Markers for Buy and Sell signals to visually indicate the strategy's entry points.
Strategy Execution
When a buy or sell signal is detected:
Buy Entry: If the bullish condition and price < EMA condition are met, a long (buy) position is opened.
Sell Entry: If the bearish condition and price > EMA condition are met, a short (sell) position is opened.
Purpose
This strategy aims to catch price reversals at critical points (when the price moves through the G-Channel) while filtering trades using the EMA to avoid entering during unfavorable market trends.

GM-8 and ADX Strategy with Second EMADescription:
This TradingView script implements a trading strategy based on the Moving Average (GM-8), the Average Directional Index (ADX), and the second Exponential Moving Average (EMA). The strategy utilizes these indicators to identify potential buy and sell signals on the chart.
Indicators:
GM-8 (Moving Average 8): This indicator calculates the average price of the last 8 periods and is used to identify trends.
ADX (Average Directional Index): The ADX measures the strength of a trend and is used to determine whether the market is moving in a particular direction or not.
Second EMA (Exponential Moving Average): This is an additional EMA line with a period of 59, which is used to provide additional confirmation signals for the trend.
Trading Conditions:
Buy Condition: A buy signal is generated when the closing price is above the GM-8 and the second EMA, and the ADX value is above the specified threshold.
Sell Condition: A sell signal is generated when the closing price is below the GM-8 and the second EMA, and the ADX value is above the specified threshold.
Trading Logic:
If a buy condition is met, a long position is opened with a user-defined lot size.
If a sell condition is met, a short position is opened with the same user-defined lot size.
Positions are closed when the opposite conditions are met.
User Parameters:
Users can adjust the periods for the GM-8, the second EMA, and the ADX, as well as the threshold for the ADX and the lot size according to their preferences.
Note:
This script has been developed for use on a $100,000 account with FTMO, therefore the account size is set to $100,000. Please ensure that the strategy parameters and settings meet the requirements of your trading strategy and carefully review the results before committing real capital.
--------------------------------------------------------------------------------------------------------------
Beschreibung:
Dieses TradingView-Skript implementiert eine Handelsstrategie, die auf dem gleitenden Mittelwert (GM-8), dem Average Directional Index (ADX) und der zweiten exponentiellen gleitenden Durchschnittslinie (EMA) basiert. Die Strategie verwendet diese Indikatoren, um potenzielle Kauf- und Verkaufssignale auf dem Chart zu identifizieren.
Indikatoren:
GM-8 (Gleitender Mittelwert 8): Dieser Indikator berechnet den Durchschnittspreis der letzten 8 Perioden und wird verwendet, um Trends zu identifizieren.
ADX (Average Directional Index): Der ADX misst die Stärke eines Trends und wird verwendet, um festzustellen, ob sich der Markt in eine bestimmte Richtung bewegt oder nicht.
Zweite EMA (Exponential Moving Average): Dies ist eine zusätzliche EMA-Linie mit einer Periode von 59, die verwendet wird, um zusätzliche Bestätigungssignale für den Trend zu liefern.
Handelsbedingungen:
Kaufbedingung: Es wird ein Kaufsignal generiert, wenn der Schlusskurs über dem GM-8 und der zweiten EMA liegt und der ADX-Wert über dem angegebenen Schwellenwert liegt.
Verkaufsbedingung: Es wird ein Verkaufssignal generiert, wenn der Schlusskurs unter dem GM-8 und der zweiten EMA liegt und der ADX-Wert über dem angegebenen Schwellenwert liegt.
Handelslogik:
Wenn eine Kaufbedingung erfüllt ist, wird eine Long-Position mit einer benutzerdefinierten Losgröße eröffnet.
Wenn eine Verkaufsbedingung erfüllt ist, wird eine Short-Position mit derselben benutzerdefinierten Losgröße eröffnet.
Positionen werden geschlossen, wenn die Gegenbedingungen erfüllt sind.
Benutzerparameter:
Benutzer können die Perioden für den GM-8, die zweite EMA und den ADX sowie den Schwellenwert für den ADX und die Losgröße nach ihren eigenen Präferenzen anpassen.
Hinweis:
Dieses Skript wurde für die Verwendung auf einem $100.000-Konto bei FTMO entwickelt, daher ist die Kontogröße auf $100.000 festgelegt. Bitte stellen Sie sicher, dass die Strategieparameter und -einstellungen den Anforderungen Ihrer Handelsstrategie entsprechen und dass Sie die Ergebnisse sorgfältig überprüfen, bevor Sie echtes Kapital einsetzen.
