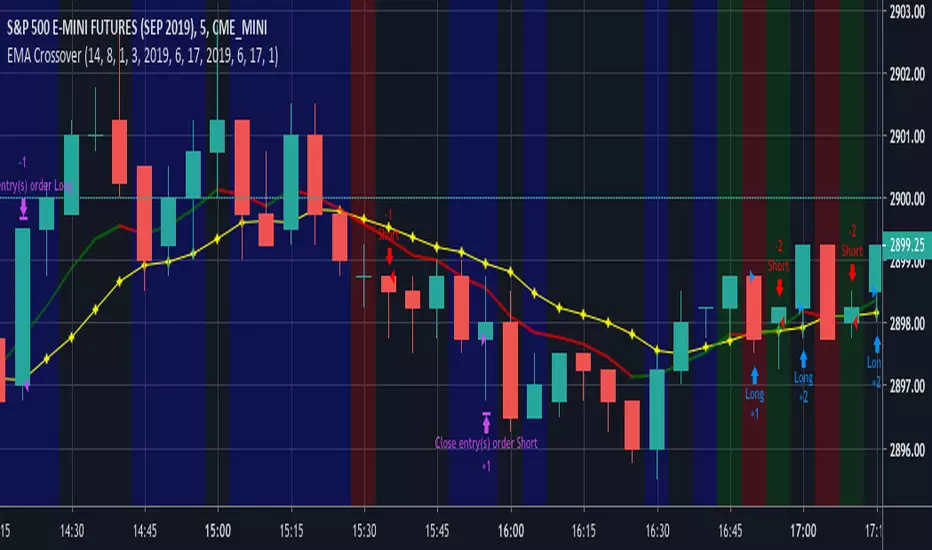
EMA CrossoverEMA Crossover
Input Parameters:
Stop loss (ticks) - define stop loss in unit of ticks (*1 tick = 12.5)
Exit signal - 1: When EMA and price crosses
2: When EMA changes direction
Start year, month, day & Stop year, month, day - define backtest period
You can set Order size, Commission in Settings, Properties tab.
Wyszukaj w skryptach "ema"
EMA X BF 🚀EMA Crossover Strategy
A simple EMA cross is a useful indication of a change in direction of a trend and is a very popular tool in trading. It can also be useful to judge price action momentum or severity by looking at the angle of the 2 EMAs, or the distance between them.
There are 2 Exponential Moving Averages, one fast and one slow. When the fast EMA crosses above the slow EMA, this can be considered bullish and may signal an upside move. Conversely, a cross to the downside of the fast EMA under the slow EMA can be considered bearish.
This strategy uses the same principle but uses different sources for the 2 EMAs; instead of using close values, we use ohlc4 values for the fast EMA and hlc3 values for the slow EMA.
The idea is that a trader might enter a long position upon a cross up and reverse position and go short upon the next cross down.
We use a simple 6% stop loss for both long and short positions.
This strategy is tuned to a 6hr chart for Bitcoin USD pairs.
INSTRUCTIONS
Go Long when the background is green
Go short when the background is red
White background means sideways market: a no trade zone

EMA 1/8 Cross - Fixed Pip TP/SLEMA 1/8 Cross – Fixed Pip TP/SL
This strategy is based on the crossover between EMA 8 and EMA 14 as trading signals:
Long entry → when EMA 1 crosses above EMA 8
Short entry → when EMA 1 crosses below EMA 8
Features:
Fixed pip Take Profit (TP) and Stop Loss (SL), fully adjustable in the settings.
Customizable EMA Fast/Slow lengths for optimization.
Pip size input to match different broker definitions (e.g., XAUUSD often uses 0.10 as one pip).
Suitable for testing scalping or swing trading across multiple timeframes.
⚠️ Disclaimer:
This script is intended for backtesting and educational purposes only. Please optimize parameters and apply proper risk management before using it on live accounts.

EMA Trend Buy sell strategyThis strategy is built to help investors get into a trend safely and smartly — without rushing and without getting in and out too often.
When to Buy:
First Signal – Small Step In (50% Buy)
When the short-term trend (EMA 18) turns positive and goes above the medium trend (EMA 33),
👉 we buy half of our planned position.
This is an early warning that a new upward trend might be starting.
Second Signal – Full Confidence (Buy other 50%)
If the medium-term trend (EMA 33) also crosses above the long-term (EMA 50),
👉 we buy the other half of the position.
Now we’re more confident that the trend is real.
When to Sell:
First Warning – Reduce Position (Sell 50%)
If EMA 33 falls below EMA 50,
👉 we sell half of the position to reduce risk.
Trend Reversal – Exit Completely (Sell the rest)
If EMA 18 also falls below EMA 33,
👉 we sell the remaining half and leave the trade fully.
Why This Strategy?
📉 We don’t jump in all at once.
→ We wait for confirmation before going full in.
⏳ We stay in the trade as long as the trend is healthy.
→ No overtrading or reacting to small moves.
📊 We get out slowly, not suddenly.
→ This helps protect profits and avoid emotional decisions.

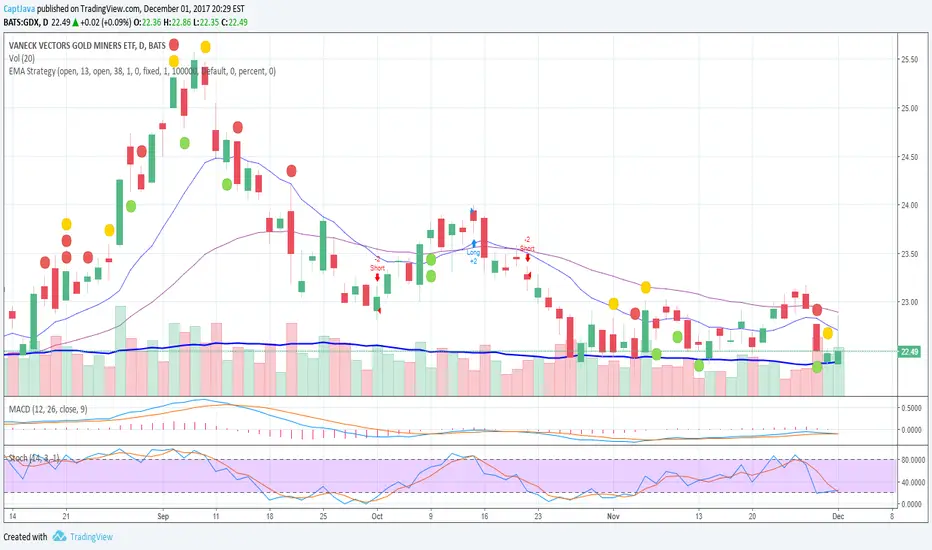
EMA StrategyThis strategy is in testing and development.
**USE AT YOUR OWN RISK. **
This defaults to a 13/48 EMA using the closing price. When the fast EMA crosses above the slow it triggers a buy. When it crosses below the slow EMA it triggers a sell and potentially a short, but that is not implemented. Stops, trailing stops, and pyramiding to be added. The purpose of this strategy is to signal recommended entry and exit point and back test whether the strategy works. It is not intended to be an automated buy/sell script.
* stop loss added. Not yet configurable from the settings panel. Defaults to 8% from the entry price.
TODO:
Add the ability to configure the stop-loss level in the settings panel
Add trailing stop functionality
Add profit taking, likely configurable sell targets (2:1 risk to reward gain for example)
Add another signal or two to help improve odds of making a winning trade.

EMA Bounce StrategySimple strategy that checks for price bounces over an Exponential Moving Average. If the CLOSE of the candle bounces
back from having it's LOW below the EMA then it's a Bull Bounce. If the CLOSE of the candle bounces down from having it's
high above the EMA then it's a Bear Bounce. This logic can be reversed.

EMA Slope AyEWe create our own indicator to calculate the slope of a 20 period EMA over the last candle.

EMA Slope AyEWe create our own indicator to calculate the slope of a 50 period EMA over the last 3 candles.

EMA StratIf previous day close above EMA, enter long at open the following day. Exit long position if prices close below EMA.

EMA + Williams Fractal Pullback [Trading Nerd]EMA Pullback Strategy with Williams Fractal Indicator
Backtesting script that searches for trends (long and short) and a following pullback into the EMAs. It enters on the first Williams Fractal in the desired direction. I found the Strategy on YouTube as a "M1 Scalping Strategy for Bitcoin".
Including fees the strategy is not profitalbe in lower timeframes (at least if not optimized). But it seems to work on higher timeframes as a swing traiding strategy.
Strategy Conditions
Longs:
EMA 1 > EMA 2 and EMA 2 > EMA 3
Number of need to be above the EMA 1
Then a Pullback into the EMAs is required
Enter on the first bullish Williams Fractal
Signal is canceled if the price closes below the EMA 3
Shorts:
EMA 1 < EMA 2 and EMA 2 < EMA 3
Number of need to be below the EMA 1
Then a Pullback into the EMAs is required
Enter on the first bearish Williams Fractal
Singal is canceled if the price closes above the EMA 3
Take Profit
A Risk Reward Take Profit is possible. If you want to use only a trailing Stop Loss, you can set the Take Profit to 'None'
Stop Loss
The default Stop Loss is EMA. If the Pullback has not reached the EMA 2, the Stop Loss is set to the EMA 2. If the Pullback has reached the EMA 2, the Stop Loss is set to the EMA 3.
Other Stop Loss types are available: ATR, HH/LL
Trailing Stop Loss
Available trailing Stop Loss types: ATR, HH/LL. Best practice is to also set the Stop Loss type to the same value.
The Stop Loss is updated if the value from the latest closed candle is greater/less than the previous value for a long/short trade.
Additional
Time Filter: Only opens trade in the defined Session. Open trades are still being closed outside of the Session.
Start Date/End Date: Limits the backtest for the defined Date Range
Trading Days: Only open Trades on the checked Days
Risk % per Trade: If enabled the Strategy uses X% of the capital (defined in Settings -> Properties -> Initial Capital)
Use Compound Interest: If enabled Capital is recalculated for every trade (initial capital + net Profit)
IMPORTANT: For low Timeframes and Markets with tight SL (like Forex) it requires a lower Margin Percent than default. Go to Settings->Properties and lower the required Long/Short Margin. Otherwise Trades might not be considered because of too less capital/marign. Margins can e.g. set to: 2% (Forex), 10% (Stocks), 20% (Crypto).

EMA and Dow Theory Strategies V2📘 Overview
This strategy is an advanced evolution of the original EMA × Dow Theory hybrid model. V2 introduces true swing‑based trend detection, gradient trend‑zones, higher‑timeframe swing overlays, and dynamic exit logic designed for intraday to short‑term trading across crypto, forex, stocks, and indices.
The system provides precise entries, adaptive exits, and highly visual guidance that helps traders understand trend structure at a glance.
🧠 Key Features
🔹 1. Dual‑EMA Trend Logic (Symbol + External Index)
Both the chart symbol and an external index (OTHERS.D) are evaluated using fast/slow EMAs to determine correlation‑based trend bias.
🔹 2. Dow Theory Swing Detection (Real‑time)
The script identifies swing highs/lows and updates trend direction when price breaks them. This creates a structural trend model that reacts faster than EMAs alone.
🔹 3. Gradient Trend Zones (Visual Trend Strength)
When trend is up or down, the area between price and the latest swing level is filled with a multi‑step gradient. This makes trend strength and distance-to-structure visually intuitive.
🔹 4. Higher‑Timeframe Swing Trend (htfTrend)
Swing highs/lows from a higher timeframe (e.g., 4H) are plotted to show macro structure. Used only for visual context, not for filtering entries.
🔹 5. RSI‑Based Entry Protection
RSI prevents entries during extreme overbought/oversold conditions.
🔹 6. Dynamic Exit System
Includes:
Custom stop‑loss (%)
Partial take‑profit (TP1/TP2/TP3)
Automatic scale‑out when trend color weakens
“Color‑change lockout” to prevent immediate re‑entry
Real‑time PnL tracking and labels
🔹 7. Alerts for All Key Events
Entry, stop‑loss, partial exits, and trend‑change exits all generate structured JSON alerts.
🔹 8. Visual PnL Labels & Equity Tracking
PnL for the latest trade is displayed directly on the chart, including scale‑out adjustments.
⚙️ Input Parameters
Parameter Description
Fast EMA / Slow EMA EMAs used for symbol trend detection
Index Fast / Slow EMA EMAs applied to external index
StopLoss (%) Custom stop‑loss threshold
Scale‑Out % Portion to exit when trend color weakens
RSI Period / Levels Overbought/oversold filters
Swing Detection Length Bars used to detect swing highs/lows
Stats Display Position of statistics table
🧭 About htfTrend (Higher Timeframe Trend)
The higher‑timeframe swing trend is displayed visually but not used for entry logic.
Why? Strict HTF filtering reduces trade frequency and often removes profitable setups. By keeping it visual‑only, traders retain flexibility while still benefiting from macro structure awareness.
Use it as a contextual guide, not a constraint.
📘 概要
本ストラテジーは、V1 を大幅に拡張した EMA × ダウ理論 × スイング構造 × 上位足トレンド可視化 の複合型モデルです。 短期〜デイトレード向けに最適化されており、仮想通貨・FX・株式・指数など幅広いアセットで利用できます。
V2 では、スイング構造の自動検出、グラデーションによるトレンド強度の可視化、上位足スイングライン、動的な利確/損切りロジック が追加され、視覚的にもロジック的にも大幅に強化されています。
🧠 主な機能
🔹 1. 銘柄+外部インデックスの EMA クロス判定
対象銘柄と OTHERS.D の EMA を比較し、相関を考慮したトレンド方向を判定します。
🔹 2. ダウ理論に基づくスイング高値・安値の自動検出
スイング更新によりトレンド方向を切り替える、構造ベースのトレンド判定を採用。
🔹 3. グラデーション背景によるトレンド強度の可視化
スイングラインから現在価格までを段階的に塗り分け、 「どれだけトレンドが伸びているか」を直感的に把握できます。
🔹 4. 上位足スイングトレンド(htfTrend)の表示
4H などの上位足でのスイング高値・安値を表示し、 大局的なトレンド構造を視覚的に把握できます(ロジックには未使用)。
🔹 5. RSI による過熱・売られすぎフィルター
極端な RSI 状態でのエントリーを防止。
🔹 6. 動的イグジットシステム
カスタム損切り(%)
TP1/TP2/TP3 の段階的利確
トレンド色の弱まりによる自動スケールアウト
色変化後の再エントリー制限(waitForColorChange)
リアルタイム PnL の追跡とラベル表示
🔹 7. アラート完備(JSON 形式)
エントリー、損切り、部分利確、トレンド反転などすべてに対応。
🔹 8. 損益ラベル・統計表示
直近トレードの損益をチャート上に表示し、視覚的に把握できます。
⚙️ 設定項目
設定項目名 説明
Fast / Slow EMA 銘柄の EMA 設定
Index Fast / Slow EMA 外部インデックスの EMA 設定
損切り(%) カスタム損切りライン
部分利確割合 トレンド弱化時のスケールアウト割合
RSI 期間・水準 過熱/売られすぎフィルター
スイング検出期間 スイング高値・安値の検出に使用
統計表示位置 テーブルの表示位置
🧭 上位足トレンド(htfTrend)について
上位足スイングの更新に基づくトレンド判定を表示しますが、 エントリー条件には使用していません。
理由: 上位足を厳密にロジックへ組み込むと、トレード機会が大幅に減るためです。
本ストラテジーでは、 「大局の把握は視覚で、エントリーは柔軟に」 という設計思想を採用しています。
→ 裁量で利確判断や逆張り回避に活用できます。

EMA and Dow Theory Strategies🌐 Strategy Description
📘 Overview
This is a hybrid strategy that combines EMA crossovers, Dow Theory swing logic, and multi-timeframe trend overlays. It is suitable for intraday to short-term trading on any asset class: crypto, forex, stocks, and indices.
The strategy provides precise entry/exit signals, dynamic stop-loss and scale-out, and highly visual trade guidance.
🧠 Key Features
・Dual EMA crossover system (applied to both symbol and external index)
・Dow Theory-based swing high/low detection for trend confirmation
・Visual overlay of higher timeframe swing trend (htfTrend)
・RSI filter to avoid overbought/oversold entries
・Dynamic partial take-profit when trend weakens
・Custom stop-loss (%) control
・Visualized trade PnL labels directly on chart
・Alerts for entry, stop-loss, partial exit
・Gradient background zones for swing zones and trend visualization
・Auto-tracked metrics: APR, drawdown, win rate, equity curve
⚙️ Input Parameters
| Parameter | Description |
| ------------------------- | -------------------------------------------------------- |
| Fast EMA / Slow EMA | Periods for detecting local trend via EMAs |
| Index Fast EMA / Slow EMA | EMAs applied to external reference index |
| StopLoss | Maximum loss threshold in % |
| ScaleOut Threshold | Scale-out percentage when trend changes color |
| RSI Period / Levels | RSI period and overbought/oversold levels |
| Swing Detection Length | Number of bars used to detect swing highs/lows |
| Stats Display Options | Toggle PnL labels and position of statistics table |
🧭 About htfTrend (Higher Timeframe Trend)
The script includes a higher timeframe trend (htfTrend) calculated using Dow Theory (pivot highs/lows).
This trend is only used for visual guidance, not for actual entry conditions.
Why? Strictly filtering trades by higher timeframe often leads to missed opportunities and low frequency.
By keeping htfTrend visual-only, traders can still refer to macro structure but retain trade flexibility.
Use it as a contextual tool, not a constraint.
ストラテジー説明
📘 概要
本ストラテジーは、EMAクロスオーバー、ダウ理論によるスイング判定、**上位足トレンドの視覚表示(htfTrend)**を組み合わせた複合型の短期トレーディング戦略です。
仮想通貨・FX・株式・指数など幅広いアセットに対応し、デイトレード〜スキャルピング用途に適しています。
動的な利確/損切り、視覚的にわかりやすいエントリー/イグジット、統計表示を搭載しています。
🧠 主な機能
・対象銘柄+外部インデックスのEMAクロスによるトレンド判定
・ダウ理論に基づいたスイング高値・安値検出とトレンド判断
・上位足スイングトレンド(htfTrend)の視覚表示
・RSIフィルターによる過熱・売られすぎの回避
・トレンドの弱まりに応じた部分利確(スケールアウト)
・**損切り閾値(%)**をカスタマイズ可能
・チャート上に損益ラベル表示
・アラート完備(エントリー・決済・部分利確)
・トレンドゾーンを可視化する背景グラデーション
・勝率・ドローダウン・APR・資産増加率などの自動表示
| 設定項目名 | 説明内容 |
| --------------------- | -------------------------- |
| Fast EMA / Slow EMA | 銘柄に対して使用するEMAの期間設定 |
| Index Fast / Slow EMA | 外部インデックスのEMA設定 |
| 損切り(StopLoss) | 損切りラインのしきい値(%で指定) |
| 部分利確しきい値 | トレンド弱化時にスケールアウトする割合(%) |
| RSI期間・水準 | RSI計算期間と、過熱・売られすぎレベル設定 |
| スイング検出期間 | スイング高値・安値の検出に使用するバー数 |
| 統計表示の切り替え | 損益ラベルや統計テーブルの表示/非表示選択 |
🧭 上位足トレンド(htfTrend)について
本スクリプトには、上位足でのスイング高値・安値の更新に基づく**htfTrend(トレンド判定)が含まれています。
これは視覚的な参考情報であり、エントリーやイグジットには直接使用されていません。**
その理由は、上位足を厳密にロジックに組み込むと、トレード機会の損失が増えるためです。
このスクリプトでは、**判断の補助材料として「表示のみに留める」**設計を採用しています。
→ 裁量で「利確を早める」「逆張りを避ける」判断に活用可能です。

EMA inFusion Pro - Multiple SourcesEMA Fusion Pro: Dynamic Trend & Momentum Strategy with Three Exit Modes
EMA Fusion Pro is a highly customizable, multi-exit trend-following strategy designed for traders who value both precision and flexibility. By leveraging exponential moving averages (EMA), average directional index (ADX), and volume analysis, this strategy aims to capture trending market moves while offering three distinct exit modes for optimal risk management across varying market conditions.
Strategy Overview
This strategy systematically identifies potential entry points using a moving average crossover with highly configurable data sources (including price, volume, rate of change, or their Heikin Ashi versions) and filters signal quality with ADX trend strength and volume spikes. Each trade is managed with one of three advanced exit methodologies—reverse signal, ATR-based stop/take profit, or fixed percentage—giving you the control to adapt your risk profile to different market regimes.
Key Features
Customizable EMA Source: Calculate the core trend-filtering EMA from price (default), volume, rate of change, or their Heikin Ashi counterparts for unique market perspectives.
Trend Filter with ADX: Confirm entries only when the trend is strong, as measured by the user-adjustable ADX threshold.
Volume Spike Confirmation: Optional filter to only take trades with above-average volume activity, reducing false signals.
Three Exit Modes:
Reverse Signal: Exit trades when a new, opposite entry signal occurs.
ATR-Based Stop/Take Profit: Dynamic risk management using multiples of the average true range (ATR) for both take profit and stop loss.
Percent-Based Stop/Take Profit: Fixed-percentage risk management with user-defined thresholds.
Visual Annotations: Signal markers, EMA line color-coded by source, trend background coloring, and optional ATR/percent-based TP/SL levels.
Info Panel: Real-time display of all core indicators, current trading mode, exit parameters, and position status for quick oversight.
How It Works
Entry Logic: A crossover signal (above/below the EMA) triggers a new entry, but only if both ADX trend strength and (optionally) volume spike conditions are met.
Exit Logic: Three selectable modes allow you to exit trades on reverse signals, at a dynamic ATR-based profit or loss, or at a fixed percentage gain/loss.
Flexible Data Analysis: The EMA source can be chosen from six options—standard price, volume, rate of change, or their Heikin Ashi variants—allowing experimentation with different market dimensions.
Risk Management: All exits are precisely controlled, either by the next opposing signal, by volatility-adjusted levels, or by fixed risk/reward ratios.
Backtest & Optimization: The strategy is fully backtestable within TradingView’s Strategy Tester, with adjustable parameters for optimization.
Customization & Usage
Indicator Source: Select your preferred data type for EMA calculation, opening the door to creative strategy variations (e.g., volume momentum, pure price trend, rate of change divergence).
Filter Toggles: Enable/disable ADX and volume filters as desired—useful for different market environments.
Exit Mode Selection: Switch between reverse, ATR, or percent-based exits with a single parameter—ideal for adapting to ranging vs. trending markets.
Visual Clarity: The EMA line color reflects its underlying source, and the info panel summarizes all critical values for easy monitoring.
Who Should Use This Strategy?
Trend Followers seeking to ride strong moves with multiple exit options.
Experienced Traders who want to experiment with different data types (volume, momentum, Heikin Ashi) for trend analysis.
Algorithmic Traders looking for a robust, flexible base to build upon with their own ideas.
Getting Started
Apply the script to your chart and review default settings.
Customize parameters—EMA length, ADX threshold, volume settings, exit type—as desired.
Backtest on multiple instruments and timeframes to evaluate performance.
Optimize filters, exit rules, and risk parameters for your preferred trading style.
Monitor with the real-time info panel and trade alerts.
Disclaimer
This script is for educational and entertainment purposes only. It is not financial advice. Past performance is not indicative of future results. Always conduct thorough testing and consider your risk tolerance before trading real capital.
— Happy Trading —
Feel free to adapt, share, and contribute to this open-source strategy!

EMA Cross + RSI + ADX - Autotrade Strategy V2Overview
A versatile trend-following strategy combining EMA 9/21 crossovers with RSI momentum filtering and optional ADX trend strength confirmation. Designed for both cryptocurrency and traditional futures/options markets with built-in stop loss management and automated position reversals.
Key Features
Multi-Market Compatibility: Works on both crypto futures (Bitcoin, Ethereum) and traditional markets (NIFTY, Bank NIFTY, S&P 500 futures, equity options)
Triple Confirmation System: EMA crossover + RSI filter + ADX strength (optional)
Automated Risk Management: 2% stop loss with wick-touch detection
Position Auto-Reversal: Opposite signals automatically close and reverse positions
Webhook Ready: Six distinct alert messages for automation (Entry Buy/Sell, Close Long/Short, SL Hit Long/Short)
Performance Metrics
NIFTY Futures (15min): 50%+ win rate with ADX filter OFF
Crypto Markets: Requires extensive backtesting before live deployment
Optimal Timeframes: 15-minute to 1-hour charts (patience required for higher timeframes)
Strategy Logic
Entry Signals:
LONG: EMA 9 crosses above EMA 21 + RSI > 55 + ADX > 20 (if enabled)
SHORT: EMA 9 crosses below EMA 21 + RSI < 45 + ADX > 20 (if enabled)
Exit Signals:
Opposite EMA crossover (auto-closes current position)
Stop loss hit at 2% from entry price (tracks candle wicks)
Technical Indicators:
Fast EMA: 9-period (short-term trend)
Slow EMA: 21-period (primary trend)
RSI: 14-period with 55/45 thresholds (momentum confirmation)
ADX: 14-period with 20 threshold (trend strength filter - optional)
Market-Specific Settings
Traditional Markets (NIFTY, Bank NIFTY, S&P Futures, Options)
Recommended Settings:
ADX Filter: Turn OFF (less choppy, cleaner trends)
Timeframe: 15-minute chart
Win Rate: 50%+ on NIFTY Futures
Why No ADX: Traditional markets have more institutional participation and smoother price action, making ADX unnecessary
Cryptocurrency Markets (BTC, ETH, Altcoins)
Recommended Settings:
ADX Filter: Turn ON (ADX > 20)
Timeframe: 15-minute to 1-hour
Extensive backtesting required before live trading
Why ADX: Crypto markets are highly volatile and prone to false breakouts; ADX filters low-quality chop
Best Practices
✅ Backtest thoroughly on your specific instrument and timeframe
✅ Use larger timeframes (1H, 4H) for higher quality signals and better risk/reward
✅ Adjust RSI thresholds based on market volatility (try 52/48 for more signals, 60/40 for fewer but stronger)
✅ Monitor ADX effectiveness - disable for traditional markets, enable for crypto
✅ Proper position sizing - adjust default_qty_value based on your capital and instrument price
✅ Paper trade first - test for 2-4 weeks before risking real capital
Risk Management
Fixed 2% stop loss per trade (adjustable)
Stop loss tracks candle wicks for accurate execution
Positions auto-reverse on opposite signals (no manual intervention needed)
0.075% commission built into backtest (adjust for your broker)
Customization Options
All parameters are adjustable via inputs:
EMA periods (default: 9/21)
RSI length and thresholds (default: 14-period, 55/45 levels)
ADX length and threshold (default: 14-period, 20 threshold)
Stop loss percentage (default: 2%)
Webhook Automation
This strategy includes six distinct alert messages for automated trading:
"Entry Buy" - Long position opened
"Entry Sell" - Short position opened
"Close Long" - Long position closed on opposite crossover
"Close Short" - Short position closed on opposite crossover
"SL Hit Long" - Long stop loss triggered
"SL Hit Short" - Short stop loss triggered
Compatible with Delta Exchange, Binance Futures, 3Commas, Alertatron, and other webhook platforms.
Important Notes
⚠️ Crypto markets require extensive backtesting - volatility patterns differ significantly from traditional markets
⚠️ Higher timeframes = better results - 15min works but 1H/4H provide cleaner signals
⚠️ ADX toggle is critical - OFF for traditional markets, ON for crypto
⚠️ Not financial advice - always conduct your own research and use proper risk management
⚠️ Past performance ≠ future results - backtest results may not reflect live trading conditions
Disclaimer
This strategy is for educational and informational purposes only. Trading futures and options involves substantial risk of loss. Always backtest thoroughly, start with paper trading, and never risk more than you can afford to lose. The author assumes no responsibility for any trading losses incurred using this strategy.

EMA Crossover Entry + ATR ExitOverview
A robust trend-following strategy that combines multiple Exponential Moving Averages (EMAs) for precise entry signals with smoothed Average True Range (ATR) for dynamic, volatility-based exits. Designed for traders who want to capture strong trending long-term moves while protecting profits with intelligent stop-loss management.
Strategy Logic
Entry Signal:
- Enters LONG when price closes above EMA 20, AND
- EMA 20 > EMA 50 > EMA 100 > EMA 200 (Perfect bull alignment)
Ensures entry only during confirmed uptrends with all EMAs properly stacked
Exit Signal:
- Uses smoothed ATR.
- Creates dynamic trailing stop that adjusts to market volatility
- Exits when price closes below ATR.
Check volume in addition to this, to boost confidence for your entry.
This works well for Long Term Investment.
Use Daily or Weekly timeframe.
Key Features
✅ Trend Confirmation: Four-EMA stack ensures strong trend alignment before entry
✅ Volatility-Adaptive Exits: ATR smoothing prevents whipsaw exits in choppy markets
Perfect for traders seeking systematic trend-following with professional risk management. Combines the reliability of multiple timeframe trend confirmation with the precision of volatility-based exits.
Happy Investing!
:)
Feel free to provide feedback; I would love to hear from you.
Note:
Strategy executes on bar close to prevent repainting.
Past performance does not guarantee future results.
Use proper risk management.

EMA Mega Cross StrategyBased on Anvamsi's script which uses 12/26 EMA crosses for entry/exit signals. I also add the following features:
* Optimized default parameters for ETH 4hr chart
* Use EMA 55/200 relationship to filter out signals
* Use RSI vs EMA of RSI to filter out signals
* Use 26/55 EMA relationship to filter out signals
* Use volume climax technique as an additional exit strategy
* Uses bull/bear RSI divs as an additional exit strategy
* Adds bull RSI div quick flip plays when nothing else is going on for extra $$
This very experimental and my first major script. I've kept it invite only because the only people using this should have a direct line of communication open with me at this point.
NOTE #1:
You can get 2018 ETH trade profitability to reach 100% if you change line 97 from:
if (shortEMA and (rsi1 <= ema(rsi1,RSIEMALength)) and shorttrend and (ema(close,26) < ema(close,55)))
to:
if (shortEMA and (rsi1 <= ema(rsi1,RSIEMALength)) and shorttrend)
Basically, you remove an extra filter from the short strategy. It's novel to see profitability hit 100% but if you look at performance from 2017, it increases the max draw down by a lot!
NOTE #2:
I couldn't get RSI bear div quick flips to work so they are disabled. The remaining short strategy is in effect.
NOTE #3:
The profitability is good for long-only, if you check Strategy Tester->Performance Summary.
NOTE #4:
I am not an expert trader (mainly due to psychological factors i think) but i can program and have a good understanding of signal processing from working with analog synthesizers. Use this at your own risk. I am not liable if you lose all of your money!
NOTE #5:
Code is really messy. Old code commented out everywhere. :/

EMA Grid + Martingale Strategy (Long-Only) with CooldownTitle:
EMA Grid + Martingale Strategy (Long-Only) with Cooldown
Short Summary:
A long-only strategy combining EMA trend filters, grid-based entries, optional martingale sizing, and a cooldown feature to manage position timing and exits.
Full Description:
This strategy uses a 4-EMA trend confirmation system to detect bullish momentum, then deploys a grid-style entry method with optional martingale position sizing. It includes a cooldown mechanism to prevent reentry too soon after a completed trade cycle.
How It Works
1. Trend Confirmation: Two EMA groups (fast/slow) determine whether market conditions are bullish.
2. Initial Entry: A new position is entered when both EMA groups confirm an uptrend and no position is currently active.
3. Grid Entries: Additional long entries are placed when price drops by a defined pip distance from the last entry, respecting the maximum number of entries.
4. Martingale Sizing (Optional): Grid orders can increase in size with each level using a customizable multiplier.
5. Weighted-Average Exit: All positions close once price reaches or exceeds the average entry price plus a buffer.
6. Cooldown Timer: After closing a position set, the strategy waits a defined number of bars before opening a new grid.
Key Features
• 4 customizable EMAs for trend confirmation.
• Dynamic grid-style long entries based on pip intervals.
• Optional martingale-style position sizing.
• Weighted-average price exit logic with buffer control.
• Cooldown bar period to limit overtrading.
• Suitable for optimization and backtesting with full control over inputs.
Use Cases
• Designed for trending markets where pullbacks present entry opportunities.
• Helps manage staged entries while avoiding premature reentry.
• Ideal for testing martingale and grid-based strategies with exit precision.
Note: This strategy is for testing and educational purposes only. It does not guarantee profits and is not financial advice.

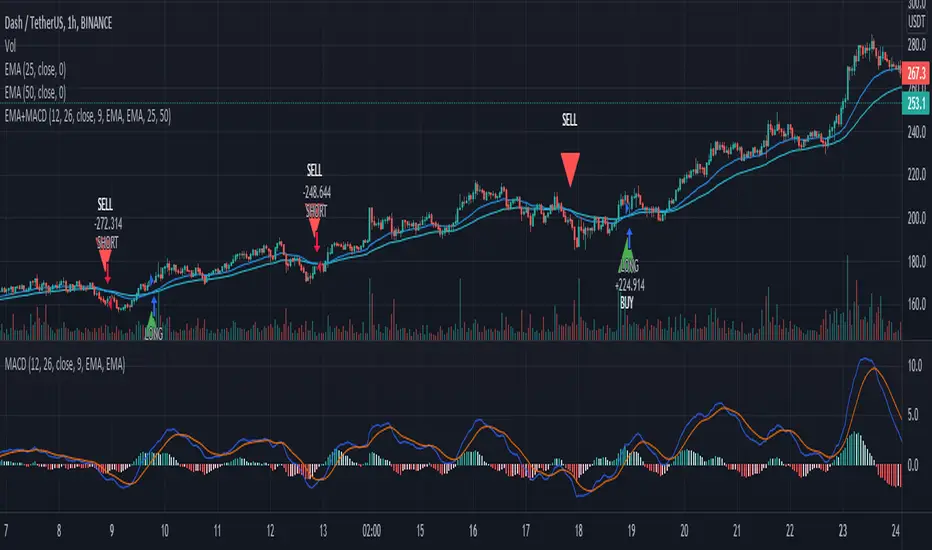
EMA+MACDA simple script using EMA 25 and EMA 50 with MACD. Enter long when EMA 25 crossover ema 50 and MACD line > 0, enter short when EMA 50 crossover ema 25 and MACD < 0
EMA Cloud Intraday Strategy********NOT TRADING ADVICE - USE AT YOUR OWN RISK - TRADING IS RISKY - DO NOT BLINDLY FOLLOW THE SIGNALS FROM THIS STRATEGY********
This strategy utilizes the 9 and 20 period exponential moving averages to create a colored cloud between similar to what is seen on the Ichimoku Cloud. The strategy closes all trades by the end of the trading day. Entry is when the price closes above a Green (9 EMA above 20 EMA) cloud or below a Red (9 EMA below 20 EMA) cloud. Exit is when price closes against the 9 EMA or at the end of the trading day. Running the strategy tester on different intraday time frames will show the best time frame for a given Symbol. For example, I have found that the best results are returned by this strategy for SPY on the 30 minute time frame.
********NOT TRADING ADVICE - USE AT YOUR OWN RISK - TRADING IS RISKY - DO NOT BLINDLY FOLLOW THE SIGNALS FROM THIS STRATEGY********

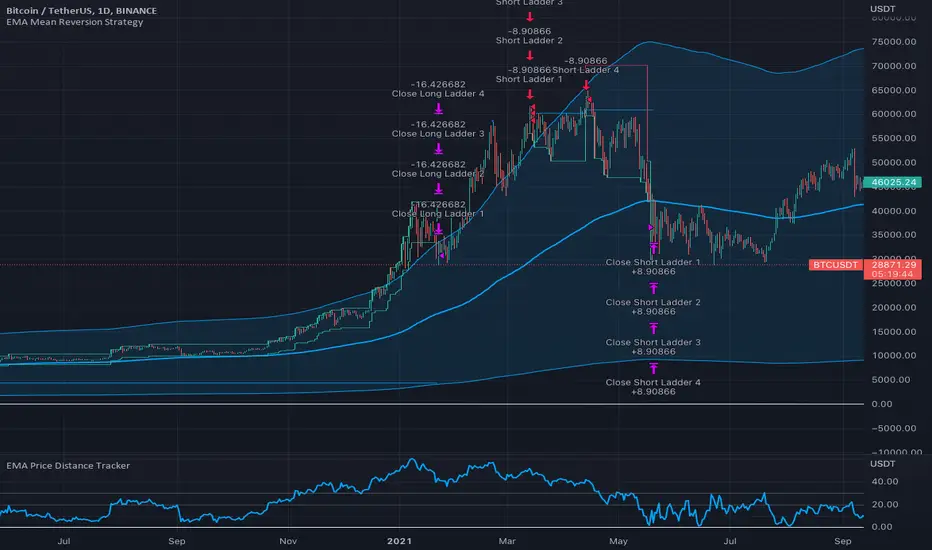
EMA Mean Reversion StrategyThis strategy is built on the simple idea that when the price gets far enough away from an EMA, it's bound to reverse. This strategy uses the percent distance the price is from the EMA to trigger ladder orders and sells when the price crosses a trailing stop. This strategy uses the EMA Price Distance Tracker indicator .
Ema ScalpThis is another simple strategy based on ema
Entry Buy - 1) when close crossover ema then buy and only open one trade till it not close
2) if previous buy trade is profitable open another trade and check again trade is profitable or not
3)if trade is not profitable reset and wait for sell condition...
Entry Sell -1) when close crossunder ema then sell and only open one trade till it not close
2) if previous sell trade is profitable open another trade and check again trade is profitable or not
3) if trade is not profitable reset and wait for buy condition.....
stop loss and take profit is percentage based ...

EMA(Rsi,length) Strategy onEMAのソースをRsi、期間をlenght(=デフォルトでは5)としたもの作成しました。
作成したものはデフォルトで黄色で表れております。
インジケーター上の緑色は、通常のRSIです
作成した際に参考にした足と通貨
5分足のUSDJPYとEURUSD
主にデイトレ目線で作っております。
デフォルト設定では
"EMAが75を上抜け、または25を下抜けた際に逆張りでエントリーをするもの"
として作成しております。
◎利確と損切りの幅ならびにインジケーター上の水平線は変更可能となっており、変更後はストラテジーテスターの各値も付随して自動変更します。
設定画面の各項目
RSI : 一般的なRSIの終値に対しての期間(デフォルトでは14)
Length : EMAでの期間をlengthとしております(デフォルトでは5)
up、downはインジケーター表示上のデフォルトでの75と25の水平線の位置
shortprofit,shortloss : ショートで入るとした場合の利確と損切りの長さ。(longprofit,longlossについても同様)
なおショートのポジションを持っている際にロングのポジションエントリーポイントに入った際は、持ってるショートのポジションは手仕舞いし、新たなロングのみポジションをもつようになっております。
免責事項ならびにお願い:上記の様に、各値、ならびにストラテジーテスターを設定しているつもりですが、プログラミングの入力ミスなどがある場合がございます。お知らせいただけますと幸いです。
また、投資をする際はご自身の責任と判断にて投資をなさるようお願いいたします。
