Wave Channel 3D Wave Channel 3D
Built by Ricardo idea from JR & Aloakdutt from indieTrades Jan. 2010
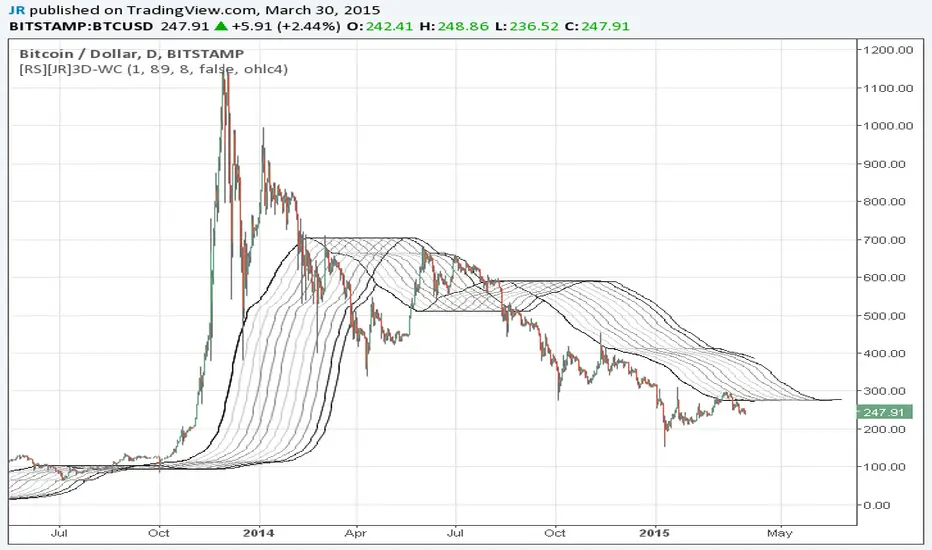
This indicator is very easy to build. We utilize Moving Averages with a set multiplier and an offset. Specially we try to use Fibonacci sequence series numbers (1, 2, 3, 5, 8, 13, 21, 34, 55, 89, 144...) as time space and multiplier (default 89, 8). Also included is Donchian Channel to locate strong trends and possible future support - resistance.
Examples of support/resistance on chart.
Dominant Price Trends
Future Support Resistance
Comparing Fibonacci Series Time Space - Multiplier
When Comparing make note of confluence support/resistance showing up with Fibonacci Series
Example uses DC
When Comparing make note of confluence support/resistance showing up with Fibonacci Series
Example without DC / Smooth MA
Wyszukaj w skryptach "donchian"
Weight of Evidence BF**For Stocks (requires volume data) **
The premise of this indicator is that the wisdom of many is greater than one. The idea is you can throw out most of your indicators and simply adopt the Weight of the Evidence instead.
Eight indicators and five periods combine to give forty separate readings on a stock. These are all checked against a threshold to give a pass or fail score. The total is taken and a score is given out of 100 in increments of 2.5.
Four indicators are momentum-based: EMA, RSI, PercentRank, Lower Donchian Channel
Three are price-volume based:On Balance Volume, Price Volume Trend, Accumulation/Distribution
One is volatility-based: (Simplified) Volatility Stop
I have tried to make things simple with the entered periods being applied to all indicators. For some like on balance volume its actually a look back period for comparison of values. For the volatility stop I use the 3rd period for lookback and combine with 1 to 5 times ATR.
As this is a stepped function which can react rapidly it makes sense to smooth it with something like a 3-bar EMA, which is included by default.
Play around with the periods and different bar lengths to find something you like. I actually chose the default values with daily bars in mind but it seems to work well on weeklies! If you have other preferred indicators you could edit this script and substitute your own, although it is easiest to stick with the built-in functions as I have done.
Let me know how you get on with this and good trading to all!

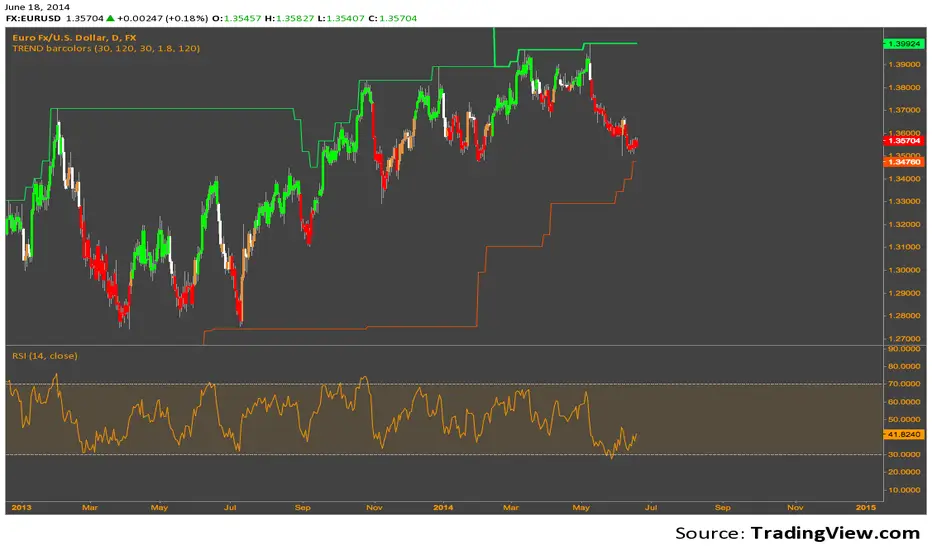
TREND barcolorsThe Donchian values are basically from Ed Sekoytas original statistical run, that gave the values 30 & 120 (aren't as relevant today, but still packs a punch).
The idea of this code is just to take that 30, add a very simple inset of it, with ATR, and color code the bar Green or Red to indicate the direction of the trend. When a new break of the 120 line, (thick line) higher or lower, it typically indicates a bigger bias towards the trend.
It's my first publish, and so a very simple easy to understand system.
Use at your own risk. I cannot be held liable for any damages financial or otherwise, directly or indirectly related to using this script.