MovingAveragesLibraryLibrary "MovingAveragesLibrary"
This is a library allowing one to select between many different Moving Average formulas to smooth out any float variable.
You can use this library to apply a Moving Average function to any series of data as long as your source is a float.
The default application would be for applying Moving Averages onto your chart. However, the scope of this library is beyond that. Any indicator or strategy you are building can benefit from this library.
You can apply different types of smoothing and moving average functions to your indicators, momentum oscillators, average true range calculations, support and resistance zones, envelope bands, channels, and anything you can think of to attempt to smooth out noise while finding a delicate balance against lag.
If you are developing an indicator, you can use the 'ave_func' to allow your users to select any Moving Average for any function or variable by creating an input string with the following structure:
var_name = input.string(, , )
Where the types of Moving Average you would like to be provided would be included in options.
Example:
i_ma_type = input.string(title = "Moving Average Type", defval = "Hull Moving Average", options = )
Where you would add after options the strings I have included for you at the top of the PineScript for your convenience.
Then for the output you desire, simply call 'ave_func' like so:
ma = ave_func(source, length, i_ma_type)
Now the plotted Moving Average will be the same as what you or your users select from the Input.
ema(src, len) Exponential Moving Average.
Parameters:
src : Series to use ('close' is used if no argument is supplied).
len : Lookback length to use.
Returns: Float value.
sma(src, len) Simple Moving Average.
Parameters:
src : Series to use ('close' is used if no argument is supplied).
len : Lookback length to use.
Returns: Float value.
rma(src, len) Relative Moving Average.
Parameters:
src : Series to use ('close' is used if no argument is supplied).
len : Lookback length to use.
Returns: Float value.
wma(src, len) Weighted Moving Average.
Parameters:
src : Series to use ('close' is used if no argument is supplied).
len : Lookback length to use.
Returns: Float value.
dv2(len) Donchian V2 function.
Parameters:
len : Lookback length to use.
Returns: Open + Close / 2 for the selected length.
ModFilt(src, len) Modular Filter smoothing function.
Parameters:
src : Series to use ('close' is used if no argument is supplied).
len : Lookback length to use.
Returns: Float value.
EDSMA(src, len) Ehlers Dynamic Smoothed Moving Average.
Parameters:
src : Series to use ('close' is used if no argument is supplied).
len : Lookback length to use.
Returns: EDSMA smoothing.
dema(x, t) Double Exponential Moving Average.
Parameters:
x : Series to use ('close' is used if no argument is supplied).
t : Lookback length to use.
Returns: DEMA smoothing.
tema(src, len) Triple Exponential Moving Average.
Parameters:
src : Series to use ('close' is used if no argument is supplied).
len : Lookback length to use.
Returns: TEMA smoothing.
smma(x, t) Smoothed Moving Average.
Parameters:
x : Series to use ('close' is used if no argument is supplied).
t : Lookback length to use.
Returns: SMMA smoothing.
vwma(x, t) Volume Weighted Moving Average.
Parameters:
x : Series to use ('close' is used if no argument is supplied).
t : Lookback length to use.
Returns: VWMA smoothing.
hullma(x, t) Hull Moving Average.
Parameters:
x : Series to use ('close' is used if no argument is supplied).
t : Lookback length to use.
Returns: Hull smoothing.
covwma(x, t) Coefficient of Variation Weighted Moving Average.
Parameters:
x : Series to use ('close' is used if no argument is supplied).
t : Lookback length to use.
Returns: COVWMA smoothing.
frama(x, t) Fractal Reactive Moving Average.
Parameters:
x : Series to use ('close' is used if no argument is supplied).
t : Lookback length to use.
Returns: FRAMA smoothing.
kama(x, t) Kaufman's Adaptive Moving Average.
Parameters:
x : Series to use ('close' is used if no argument is supplied).
t : Lookback length to use.
Returns: KAMA smoothing.
donchian(len) Donchian Calculation.
Parameters:
len : Lookback length to use.
Returns: Average of the highest price and the lowest price for the specified look-back period.
tma(src, len) Triangular Moving Average.
Parameters:
src : Series to use ('close' is used if no argument is supplied).
len : Lookback length to use.
Returns: TMA smoothing.
VAMA(src, len) Volatility Adjusted Moving Average.
Parameters:
src : Series to use ('close' is used if no argument is supplied).
len : Lookback length to use.
Returns: VAMA smoothing.
Jurik(src, len) Jurik Moving Average.
Parameters:
src : Series to use ('close' is used if no argument is supplied).
len : Lookback length to use.
Returns: JMA smoothing.
MCG(src, len) McGinley smoothing.
Parameters:
src : Series to use ('close' is used if no argument is supplied).
len : Lookback length to use.
Returns: McGinley smoothing.
zlema(series, length) Zero Lag Exponential Moving Average.
Parameters:
series : Series to use ('close' is used if no argument is supplied).
length : Lookback length to use.
Returns: ZLEMA smoothing.
xema(src, len) Optimized Exponential Moving Average.
Parameters:
src : Series to use ('close' is used if no argument is supplied).
len : Lookback length to use.
Returns: XEMA smoothing.
EhlersSuperSmoother(src, lower) Ehlers Super Smoother.
Parameters:
src : Series to use ('close' is used if no argument is supplied).
lower : Smoothing value to use.
Returns: Ehlers Super smoothing.
EhlersEmaSmoother(sig, smoothK, smoothP) Ehlers EMA Smoother.
Parameters:
sig : Series to use ('close' is used if no argument is supplied).
smoothK : Lookback length to use.
smoothP : Smothing value to use.
Returns: Ehlers EMA smoothing.
ave_func(in_src, in_len, in_type) Returns the source after running it through a Moving Average function.
Parameters:
in_src : Series to use ('close' is used if no argument is supplied).
in_len : Lookback period to be used for the Moving Average function.
in_type : Type of Moving Average function to use. Must have a string input to select the options from that MUST match the type-casing in the function below.
Returns: The source as a float after running it through the Moving Average function.
Wyszukaj w skryptach "donchian"

pandas_taLibrary "pandas_ta"
Level: 3
Background
Today is the first day of 2022 and happy new year every tradingviewers! May health and wealth go along with you all the time. I use this chance to publish my 1st PINE v5 lib : pandas_ta
This is not a piece of cake like thing, which cost me a lot of time and efforts to build this lib. Beyond 300 versions of this script was iterated in draft.
Function
Library "pandas_ta"
PINE v5 Counterpart of Pandas TA - A Technical Analysis Library in Python 3 at github.com
The Original Pandas Technical Analysis (Pandas TA) is an easy to use library that leverages the Pandas package with more than 130 Indicators and Utility functions and more than 60 TA Lib Candlestick Patterns.
I realized most of indicators except Candlestick Patterns because tradingview built-in Candlestick Patterns are even more powerful!
I use this to verify pandas_ta python version indicators for myself, but I realize that maybe many may need similar lib for pine v5 as well.
Function Brief Descriptions (Pls find details in script comments)
bton --> Binary to number
wcp --> Weighted Closing Price (WCP)
counter --> Condition counter
xbt --> Between
ebsw --> Even Better SineWave (EBSW)
ao --> Awesome Oscillator (AO)
apo --> Absolute Price Oscillator (APO)
xrf --> Dynamic shifted values
bias --> Bias (BIAS)
bop --> Balance of Power (BOP)
brar --> BRAR (BRAR)
cci --> Commodity Channel Index (CCI)
cfo --> Chande Forcast Oscillator (CFO)
cg --> Center of Gravity (CG)
cmo --> Chande Momentum Oscillator (CMO)
coppock --> Coppock Curve (COPC)
cti --> Correlation Trend Indicator (CTI)
dmi --> Directional Movement Index(DMI)
er --> Efficiency Ratio (ER)
eri --> Elder Ray Index (ERI)
fisher --> Fisher Transform (FISHT)
inertia --> Inertia (INERTIA)
kdj --> KDJ (KDJ)
kst --> 'Know Sure Thing' (KST)
macd --> Moving Average Convergence Divergence (MACD)
mom --> Momentum (MOM)
pgo --> Pretty Good Oscillator (PGO)
ppo --> Percentage Price Oscillator (PPO)
psl --> Psychological Line (PSL)
pvo --> Percentage Volume Oscillator (PVO)
qqe --> Quantitative Qualitative Estimation (QQE)
roc --> Rate of Change (ROC)
rsi --> Relative Strength Index (RSI)
rsx --> Relative Strength Xtra (rsx)
rvgi --> Relative Vigor Index (RVGI)
slope --> Slope
smi --> SMI Ergodic Indicator (SMI)
sqz* --> Squeeze (SQZ) * NOTE: code sufferred from very strange error, code was commented.
sqz_pro --> Squeeze PRO(SQZPRO)
xfl --> Condition filter
stc --> Schaff Trend Cycle (STC)
stoch --> Stochastic (STOCH)
stochrsi --> Stochastic RSI (STOCH RSI)
trix --> Trix (TRIX)
tsi --> True Strength Index (TSI)
uo --> Ultimate Oscillator (UO)
willr --> William's Percent R (WILLR)
alma --> Arnaud Legoux Moving Average (ALMA)
xll --> Dynamic rolling lowest values
dema --> Double Exponential Moving Average (DEMA)
ema --> Exponential Moving Average (EMA)
fwma --> Fibonacci's Weighted Moving Average (FWMA)
hilo --> Gann HiLo Activator(HiLo)
hma --> Hull Moving Average (HMA)
hwma --> HWMA (Holt-Winter Moving Average)
ichimoku --> Ichimoku Kinkō Hyō (ichimoku)
jma --> Jurik Moving Average Average (JMA)
kama --> Kaufman's Adaptive Moving Average (KAMA)
linreg --> Linear Regression Moving Average (linreg)
mgcd --> McGinley Dynamic Indicator
rma --> wildeR's Moving Average (RMA)
sinwma --> Sine Weighted Moving Average (SWMA)
ssf --> Ehler's Super Smoother Filter (SSF) © 2013
supertrend --> Supertrend (supertrend)
xsa --> X simple moving average
swma --> Symmetric Weighted Moving Average (SWMA)
t3 --> Tim Tillson's T3 Moving Average (T3)
tema --> Triple Exponential Moving Average (TEMA)
trima --> Triangular Moving Average (TRIMA)
vidya --> Variable Index Dynamic Average (VIDYA)
vwap --> Volume Weighted Average Price (VWAP)
vwma --> Volume Weighted Moving Average (VWMA)
wma --> Weighted Moving Average (WMA)
zlma --> Zero Lag Moving Average (ZLMA)
entropy --> Entropy (ENTP)
kurtosis --> Rolling Kurtosis
skew --> Rolling Skew
xev --> Condition all
zscore --> Rolling Z Score
adx --> Average Directional Movement (ADX)
aroon --> Aroon & Aroon Oscillator (AROON)
chop --> Choppiness Index (CHOP)
xex --> Condition any
cksp --> Chande Kroll Stop (CKSP)
dpo --> Detrend Price Oscillator (DPO)
long_run --> Long Run
psar --> Parabolic Stop and Reverse (psar)
short_run --> Short Run
vhf --> Vertical Horizontal Filter (VHF)
vortex --> Vortex
accbands --> Acceleration Bands (ACCBANDS)
atr --> Average True Range (ATR)
bbands --> Bollinger Bands (BBANDS)
donchian --> Donchian Channels (DC)
kc --> Keltner Channels (KC)
massi --> Mass Index (MASSI)
natr --> Normalized Average True Range (NATR)
pdist --> Price Distance (PDIST)
rvi --> Relative Volatility Index (RVI)
thermo --> Elders Thermometer (THERMO)
ui --> Ulcer Index (UI)
ad --> Accumulation/Distribution (AD)
cmf --> Chaikin Money Flow (CMF)
efi --> Elder's Force Index (EFI)
ecm --> Ease of Movement (EOM)
kvo --> Klinger Volume Oscillator (KVO)
mfi --> Money Flow Index (MFI)
nvi --> Negative Volume Index (NVI)
obv --> On Balance Volume (OBV)
pvi --> Positive Volume Index (PVI)
dvdi --> Dual Volume Divergence Index (DVDI)
xhh --> Dynamic rolling highest values
pvt --> Price-Volume Trend (PVT)
Remarks
I also incorporated func descriptions and func test script in commented mode, you can test the functino with the embedded test script and modify them as you wish.
This is a Level 3 free and open source indicator library.
Feedbacks are appreciated.
This is not the end of pandas_ta lib publication, but it is start point with pine v5 lib function and I will add more and more funcs into this lib for my own indicators.
Function Name List:
bton()
wcp()
count()
xbt()
ebsw()
ao()
apo()
xrf()
bias()
bop()
brar()
cci()
cfo()
cg()
cmo()
coppock()
cti()
dmi()
er()
eri()
fisher()
inertia()
kdj()
kst()
macd()
mom()
pgo()
ppo()
psl()
pvo()
qqe()
roc()
rsi()
rsx()
rvgi()
slope()
smi()
sqz_pro()
xfl()
stc()
stoch()
stochrsi()
trix()
tsi()
uo()
willr()
alma()
wcx()
xll()
dema()
ema()
fwma()
hilo()
hma()
hwma()
ichimoku()
jma()
kama()
linreg()
mgcd()
rma()
sinwma()
ssf()
supertrend()
xsa()
swma()
t3()
tema()
trima()
vidya()
vwap()
vwma()
wma()
zlma()
entropy()
kurtosis()
skew()
xev()
zscore()
adx()
aroon()
chop()
xex()
cksp()
dpo()
long_run()
psar()
short_run()
vhf()
vortex()
accbands()
atr()
bbands()
donchian()
kc()
massi()
natr()
pdist()
rvi()
thermo()
ui()
ad()
cmf()
efi()
ecm()
kvo()
mfi()
nvi()
obv()
pvi()
dvdi()
xhh()
pvt()

Keltner Channel With User Selectable Moving AvgKeltner Channel with user options to calculate the moving average basis and envelopes from a variety of different moving averages.
The user selects their choice of moving average, and the envelopes automatically adjust. The user may select a MA that reacts faster to volatility or slower/smoother.
Added additional options to color the envelopes or basis based on the current trend and alternate candle colors for envelope touches. The script has a rainbow gradient by default based on RSI.
Options (generally from slower/smoother to faster/more responsive to volatility):
SMMA,
SMA,
Donchian, (Note: Selecting Donchian will just convert this indicator to a regular Donchian Channel)
Tillson T3,
EMA,
VWMA,
WMA,
EHMA,
ALMA,
LSMA,
HMA,
TEMA
Value Added:
Allows Keltner Channel to be calculated from a variety of moving averages other than EMA/SMA, including ones that are well liked by traders such as Tillson T3, ALMA, Hull MA, and TEMA.
Glossary:
The Hull Moving Average ( HMA ), developed by Alan Hull, is an extremely fast and smooth moving average . In fact, the HMA almost eliminates lag altogether and manages to improve smoothing at the same time.
The Exponential Hull Moving Average is similar to the standard Hull MA, but with superior smoothing. The standard Hull Moving Average is derived from the weighted moving average ( WMA ). As other moving average built from weighted moving averages it has a tendency to exaggerate price movement.
Weighted Moving Average: A Weighted Moving Average ( WMA ) is similar to the simple moving average ( SMA ), except the WMA adds significance to more recent data points.
Arnaud Legoux Moving Average: ALMA removes small price fluctuations and enhances the trend by applying a moving average twice, once from left to right, and once from right to left. At the end of this process the phase shift (price lag) commonly associated with moving averages is significantly reduced. Zero-phase digital filtering reduces noise in the signal. Conventional filtering reduces noise in the signal, but adds a delay.
Least Squares: Based on sum of least squares method to find a straight line that best fits data for the selected period. The end point of the line is plotted and the process is repeated on each succeeding period.
Triple EMA (TEMA) : The triple exponential moving average (TEMA) was designed to smooth price fluctuations, thereby making it easier to identify trends without the lag associated with traditional moving averages (MA). It does this by taking multiple exponential moving averages (EMA) of the original EMA and subtracting out some of the lag.
Running (SMoothed) Moving Average: A Modified Moving Average (MMA) (otherwise known as the Running Moving Average (RMA), or SMoothed Moving Average (SMMA)) is an indicator that shows the average value of a security's price over a period of time. It works very similar to the Exponential Moving Average, they are equivalent but for different periods (e.g., the MMA value for a 14-day period will be the same as EMA-value for a 27-days period).
Volume-Weighted Moving Average: The Volume-weighted Moving Average (VWMA) emphasizes volume by weighing prices based on the amount of trading activity in a given period of time. Users can set the length, the source and an offset. Prices with heavy trading activity get more weight than prices with light trading activity.
Tillson T3: The Tillson moving average a.k.a. the Tillson T3 indicator is one of the smoothest moving averages and is both composite and adaptive.

+ Balance of PowerThe Balance of Power is an indicator that measures the strength of buyers versus that of sellers in the market, and needs to be smoothed by a moving average to be of much practical use (come to think of it, most indicators are smoothed by a moving average; this is why the RSI lookback mostly commonly used is 14, and not 1, but I digress...). I suppose it is possible to use it without smoothing, but that would be very difficult I think.
The oscillator pivots around a center line, and as with most indicators like this, above 0 is generally considered bullish in a bullish trend, and vice versa in a downtrend.
It can be good for spotting divergences (moreso with smaller lookback periods than I like).
To wit, you might be wondering why I have the default lookback period set at such a large number. My only answer I can give is that I prefer it that way.
The indicator is quite choppy, even when smoothed. The long period helps me to make beter sense of the data (smooth it with a Hull or Jurik MA and you get a different story, though).
In my version of this indicator I provide a pretty broad selection of moving averages with which one may choose to smooth out the BOP, as well as an EMA provided to use as a sort of signal line for trade entries and/or exits, taking partial profits, scaling into a position, etc.
I've also added the option for a second BOP, which is on by default. I think you might find the results interesting by pairing differently smoothed BOPs together.
Of course, you don't have to use both. In the case of the default settings you might look at the EMA-BOP crossing the JMA-BOP as an opportunity to look into exiting or entering trades.
Candle coloring is, as usual, included. I'd say I kind of overdid it here, but that seems to be my style. I just couldn't deal with the fact that with the indicator set to cumulative modes there is no zero line, therefor the color of the indicator plot and the candle coloring would not match the color swatches for bullish/bearish colors. So, there are selections for cumulative indicator/candle colors, and standard indicator/candle colors. Donchian Channels obviously doesn't matter because the colors of things are based on the channel only.
I've added Donchian channel bands (which I've begun adding to many of my indicators), and all necessary alerts as well.
The Donchian Channels can be a really effective tool for entering and exiting trades. I haven't mentioned it in my other indicators that have it, so I will here:
The outermost edge of the band is that which references the indicator for where it is plotted, and the inner channel is sort of dragged along, creating the band
It's a simple mathematical calculation that TradingView actually provided themselves in their manual for pinescript.
When the BOP (or any other indicator using this) enters the band and then exits that could be an indication that price may be reversing, this the bands themselves act, or rather, show a current area of support/resistance for the BOP plot.
One thing that I did with it that they did not, is give the user the ability to change the width of the band. It can only go so narrow, obviously, but anywhere from three (quite wide) to eight is probably sufficient.
I've also provided the option of plotting the BOP as a cumulative line (like OBV), making it no longer an indicator which oscillates around a central pivot.
Because the balance of power is plotted as an accumulation, you may actually want to set the lookback to 1 (it works because it's not an oscillator then).
If you wish to smooth the noise, I suspect a low number would be acceptable here, but it's not necessary.
Oh, and lastly (almost forgot, as this was a late addition), I've added options for the BOPs calculated with volume as well. Gives a different bit of a perspective on the market, versus the traditional version which does not include volume. Screenshots below.
The above image is the balance of power calculated with volume. You can see the obvious difference versus the traditional indicator, where price is in a downtrend and you'd want to sell the orange.
Cumulative version. Looks a lot like OBV.
Cumulative version with volume.

enhanced_taLibrary "enhanced_ta"
Collection of all custom and enhanced TA indicators
ma(source, maType, length) returns custom moving averages
Parameters:
source : Moving Average Source
maType : Moving Average Type : Can be sma, ema, hma, rma, wma, vwma, swma, highlow
length : Moving Average Length
Returns: moving average for the given type and length
bb(source, maType, length, multiplier) returns Bollinger band for custom moving average
Parameters:
source : Moving Average Source
maType : Moving Average Type : Can be sma, ema, hma, rma, wma, vwma, swma, highlow
length : Moving Average Length
multiplier : Standard Deviation multiplier
Returns: Bollinger band with custom moving average for given source, length and multiplier
bbw(source, maType, length, multiplier) returns Bollinger bandwidth for custom moving average
Parameters:
source : Moving Average Source
maType : Moving Average Type : Can be sma, ema, hma, rma, wma, vwma, swma, highlow
length : Moving Average Length
multiplier : Standard Deviation multiplier
Returns: Bollinger Bandwidth for custom moving average for given source, length and multiplier
bpercentb(source, maType, length, multiplier) returns Bollinger Percent B for custom moving average
Parameters:
source : Moving Average Source
maType : Moving Average Type : Can be sma, ema, hma, rma, wma, vwma, swma, highlow
length : Moving Average Length
multiplier : Standard Deviation multiplier
Returns: Bollinger Percent B for custom moving average for given source, length and multiplier
kc(source, maType, length, multiplier) returns Keltner Channel for custom moving average
Parameters:
source : Moving Average Source
maType : Moving Average Type : Can be sma, ema, hma, rma, wma, vwma, swma, highlow
length : Moving Average Length
multiplier : Standard Deviation multiplier
Returns: Keltner Channel for custom moving average for given souce, length and multiplier
kcw(source, maType, length, multiplier) returns Keltner Channel Width with custom moving average
Parameters:
source : Moving Average Source
maType : Moving Average Type : Can be sma, ema, hma, rma, wma, vwma, swma, highlow
length : Moving Average Length
multiplier : Standard Deviation multiplier
Returns: Keltner Channel Width for custom moving average
kpercentk(source, maType, length, multiplier) returns Keltner Channel Percent K Width with custom moving average
Parameters:
source : Moving Average Source
maType : Moving Average Type : Can be sma, ema, hma, rma, wma, vwma, swma, highlow
length : Moving Average Length
multiplier : Standard Deviation multiplier
Returns: Keltner Percent K for given moving average, source, length and multiplier
dc(source, useCustomSource, length) returns Custom Donchian Channel
Parameters:
source : - Custom source
useCustomSource : - Custom source is used only if useCustomSource is set to true
length : - donchian channel length
Returns: Donchian channel
oscillatorRange(source, method, highlowLength, rangeLength) returns Custom overbought/oversold areas for an oscillator input
Parameters:
source : - Osillator source such as RSI, COG etc.
method : - Valid values for method are : sma, ema, hma, rma, wma, vwma, swma, highlow
highlowLength : - length on which highlow of the oscillator is calculated
rangeLength : - length used for calculating oversold/overbought range - usually same as oscillator length
Returns: Dynamic overbought and oversold range for oscillator input

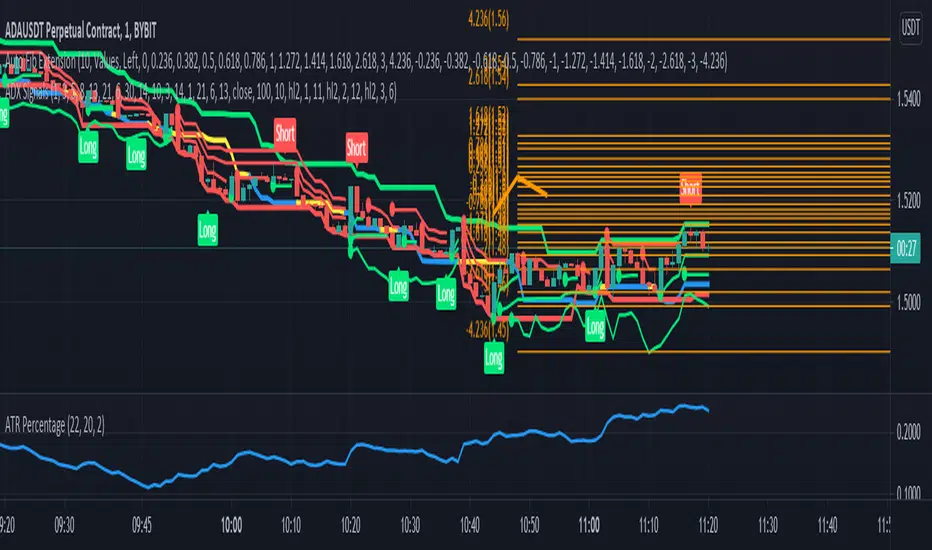
ADX SignalsThis script uses the Average Direction Index, On Balance Volume, and Exponential Moving Average, Moving Average Cross, MACD, Donchian Channels and two Parabolic SARs for stop loss, a normal one and a line one.
I tried to make the script as straightforward as possible, Buy when there is a buy signal and sell when there is a sell signal. I like using it on the smaller time-frames because I'm a scalper and I like going in and out quickly, but this indicator can be used on any timeframe and works on any instrument. The buy signal is triggered when the DI+ goes above the 30 level, the ADX is not increasing, on balance volume is at it's lowest, the price is above the lower Donchian Channel and last MACD hist bar is lower than the previous one. The sell signal is triggered when the DI- goes above the 30 level, the ADX is not increasing, on balance volume is at it's highest, the price is below the upper Donchian Channel and last MACD hist bar is upper than the previous one.
If you have any suggestions feel free to leave them in the comments below or Message me directly.
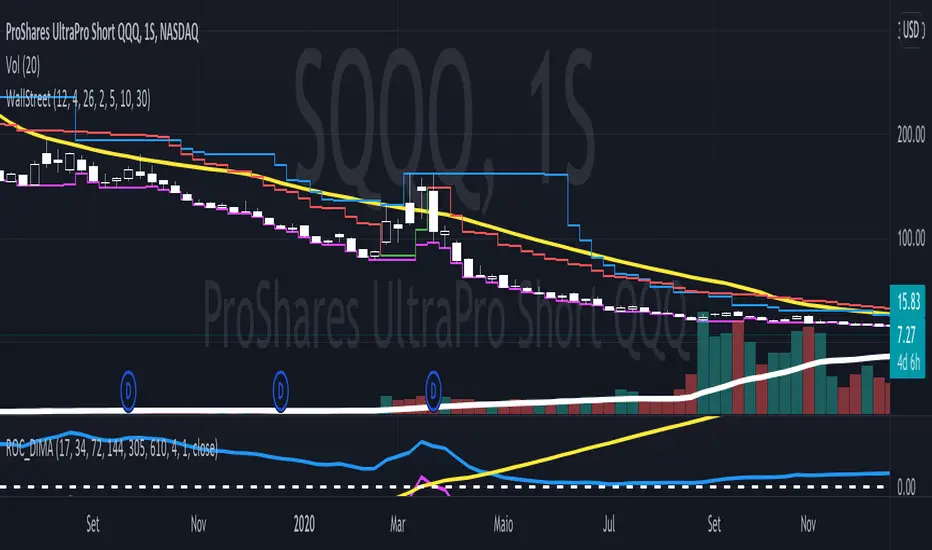
Follow Trend - Wall Street StrategyIt is a mix of three common indicators, they are The High band level of Donchian Channel, 6 emas (17, 34, 72, 144, 200 and 305), and 2 VStop with different multipliers.
We search stocks are going higher and higher each time. So we look at the High-level Donchian band and if the price made a little correction and didn't touch the VStop indicator and, the price is higher than all the ema's. So we try to buy the stocks when it pass through the last highest price.
The Vstop-short we use to stocks and commodities.
The VStop-long, we use to Bonds and Reits.
In order to help, there is a triangle when the price crossover any VStop, at least the half of Donchian period.
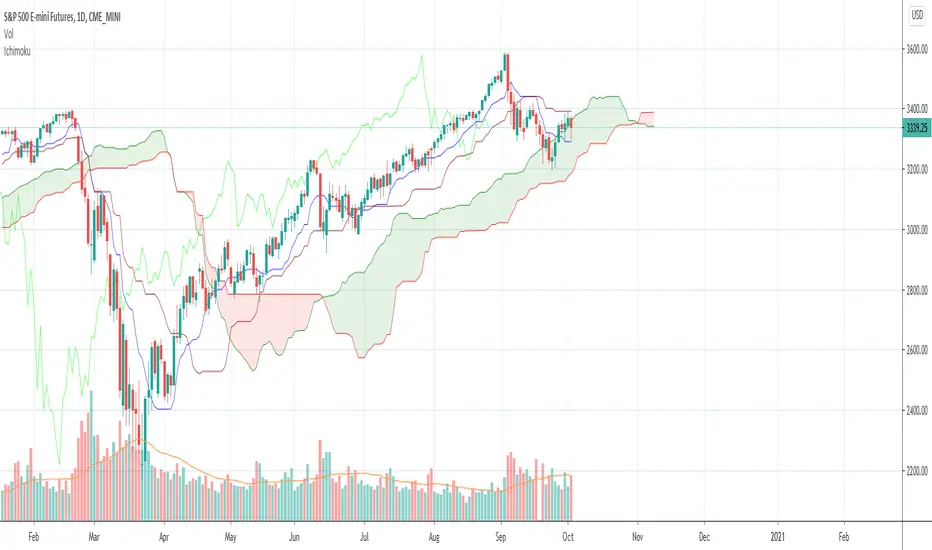
Ichimoku with offset includedBased on the idea that some Donchian Channels in trading books have a lookback or offset of 1 in order to use it as a sort of trailing stop or so that the channels don't adjust. Ichimoku's Tenkan and Kijun lines have a very similar formula to Donchian Channels. In case anyone wants to use those lines as a sort of more fixed trailing stop, offset the Kijun, Tenkan, Span B, and/or treat it like Donchian Channels and such in the Ichimoku system, I included an offset of 1 as the default. To change this indicator to a standard regular looking Ichimoku, just change the offset value to 0.
The formula seems a bit different to what Tradingview has for their own version of Ichimoku but it's the same as many other programmers here. I made the colors as close to the traditional colors seen in books and other places and Tradingview as much as I could think of. Ichimoku has many different variations out there and to add the the confusion can have many different strategies to go with it. If you have any suggestions or tips, please let me know.
Custom EMA + FIBOThis script combines 6 EMAs with 3 Donchian Channel 78.6% and 21.4% intermediary level lines to perform trade analysis. The 6 EMAs (I, II, III , IV, V and VI ) default lengthes come from one of the Fibonacci Phi^3 and Phi^3/2 sub series (17, 34, 72, 144, 305 and 610), but can be changed to any values, particularly to the traditionally used 20, 40, 50, 100, 200 and 300. Up to my knowledge, Fibonacci Phi^3 and Phi^3/2 sub series lengthes were first proposed by Bo Williams.
The 3 Donchian Channels used have default lengthes 72, 305 and 1292, calculated after the first length default value of 72. For each of the 3 Donchian Channels only an upper line, set by default at 78.6%, is plotted in green and its complement, set to 21.4%, is plotted in red. When the closing price is above 3 green lines, we say it is Forbidden to Sell ( PV ), and when the closing price is below 3 red lines, we say it is Forbidden to Buy ( PC ). Those conditions are flagged on the chart. These PV-PC conditions were, up to my knowledge, first proposed by Bo Williams.

Right-Side Master Pro: Adaptive Trend SystemHere is a professional English introduction for your strategy, tailored for a TradingView description, portfolio presentation, or documentation.
I have provided two versions: a Concise Summary (for quick reading) and a Detailed Technical Breakdown (for in-depth explanation).
Option 1: Concise Summary (Best for TradingView Description)
Strategy Name: Right-Side Master Pro: A Systematic Trend-Following System
Description: Built on the timeless principles of trading legends like Jesse Livermore, William O'Neil, and Mark Minervini, the Right-Side Master Pro is a pure trend-following system designed to prioritize confirmation over prediction.
This strategy does not guess bottoms; it waits for specific momentum breakouts (Donchian Channels) aligned with institutional moving averages. Its core edge lies in its "Market Regime Filter," which restricts long positions on altcoins unless Bitcoin is in a confirmed uptrend (above the 200 EMA), effectively shielding capital during bear markets.
Key Features:
The "M" Filter: Automatically filters out bad market environments by tracking BTC trend health.
Hybrid Exit Strategy: Secures wins by closing 50% of the position at a 2R (Reward/Risk) target, while letting the remainder ride the "fat tail" trends with a dynamic trailing stop.
Capital Efficiency: Implements a "Time Stop" to cut stagnant trades that fail to launch within 5 bars, keeping capital active.
Volatility Sizing: Dynamically adjusts position size based on ATR, ensuring consistent risk exposure regardless of market volatility.
Option 2: Detailed Technical Breakdown (Best for Documentation)
Title: The Right-Side Master Pro Edition
Overview The Right-Side Master Pro is a sophisticated algorithmic trading strategy engineered for the cryptocurrency markets. It automates the "Right-Side Trading" philosophy, focusing on entering established trends during high-momentum breakouts while maintaining strict defensive protocols.
Core Logic & Mechanisms
1. Trend & Environment Filtering (The "M" Factor) Following O'Neil's CAN SLIM principle on Market Direction, this strategy incorporates a Bitcoin Regime Filter.
Logic: It monitors Bitcoin’s price relative to its 200-period EMA.
Effect: If BTC is bearish, the strategy disables all long signals for altcoins, preventing "catching falling knives" during systemic corrections.
2. Precision Entry (Momentum)
Trigger: Utilizes a Donchian Channel Breakout (20-period high) to identify genuine strength.
Trend Template: Entries are only valid if the short-term EMA (20) is above the long-term EMA (50), confirming a Stage 2 uptrend structure.
3. Advanced Risk Management
Volatility Sizing: Position size is calculated mathematically using Risk % / (2 * ATR), ensuring that high-volatility coins receive smaller allocations and stable coins receive larger ones.
Time Stop: Adhering to the "Time is Money" principle, the strategy forces an exit if the price fails to move away from the cost basis within 5 candles, eliminating dead money.
4. Hybrid Execution (The "Free Roll")
Take Profit 1 (TP1): Automatically liquidates 50% of the position when the price hits a 2:1 Reward-to-Risk ratio. This banks profit and reduces psychological pressure.
Trailing Stop: The remaining 50% is managed with a loose ATR-based trailing stop, designed to capture outlier trends (100%+ moves) without being shaken out by intraday noise.
Recommended Configurations
Daily Timeframe (1D): For conservative, high-win-rate growth using leverage (2x-3x).
4-Hour Timeframe (4H): For aggressive, high-turnover growth using spot or low leverage (1x).

NICHI (NuwenPham's Ichimoku)NICHI (NuwenPham’s Ichimoku)
NICHI is a dual-engine Ichimoku indicator designed for modern, high-volatility markets.
It preserves a faithful traditional Ichimoku while introducing an advanced, filter-driven Ichimoku framework for research, visualization, and discretionary trading.
The goal of NICHI is not to replace Ichimoku — but to extend it.
Overview
NICHI includes two independent Ichimoku systems that can be enabled separately or together.
1. Standard Ichimoku
A clean, traditional Hosoda Ichimoku using Donchian midpoints:
Tenkan-sen (short period)
Kijun-sen (medium period)
Senkou Span A & B (forward displaced)
Chikou Span (lagging)
Design choice:
The Standard Ichimoku is intentionally plotted in a separate pane to avoid cluttering the price chart.
It serves as a reference / regime baseline, not a visual overlay.
2. Advanced Ichimoku
The Advanced system keeps the Ichimoku structure intact but replaces the Donchian calculations with selectable smoothing filters.
Each Ichimoku component (Tenkan, Kijun, Senkou B, Chikou) can be calculated using modern filters designed to handle volatility, noise, and regime shifts.
Supported filters include:
McGinley Dynamic (MD)
VWMA (exchange or tick-derived volume)
EMA / DEMA / SMA / SMMA / WMA
ALMA / LSMA / Hull MA
COVWMA / FRAMA / KAMA
50th Percentile
Moving Median
This allows Ichimoku to behave as:
A smoother trend system
A volatility-adaptive framework
A momentum-responsive overlay
Enhanced Cloud (Kumo) Modeling
Advanced Kumo logic includes:
Independent forward offsets for Span A and Span B
Bull / bear regime classification aligned with how the cloud is actually drawn
Adaptive cloud coloring
Neutral cloud state when spans disagree
This avoids misleading regime signals when different offsets are used.
Directional Persistence Tracking
NICHI tracks directional streaks for key components:
Tenkan direction
Kijun direction
Span A direction
Span B direction
These persistence counters stabilize coloring, reduce flicker, and improve visual clarity during transitions.
Bar Coloring Modes (Advanced)
Three bar-coloring frameworks are included.
Kumo-Based
Above cloud → bullish
Below cloud → bearish
Inside cloud → neutral
Tenkan / Kijun-Based
Above both → bullish
Below both → bearish
Chikou-Based
Chikou above past price → bullish
Chikou below past price → bearish
Each mode is intentionally distinct and serves a different trading style.
Moving Average Overlays
NICHI includes four optional moving average overlays (MA1–MA4):
Configurable type, length, width, and source
Intended for bias, confluence, or higher-timeframe context
Controlled as code-level constants by design
What Changed Since BETA
This release promotes NICHI from beta to stable with the following key improvements:
Chikou regime logic fixed:
Chikou comparisons now reference historical price only, eliminating any future lookahead behavior.
Kumo bull/bear alignment clarified:
Cloud regime classification now matches how the cloud is visually drawn when Span A and Span B use different forward offsets.
Kijun direction tracking corrected:
Kijun coloring now reflects Kijun movement, not Tenkan movement.
Bar coloring gated:
Bar coloring is applied only when Advanced Ichimoku is enabled, preventing unintended behavior when using Standard mode alone.
General stability and cleanup:
Minor bug fixes, consistency improvements, and documentation clarity.
Notes
Advanced Ichimoku is intended for research and visualization, not as a turnkey strategy.
Standard Ichimoku remains a faithful baseline.
If reporting issues, please include symbol, timeframe, and a screenshot.

Vol Compression PRO
## Volatility Compression PRO (Fully Fixed)
This indicator is an **options-theory-inspired “volatility compression → expansion” detector**, enhanced for **crypto trading on 4H/1D**. It is designed as a **two-stage system**:
1. **Environment / Setup (1D)**: Detects a volatility-compressed regime where a breakout is more likely.
2. **Trigger (current chart TF, recommended 4H)**: Confirms the breakout using price structure + volatility expansion + (optional) volume.
A major feature of this script is that it **avoids TradingView’s 5000-bar historical limitation** by recommending a **Daily HV (1D) computation mode**, which is stable and not constrained by intraday bar counts.
---
## Core Concept
### Stage A — “Setup” (Daily Environment Filter)
On the **daily timeframe**, the script estimates realized volatility (HV) and produces an **Environment Score (0–100)** that reflects how “compressed” volatility is versus its own history.
A **Setup window** becomes active when:
* `Environment Score >= Setup Threshold`
* Optional “persistence” can keep Setup active for N days after triggering (to avoid edge flicker).
It also calculates a **daily directional bias** (Bull/Bear) using one of two methods:
* **Price vs Daily EMA** (default): bias is bullish if daily close > daily EMA, bearish if below.
* **MACD > 0**: bias is bullish if daily MACD line > 0, bearish if < 0.
This stage answers:
**“Are we in a volatility-compressed regime worth watching, and what is the higher-timeframe bias?”**
---
## HV / Compression Scoring Model
The script computes:
* **Short-term HV**: standard deviation of log returns over a short window
* **Long-term HV**: standard deviation of log returns over a long window
* **HV Percentile**: percentile rank of short HV over a historical lookback
* **Compression Ratio (S/L)**: short HV divided by long HV (`<1` implies compression, `>1` implies expansion)
* **Log-Z Deviation**: Z-score of log(HV) vs its historical distribution (more stable than raw HV Z-score)
Then it builds a **0–100 score** using weighted components:
* Low HV percentile (lower = more compressed)
* Compression ratio below 1 (more compression)
* Negative log-Z deviation (HV below typical)
This produces a single number: **“Explosion Potential (Environment Score)”**.
---
## Stage B — Trigger Logic (Current Chart Timeframe, recommended 4H)
A **Long Trigger** fires only when **all** of the following are true:
1. **Setup is active** (from daily environment score)
2. **Daily bias is bullish**
3. **Donchian breakout UP**
* Close breaks above the **previous bar’s** highest high of the last N bars
* Uses ` ` to avoid same-bar repaint-style lookback issues
4. **Volatility expansion confirmation**, via either:
* **Bollinger Band Width rising** (BBW turns up and exceeds its mean), and/or
* **ATR% rising** (ATR as % of price increases)
5. **Optional volume confirmation**:
* Volume > SMA(volume) × multiplier (if enabled)
A **Short Trigger** mirrors the long logic (requires bearish bias + downside Donchian break), and can be toggled on/off.
This stage answers:
**“Did price actually escape the compression box, and is volatility expanding with it?”**
---
## Two HV Calculation Modes (5000-bar limitation fix)
### 1) **Daily HV (Recommended)**
* Computes HV + Score + Setup on the **daily timeframe using `request.security(...,"D",...)`**
* This avoids intraday needing thousands of bars to represent many days
* Much more stable and reliable for regime detection
### 2) **Adaptive to Chart TF**
* Computes HV on the **current chart timeframe**
* Includes a strict conversion of “days → bars” and clamps lengths to **<= 4800 bars** to avoid the 5000-bar ceiling
* Still less robust on small timeframes, but won’t crash the script
---
## Visualization
* Plots the **Environment Score** as the main line (colored by score level)
* Draws reference lines at 70 / 50 / 30
* Highlights the background when **Setup** is active
* Optional trigger markers:
* **“L”** for long trigger (triangle up)
* **“S”** for short trigger (triangle down)
* A top-right info panel shows:
* HV short/long, HV percentile, compression ratio, log-Z deviation
* Environment score, Setup active status, daily bias
* Breakout status, expansion confirmation, volume confirmation
* Current mode (“1D fixed” vs “Adaptive”)
---
## Alerts
Built-in alert conditions:
* Setup active (compression window)
* Long Trigger
* Short Trigger
---
## Intended Use (Practical)
* Use **1D** to judge whether volatility is compressed and define bias
* Use **4H** to wait for a clean breakout plus expansion confirmation
* Avoid forcing entries during compression without a real breakout (“don’t catch falling knives” logic)

Kalman Hull Kijun [BackQuant]Kalman Hull Kijun
A trend baseline that merges three ideas into one clean overlay, Kalman filtering for noise control, Hull-style responsiveness, and a Kijun-like Donchian midline for structure and bias.
Context and lineage
This indicator sits in the same family as two related scripts:
Kalman Price Filter
This is the foundational building block. It introduces the Kalman filter concept, a state-estimation algorithm designed to infer an underlying “true” signal from noisy measurements, originally used in aerospace guidance and later adopted across robotics, economics, and markets.
Kalman Hull Supertrend
This is the original script made, which people loved. So it inspired me to create this one.
Kalman Hull Kijun uses the same core philosophy as the Supertrend variant, but instead of building a Supertrend band system, it produces a single structural baseline that behaves like a Kijun-style reference line.
What this indicator is trying to solve
Most trend baselines sit on a bad trade-off curve:
If you smooth hard, the line reacts late and misses turns.
If you react fast, the line whipsaws and tracks noise.
Kalman Hull Kijun is designed to land closer to the middle:
Cleaner than typical fast moving averages in chop.
More responsive than slow averages in directional phases.
More “structure aware” than pure averages because the baseline is range-derived (Kijun-like) after filtering.
Core idea in plain language
The plotted line is a Kijun-like baseline, but it is not built from raw candles directly.
High level flow:
Start with a chosen price stream (source input).
Reduce measurement noise using Kalman-style state estimation.
Add Hull-style responsiveness so the filtered stream stays usable for trend work.
Build a Kijun-like baseline by taking a Donchian midpoint of that filtered stream over the base period.
So the output is a single baseline that is intended to be:
Less jittery than a simple fast MA.
Less laggy than a slow MA.
More “range anchored” than standard smoothing lines.
How to read it
1) Trend and bias (the primary use)
Price above the baseline, bullish bias.
Price below the baseline, bearish bias.
Clean flips across the baseline are regime changes, especially when followed by a hold or retest.
2) Retests and dynamic structure
Treat the baseline like dynamic S/R rather than a signal generator:
In uptrends, pullbacks that respect the baseline can act as continuation context.
In downtrends, reclaim failures around the baseline can act as continuation context.
Repeated back-and-forth around the line usually means compression or chop, not clean trend.
3) Extension vs compression (using the fill)
The fill is meant to communicate “distance” and “pressure” visually:
Large separation between price and baseline suggests expansion.
Price compressing into the baseline suggests rebalancing and decision points.
Inputs and what they change
Kijun Base Period
Controls the structural memory of the baseline.
Higher values track broader swings and reduce flips.
Lower values track tighter swings and react faster.
Kalman Price Source
Defines what data the filter is estimating.
Close is usually the cleanest default.
HL2 often “feels” smoother as an average price.
High/Low sources can become more reactive and less stable depending on the market.
Measurement Noise
Think of this as the main smoothness knob:
Higher values generally produce a calmer filtered stream.
Lower values generally produce a faster, more reactive stream.
Process Noise
Think of this as adaptability:
Higher values adapt faster to changing conditions but can get twitchy.
Lower values adapt slower but stay stable.
Plotting and UI (what you see on chart)
1) Adaptive line coloring
Baseline turns bullish color when price is above it.
Baseline turns bearish color when price is below it.
This makes the state readable without extra panels.
2) Gradient “energy” fill
Bull fill appears between price and baseline when above.
Bear fill appears between price and baseline when below.
The goal is clarity on separation and control, not decoration.
3) Rim effect
A subtle band around price that only appears on the active side.
Helps highlight directional control without hiding candles.
4) Candle painting (optional)
Candles can be colored to match the current bias.
Useful for scanning many charts quickly.
Disable if you prefer raw candles.
Alerts
Long state alert when price is above the baseline.
Short state alert when price is below the baseline.
Best used as a bias or regime notification, not a standalone entry trigger.
Where it fits in a workflow
This is a context layer, it pairs well with:
Market structure tools, BOS/MSB, OBs, FVGs.
Momentum triggers that need a regime filter.
Mean reversion tools that need “do not fade trends” context.
Limitations
No baseline eliminates chop whipsaws, tuning only manages the trade-off.
Settings should not be copy pasted across assets without checking behavior.
This does not forecast, it estimates and smooths state, then expresses it as a structural baseline.
Disclaimer
Educational and informational only, not financial advice.
Not a complete trading system.
If you use it in any trading workflow, do proper backtesting, forward testing, and risk management before any live execution.

Bollinger Bands Forecast with Signals (Zeiierman)█ Overview
Bollinger Bands Forecast with Signals (Zeiierman) extends classic Bollinger Bands into a forward-looking framework. Instead of only showing where volatility has been, it projects where the basis (midline) and band width are likely to drift next, based on recent trend and volatility behavior.
The projection is built from the measured slopes of the Bollinger basis, the standard deviation (or ATR, depending on the mode), and a volatility “breathing” component. On top of that, the script includes an optional projected price path that can be blended with a deterministic random walk, plus rejection signals to highlight failed band breaks.
█ How It Works
⚪ Bollinger Core
The script first computes standard Bollinger Bands using the selected Source, Length, and Multiplier:
Basis = SMA(Source, Length)
Band width = Multiplier × StDev(Source, Length)
Upper/Lower = Basis ± Width
This remains the “live” (non-forecast) structure on the chart.
⚪ Trend & Volatility Slope Estimation
To project forward, the indicator measures directional drift and volatility drift using linear regression differences:
Basis slope from the Bollinger basis
StDev slope from the Bollinger deviation
ATR slope for ATR-based projection mode
These slopes drive the forecast bands forward, reflecting the market’s recent directional and volatility regime.
⚪ Projection Engine (Forecast Bands)
At the last bar, the indicator draws projected basis, upper, and lower lines out to Forecast Bars. The projected basis can be:
Trend (straight linear projection)
Curved (ease-in/out transition toward projected endpoints)
Smoothed (extra smoothing on projected basis/width)
⚪ Price Path Projection + Optional Random Walk
In addition to projecting the bands, the script can draw a price forecast path made of a small number of zigzag swings.
Each swing targets a point offset from the projected basis by a multiple of the projected half-width (“width units”).
Decay gradually reduces swing size as the forecast deepens.
The Optional Random Walk Blend adds a deterministic drift component to the zigzag path. It’s not true randomness; it’s a stable pseudo-random sequence, so the drawing doesn’t jump around on refresh, while still adding “natural” variation.
⚪ Rejection Signals
Signals are based on failed attempts to break a band:
Bear Signal (Down): price tries to push above the upper band, then falls back inside, while still closing above the basis.
Bull Signal (Up): price tries to push below the lower band, then returns back inside, while still closing below the basis.
█ How to Use
⚪ Forward Support/Resistance Corridors
Treat the projected upper/lower bands as a future volatility envelope, not a guarantee:
The upper projection ≈ is likely a resistance level if the regime persists
The lower projection ≈ is likely a support level if the regime persists
Best used for trade planning, targets, and “where price could travel” under similar conditions.
⚪ Regime Read: Trend + Volatility
The projection shape is informative:
Rising basis + expanding width → trend with increasing volatility (needs wider stops / more caution)
Flat basis + compressing width → contraction regime (often precedes expansion)
⚪ Signals for Mean-Reversion / Failed Breakouts
The rejection markers are useful for fade-style setups:
A Down signal near/after upper-band failure can imply rotation back toward the basis.
An Up signal near/after lower-band failure can imply snap-back toward the basis.
With MA filtering enabled, signals are constrained to align with the broader bias, helping reduce chop-driven noise.
█ Related Publications
Donchian Predictive Channel (Zeiierman)
█ Settings
⚪ Bollinger Band
Controls the live Bollinger Bands on the chart.
Source – Price used for calculations.
Length – Lookback period; higher = smoother, lower = more reactive.
Multiplier – Bandwidth; higher = wider bands, lower = tighter bands.
⚪ Forecast
Controls the forward projection of the Bollinger Bands.
Forecast Bars – How far into the future the bands are projected.
Trend Length – Lookback used to estimate trend and volatility slopes.
Forecast Band Mode – Defines projection behavior (linear, curved, breathing, ATR-based, or smoothed).
⚪ Price Forecast
Controls the projected price path inside the bands.
ZigZag Swings – Number of projected oscillations.
Amplitude – Distance from basis, measured in bandwidth units.
Decay – Shrinks swings further into the forecast.
⚪ Random-Walk
Adds controlled randomness to the price path.
Enable – Toggle random-walk influence.
Blend – Strength of randomness vs. zigzag.
Step Size – Size of random steps (band-width units).
Decay – Reduces randomness as the forecast deepens.
Seed – Changes the (stable) random sequence.
⚪ Signals
Controls rejection/mean-reversion signals.
Show Signals – Enable/disable signal markers.
MA Filter (Type/Length) – Filters signals by trend direction.
-----------------
Disclaimer
The content provided in my scripts, indicators, ideas, algorithms, and systems is for educational and informational purposes only. It does not constitute financial advice, investment recommendations, or a solicitation to buy or sell any financial instruments. I will not accept liability for any loss or damage, including without limitation any loss of profit, which may arise directly or indirectly from the use of or reliance on such information.
All investments involve risk, and the past performance of a security, industry, sector, market, financial product, trading strategy, backtest, or individual's trading does not guarantee future results or returns. Investors are fully responsible for any investment decisions they make. Such decisions should be based solely on an evaluation of their financial circumstances, investment objectives, risk tolerance, and liquidity needs.

NICHI Beta (NuwenPham's Ichimoku)# **NuwenPham’s Ichimoku (NICHI)**
**Version BETA.251123a.3.1.2 – Pine Script v6**
**Author:** NuwenPham
**Forked from:** Donovan Wall
**Contributors:** Claude (Anthropic)
**License:** MPL 2.0
---
# **Overview**
**NICHI (Nuwen’s Ichimoku)** is a next-generation Ichimoku system that merges the classical Hosoda Ichimoku with a modular adaptive-smoothing engine, enhanced Kumo logic, directional trend counters, and multi-mode bar coloring.
The indicator includes **two completely separate Ichimoku engines**:
* **Standard Ichimoku** – Traditional Donchian-based Tenkan, Kijun, Senkou A/B, and Chikou
* **Advanced Ichimoku** – Fully customizable Ichimoku using 15+ moving-average filters and enhanced logic
NICHI is designed for modern markets—especially **futures and volatile instruments** (NG, CL, ES, NQ, crypto).
---
# **Key Features**
## **1. Dual Ichimoku Systems**
* **Standard Mode:**
Classic Donchian Ichimoku with Tenkan, Kijun, Senkou A/B, and Chikou.
Clean, faithful implementation.
* **Advanced Mode:**
Every Ichimoku line uses a **selected smoothing filter** (EMA, KAMA, FRAMA, Hull, McGinley, etc.).
Includes directional persistence tracking, enhanced cloud logic, and adaptive bar coloring.
---
## **2. Advanced Filter Engine (15+ Smooth Types)**
Use any of the following for Tenkan, Kijun, Senkou B, or Chikou:
* EMA
* DEMA
* SMA
* SMMA (RMA)
* WMA
* VWMA
* Hull MA
* ALMA
* LSMA (Linear Regression)
* McGinley Dynamic
* KAMA
* FRAMA
* COVWMA
* Moving Median
* 50th Percentile (Nearest Rank)
This transforms Ichimoku into an **adaptive trend system**.
---
## **3. Enhanced Cloud (Kumo) Modeling**
* Independent forward offsets for Span A & Span B
* Cloud colors adapt based on strength, direction, and filter behavior
* Cloud thickness reflects volatility
* Neutral cloud state available when spans disagree
---
## **4. Directional Persistence Counters**
NICHI tracks the **trend streak** of each main component:
* Tenkan rising/falling
* Kijun rising/falling
* Span A rising/falling
* Span B rising/falling
These counters make cloud and line colors more accurate and stable.
---
## **5. Regime-Based Bar Coloring (3 Modes)**
NICHI includes three built-in trading frameworks:
### **Mode 1: Kumo-Based**
Bar color reflects price relative to the cloud:
* Green = Above Kumo
* Red = Below Kumo
* Orange = Inside Kumo
Ideal for **trend-following** and **market regime detection**.
---
### **Mode 2: Tenkan/Kijun-Based**
Bar color reflects momentum structure:
* Green = Price above both Tenkan & Kijun
* Red = Price below both
Designed for **momentum entries and TK breakouts**.
---
### **Mode 3: Chikou-Based**
Bars reflect historical confirmation:
* Green = Chikou > price (offset period)
* Red = Chikou < price
Excellent for **confirmation-first strategies** where accuracy matters most.
---
## **6. Multi-MA Overlay System**
Up to **four optional moving averages**:
* SMA, EMA, SMMA, WMA, HMA, VWMA
* Independent lengths, widths, colors
* Useful for bias, confluence, trend filters
Default: **SMA 200** enabled.
---
## **7. TK Cross Signals**
Both systems show TK crosses:
* Standard TK Cross (classic)
* Advanced TK Cross (filtered version)
Crosses appear with clear markers for entry/exit logic.
---
# **How to Use NICHI**
## **1. Choose Your Engine**
* **Standard:** Clean, classic Ichimoku
* **Advanced:** Adaptive, filter-driven Ichimoku
* **Both:** Comparative analysis
---
## **2. Select Your Filter Type (Advanced Mode)**
Suggested filters:
| Market | Filter Type | Notes |
| ---------------- | ---------------- | -------------------------- |
| Natural Gas (NG) | KAMA or FRAMA | Handles extreme volatility |
| Crude Oil (CL) | McGinley Dynamic | Smooths spikes |
| ES / NQ | SMMA or WMA | Balanced response |
| Crypto | Hull or ALMA | Handles momentum bursts |
| FX | EMA or SMMA | Classic, stable |
---
## **3. Choose a Bar-Color Strategy**
* **Kumo-Based:** Trend following
* **TK-Based:** Momentum and breakouts
* **Chikou-Based:** Highest confirmation/accuracy
Each strategy is valid and intentionally distinct.
---
## **4. Reading the Cloud**
* **Bullish Cloud:** Span A > Span B
* **Bearish Cloud:** Span A < Span B
* **Neutral Cloud:** Disagreement between spans
* **Thick Cloud:** High volatility / stronger structure
* **Thin Cloud:** Weak trend / potential twist
---
## **5. Entry & Exit Concepts**
### **Entries**
* **Momentum Entry:** TK cross with price above the cloud
* **Reversal Entry:** TK cross before a cloud twist
* **Confirmation Entry:** Chikou breaks cleanly above/below past price
### **Exits**
* Price falling through Kijun
* Re-entering the cloud
* Opposite TK cross
* Cloud flipping against position
---
# **Recommended Trading Approaches**
## **Kumo-Based Trend Strategy**
* Long above cloud, short below
* Avoid signals inside cloud
Best for swing/position trading.
---
## **TK-Based Momentum Strategy**
* Enter on Tenkan/Kijun breakout
* Bar color confirms momentum
* Cloud filter optional but helps
Great for high-velocity markets.
---
## **Chikou-Based Confirmation Strategy**
* Enter only when Chikou confirms structure
* Highest accuracy, fewest trades
* Ideal for volatile markets (NG, CL)
---
# **Closing Notes**
NICHI is a **research-grade Ichimoku framework** designed to handle modern volatility where traditional Ichimoku often fails.
It supports scalpers, swing traders, and system developers alike.
Experiment with:
* Filter types
* Cloud offsets
* Bar-color modes
* MA overlays
to match your strategy and market.

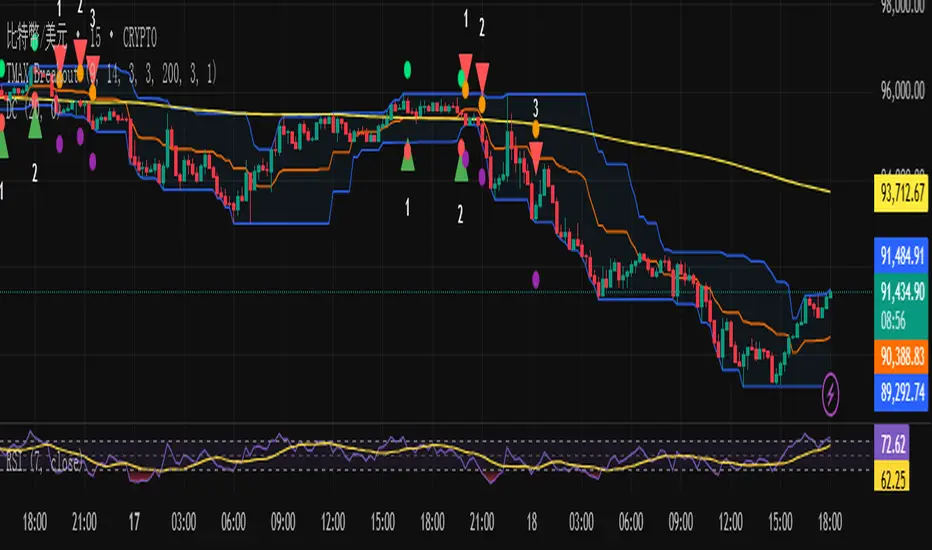
TMAX Breakout – by EricFreemanTMAX Breakout is a trend-following breakout indicator inspired by the classic Turtle Trading System, designed by EricFreeman.
It identifies Donchian Channel breakouts with an MA trend filter to help traders capture strong directional moves while reducing false breakout signals.
Ideal for:
Trend-following traders
Visual breakout confirmation
Manual trading or automated strategy development
More indicators in the TMAX series—RSI Divergence, Bollinger strategies, MA Cross, and more—will be released soon to form a complete professional trading toolkit.
TMAX Breakout 是一款基於海龜交易法(Turtle System)延伸打造的趨勢突破指標,由 EricFreeman 設計。
透過 Donchian Channel 突破判斷結合 MA 趨勢過濾,幫助交易者在關鍵價格突破時進場,並避免弱勢走勢造成假突破。
此指標適合:
喜歡順勢交易的人
想要視覺化突破訊號的交易者
搭配 EA、自動化策略、或手動交易判斷
TMAX 系列將陸續推出更多指標:RSI 背離、布林通道策略、均線交叉等,打造完整專業交易套件。
Solana 4H RSI->MACD — Counter-Trend By TetradTetrad RSI→RSI Cross→MACD (Sequenced) — Counter-Trend (SL-Only)
Category: Market-neutral, counter-trend, sequenced entries
Timeframe default: Works on any TF; designed around 4H On Solana
Markets: Any (spot, perp, futures); parameterize to your asset
What it does
This strategy hunts reversals using a 3-step sequence on RSI and MACD, then optionally restricts entries by market regime and a price gate. It shows stop-loss lines only when hit (clean chart), and paints a Donchian glow for quick read of backdrop conditions.
Entry logic (sequenced)
1. RSI Extreme:
Long path activates when RSI < Oversold (default 27.5).
Short path activates when RSI > Overbought (default 74).
2. RSI Cross confirmation:
Long path: RSI crosses up back above the oversold level.
Short path: RSI crosses down back below the overbought level.
Each step has a max bar lookback so stale signals time out.
3. MACD Cross trigger:
Long: MACD line crosses above Signal.
Short: MACD line crosses below Signal.
→ When step 3 fires and gates are satisfied, a trade is entered.
Optional gates & filters
Regime Filter (Counter-Trend):
Longs allowed in **Range / Short Trend / Short Parabolic** regimes.
Shorts allowed in **Range / Long Trend / Long Parabolic** regimes.
Based on ADX/DI and ATR% intensity.
* Price Gate (Long Ceiling):
Toggle to **disable new longs above a chosen price (default 209.0 For SOL).
Useful for assets like SOL where you want longs only below a cap.
Exits / Risk
* Stop-Loss (% of entry):** default **14%**, toggleable.
* SL visualization:** plots a **thin dashed red line only on the bar it’s hit**.
* (No take-profit or time-based exit in this version—keep it pure to the sequence and regime. Add TP/time exits if desired.)
Visuals
* Donchian Glow (50): background band only (upper/lower lines hidden).
* Regime HUD: compact table (top-right) highlighting the active regime.
* Minimal marks: no entry/exit “arms” clutter; only SL-hit lines render.
Inputs (key)
* Core: RSI Length, Oversold/Overbought, MACD Fast/Slow/Signal.
* Sequence: Max bars from Extreme→RSI Cross and RSI Cross→MACD Cross.
* Regime: ADX Length, Trend/Parabolic thresholds, ATR length & floor.
* Stops: Enable/disable; SL %.
* Price Gate: Enable; Long ceiling price.
Alerts
Sequenced Long (CT): RSIhigh → RSI cross down → MACD bear cross.
## Notes & Tips
Designed for counter-trend fades that become trend rides. The regime filter helps avoid fading true parabolics and aligns entries with safer contexts.
The sequence is stateful (steps must occur in order). If a step times out, the path resets.
Works on lower TFs, but the 4H baseline reduces noise and over-trading.
Consider pairing with volume or structure filters if you want fewer but higher-conviction entries.
Past performance ≠ future results. **Educational use only. Not financial advice.

Supertrend Channel Histogram OscillatorThis histogram is based on the script "Supertrend Channels "
The idea of the indicator is to visually represent the interaction of price with several different supertrend channels of various lengths in an oscillator in order to make it much more clear to the trader how the longer trends are interacting with shorter trends of the price movement of an asset. I got this idea from the "Kurutoga Cloud" and "Kurutoga Histogram" by D7R which is based on the centerlines of 3 Donchian Channels, however after I started using the Supertrend Channel by LuxAlgo I found that it was a more reliable price range channel than a standard Donchian Channel and I made this indicator to accompany it.
This indicator plots a positive value above 0 when the price is above the centerline of the supertrend channel and a negative value below 0 when the price is below the centerline.
The first supertrend's length and multiple can be adjusted in the settings.
The given supertrend input is then doubled and quadrupled in both length and multiplication so that a supertrend histogram with the values of 3, 3 will be accompanied by 2 additional supertrend histograms with the values of 6, 6 and 12, 12.
The larger price trend histograms are clearly visible behind the short term supertrend channel's histogram, giving traders a balanced view of short and long term trends interacting. The less visible columns of the larger trend remain above or below the 0 line behind the more visible short term channel trend, helping to spot pullbacks within a larger trend.
Additionally, when the 3 separate histograms are all positive or all negative but the histogram columns are separating from each other this can indicate a potential trend exhaustion leading to reversal or pullback about to happen.
The overbought and oversold lines at 50 and -50 are representative primarily of the short term trend with above 50 or below -50 indicating that the price is pushing the boundary and potentially beginning a new short term supertrend in the opposite direction. If values do not noticably exceed these levels, then the current short term trend movement can be viewed as a pullback within a larger trend, with continuation potentially to follow.
I have had troubles converting the original code to v6 so this will be published here in v5 of pinescript to be used in conjunction with the original. I was intending to create a companion indicator for this oscillator that represents 3 supertrends with corresponding 2x and 4x calculations based on LuxAlgo's script, but I can't seem to get it to work correctly in v5.
For best visualization of the trends 3 LuxAlgo Supertrend channels with 2x and 4x values should be used in conjunction with each other to fully visualize the histogram.
Used in conjunction with other indicators this can be a very effective strategy to capture larger trend moves and pullbacks within trends, as well as warn of potential price trend exhaustion.
BTC 1D — Trend START/END Signals (clean, no repaint)
This strategy is designed primarily for BTC on the daily (1D) timeframe in TradingView.
BUY (start of uptrend)
Fast EMA is above Slow EMA.
Price breaks above the previous Donchian high.
Optional filters (if enabled): volume surge and strong momentum/RSI.
Only one BUY per uptrend—no additional buys until a SELL occurs.
SELL (end of uptrend)
Price falls below the previous Donchian low, or
Price drops below the Slow EMA, or
Momentum flips bearish (DI− > DI+ or RSI ≤ threshold).
One SELL marks the end of the uptrend.

Kumo no Nami Trend Strength Identifier T2[T69]🧠 Overview
Kumo no Nami is a custom trend strength indicator that combines Ichimoku cloud dynamics (Kumo) with wave momentum (Nami) to identify trend direction, reversals, squeezes, and breakouts using Z-Score analysis. It adapts to different modes (Ichimoku, MA, EMA) for a flexible interpretation of price structure tension vs. movement strength.
🔍 Core Logic
Kumo Width (Cloud Pressure): Measures the normalized spread (Z-Score) between two dynamic price levels (e.g., Senkou A-B or Base-Tenkan).
Nami Strength (Wave Energy): Measures how far current price dislocates from a recent range using Z-Score of the difference between close and Donchian/MA.
Z-Score Normalization: Ensures both metrics are statistically comparable, regardless of volatility regime.
Squeeze Detection: Identifies compression before potential volatility expansion.
Breakout/False Break: Detects whether movement is legitimate or noise.
Final Top/Bottom: Highlights a strong burst post-squeeze, often signaling exhaustion or trend climax.
⚙️ Features
🌀 Multiple Kumo Modes:
Kijun-Tenkan
Senkou A - B
SMA Fast - Slow
EMA Fast - Slow
🟨 Z-Score Based Squeeze Monitoring
🟥 Final Burst Alerts
🟩 Trend Continuation or Fake-out Detection
🎨 Dynamic Background Coloring for visual signal clarity
🔧 Configuration
📊 Inputs
Kumo Mode (kt, sab, sfs, efs) – Choose method to compute Kumo (Cloud) width.
Kumo Lookback – Lookback period for cloud Z-Score analysis.
Nami Lookback – Lookback period for wave dislocation measurement.
Squeeze Threshold – How low Z-Kumo must fall to signal potential squeeze.
Burst Thresholds:
Burst Kumo → Z-Kumo must rise above this to be considered bursting.
Burst Nami → Nami Strength threshold for final trend climax.
Ichimoku Config – Tenkan, Kijun, Senkou B, and displacement.
MA Config – For Fast/Slow variants, SMA/EMA lengths.
🧪 How It Works
Compute the Kumo Width depending on selected mode.
E.g., |Tenkan - Kijun| or |Senkou A - Senkou B|
Normalize this width with its Z-Score to get Z-Kumo Width.
Compute Nami Strength:
Z-Score of how far close deviates from a Donchian channel or moving average.
Evaluate signal logic based on the two:
📈 Behavior & Signals
Trend Range (Sideways Consolidation)
=>Z-Kumo < 0 and |Nami Strength| > 2
False Break (No meaningful price movement)
=>Z-Kumo < 1 and |Nami Strength| < 1
Squeeze Watch (Potential breakout loading)
=>Z-Kumo < Squeeze Threshold
Final Burst / Climax
=>Z-Kumo > 2.5 and |Nami Strength| > 3
Bullish Breakout
=>Z-Kumo > 1 and Nami Strength > 2 and not false break
Bearish Breakout
=>Z-Kumo > 1 and Nami Strength < -2 and not false break
Reversal Detection
Crossovers of Nami Strength across 0 (bull/bear) while not in squeeze
🧠 Advanced Concepts Used
Z-Score:
=>(value - mean) / standard deviation for detecting statistically significant moves.
Squeeze Principle:
=>Low volatility → potential buildup → expansion.
Price Dislocation (Wave Strength):
=>Measures how far current price is from its mean range.
=>Cloud Tension (Kumo Z-Score):
=>Reflects pressure or neutrality in the price structure.
Trend Confirmation:
=>Only if both metrics agree and no false break conditions are met.

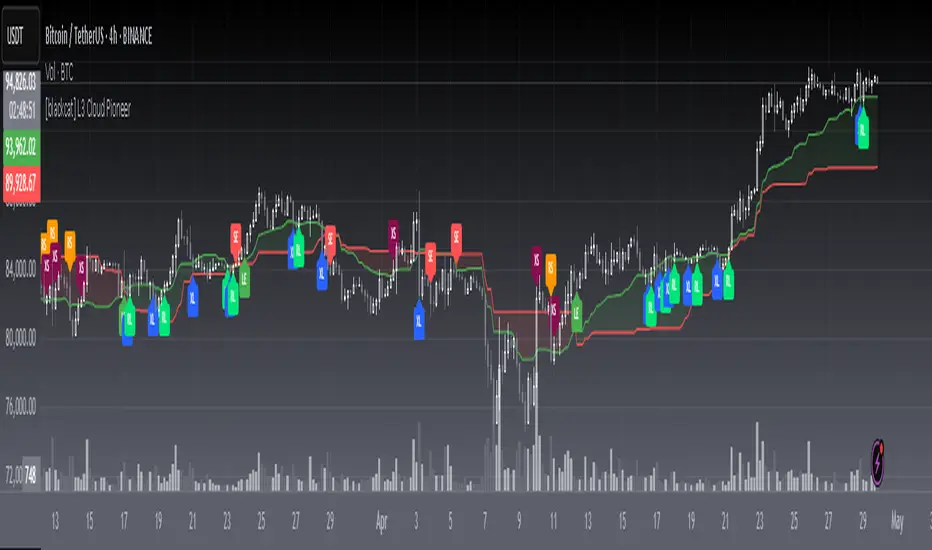
[blackcat] L3 Cloud PioneerOVERVIEW
The L3 Cloud Pioneer indicator combines elements of the Ichimoku Kinko Hyo system with Donchian Channels to provide a robust trend-following tool. This enhanced version includes detailed trade signal labels and alerts, helping traders identify potential entry and exit points more clearly. By plotting dynamic cloud areas and providing visual cues, this indicator aids in making informed trading decisions 📊📉↗️.
FEATURES
Calculates key Ichimoku components using custom Donchian Channel logic:
Conversion Line (based on highest/highest values over specified periods).
Base Line.
Leading Spans.
Lagging Span 2.
Plots a dynamic cloud area between Leading Span 1 and Leading Span 2, colored based on trend direction 🎨.
Identifies trend changes and provides clear entry/exit signals:
LE: Long Entry (when trend turns bullish).
SE: Short Entry (when trend turns bearish).
XL: Exit Long (price crosses below Leading Span 1 during an uptrend).
RL: Re-enter Long (price crosses above Leading Span 1 during an uptrend).
XS: Exit Short (price crosses above Leading Span 1 during a downtrend).
RS: Re-enter Short (price crosses below Leading Span 1 during a downtrend).
Displays corresponding labels on the chart for easy visualization, complete with tooltips for additional information 🏷️.
Generates alerts for each signal event to keep users informed about potential trades 🔔.
Supports customizable input parameters for conversion line, base line, and lagging span periods ⚙️.
HOW TO USE
Add the indicator to your TradingView chart by selecting it from the indicators list.
Adjust the input parameters (Conversion Line Periods, Base Line Periods, Lagging Span 2 Periods) to fit your preferences.
Observe the plotted cloud and labels for trend direction and potential trade opportunities.
Set up alerts based on the generated signals to receive notifications when conditions are met 📲.
Combine this indicator with other tools for confirmation before making trading decisions.
DETAILED SIGNAL LOGIC
Trend Determination:
The script determines the trend direction by comparing leading_line1 and leading_line2.
If leading_line1 is above leading_line2, the trend is considered bullish (isBullish). Otherwise, it's bearish (isBearish).
Signal Conditions:
Long Entry (LE): Triggered when the trend turns bullish from bearish.
Short Entry (SE): Triggered when the trend turns bearish from bullish.
Exit Long (XL): Triggered when the price crosses below leading_line1 during an uptrend.
Re-enter Long (RL): Triggered when the price crosses above leading_line1 during an uptrend.
Exit Short (XS): Triggered when the price crosses above leading_line1 during a downtrend.
Re-enter Short (RS): Triggered when the price crosses below leading_line1 during a downtrend.
Label Styling:
Labels are color-coded for quick identification:
Green for long entries and re-entries.
Red for short entries and exits.
Blue for exiting long positions.
Orange for re-entering short positions.
Tooltips provide additional context for each label.
Alert Configuration:
Alerts are generated for each signal condition, ensuring traders are notified promptly.
Users can set up these alerts within TradingView by creating new alerts and selecting the appropriate conditions.
LIMITATIONS
The indicator may lag behind price action due to its use of moving averages and channel calculations 🕒.
False signals can occur in choppy or sideways markets 🌪️.
Users should always confirm signals with other forms of analysis.
NOTES
Ensure that you have sufficient historical data available for accurate calculations.
Test the indicator thoroughly on demo accounts before applying it to live trading 🔍.
Customize the appearance and parameters as needed to fit your trading strategy.
For better risk management, consider integrating stop-loss and take-profit levels into your trading plan.
To optimize performance, manage old labels by deleting them after a certain period to avoid clutter on the chart.
Akshay - TheOne, TheMostWanted, TheUnbeatable, TheEnd➤ All-in-One Solution (❌ No repaint):
This Technical Chart contains, MA24 Condition, Supertrend Indicator, HalfTrend Signal, Ichimoku Cloud Status, Parabolic SAR (P_SAR), First 5-Minute Candle Analysis (ORB5min), Volume-Weighted Moving Average (VWMA), Price-Volume Trend (PVT), Oscillator Composite, RSI Condition, ADX & Trend Strength.
Technicals don't lie.
🚀 Overview and Key Features
Comprehensive Multi-Indicator Approach:
The script is built to be an all-in-one technical indicator on TradingView. It integrates several well-known indicators and overlays—including Supertrend, HalfTrend, Ichimoku Cloud, various moving averages (EMA, SMA, VWMA), oscillators (Klinger, Price Oscillator, Awesome Oscillator, Chaikin Oscillator, Ultimate Oscillator, SMI Ergodic Oscillator, Chande Momentum Oscillator, Detrended Price Oscillator, Money Flow Index), ADX, and Donchian Channels—to create a composite picture of market sentiment.
Signal Generation and Alerts:
It not only calculates these indicators but also aggregates their output into “Master Candle” signals. Vertical lines are drawn on the chart with corresponding alerts to indicate potential buy or sell opportunities based on robust, combined conditions.
Visual Layering:
Through the use of colored histograms, custom candle plots, trend lines, and background color changes, the script offers a multi-layered visual representation of data, providing clarity about both short-term signals and overall market trends.
⚙️ How It Works and Functionality
MA24 Condition:
Uses the 24-period moving average as a proxy; if the price is above it, the bar is colored green, and red if below, with neutrality when conditions aren’t met.
Supertrend Indicator:
Evaluates price relative to the Supertrend level (calculated via ATR), coloring green when price is above it and red when below.
HalfTrend Signal:
Determines trend shifts by comparing the current close to a calculated trend level; green indicates an upward trend, while red suggests a downtrend.
Ichimoku Cloud Status:
Analyzes the relationship between the Conversion and Base lines; a bullish (green) signal is given when price is above both or the Conversion line is higher than the Base line.
Parabolic SAR (P_SAR):
Colors the signal based on whether the current price is above (green) or below (red) the Parabolic SAR marker, indicating stop and reverse conditions.
First 5-Minute Candle Analysis (ORB5min):
Uses key levels from the first 5-minute candle; if price exceeds the candle’s low, VWAP, and MA, it’s bullish (green), otherwise bearish (red).
Volume-Weighted Moving Average (VWMA):
Compares the current price to volume-weighted averages; a price above these levels is shown in green, below in red.
Price-Volume Trend (PVT):
Determines bullish or bearish momentum by comparing PVT to its VWAP—green when above and red when below.
Oscillator Composite:
Aggregates signals from multiple oscillators; a majority of positive results turn it green, while negative dominance results in red.
RSI Condition:
Uses a simple RSI threshold of 50, with values above signifying bullish (green) momentum and below marking bearish (red) conditions.
ADX & Trend Strength:
Reflects overall trend strength through ADX and directional movements; a combination favoring bullish conditions colors it green, with red signaling bearish pressure.
Master Candle Overall Signal:
Combines multiple indicator outputs into one “Master” signal—green for a consensus bullish trend and red for a bearish outlook.
Scalp Signal Variation:
Focused on short-term price changes, this signal adjusts quickly; green indicates improving short-term conditions, while red signals a downturn.
📊 Visualizations and 🎨 User Experience (❌ no repaint)
Dynamic Histograms & Bar Plots:
Each indicator is represented as a colored bar (with added vertical offsets) to facilitate easy comparison of their respective bullish or bearish contributions.
Clear Color-Coding & Labels:
Green (e.g., GreenFluorescent) indicates bullish sentiment.
Red (e.g., RedFluorescent) indicates bearish sentiment.
Custom labels and descriptive text accompany each bar for clarity.
Interactive Charting:
The overall background color adapts based on the “Master Candle” condition, offering an instant read on market sentiment.
The current candlestick is overlaid with color cues to reinforce the indicator’s signal, enhancing the trading experience.
Real-Time Alerts:
Vertical lines appear on signal events (buy/sell triggers), complemented by alerts that help traders stay on top of actionable market moves.
Sharp lines:
The Sharp lines are plotted based upon the EMA5 cross over with the same market trend, marks this as good time to reentry.
🔧 Settings and Customization
Flexible Timeframe Input:
Users can select their preferred timeframe for analysis, making the indicator adaptable to intraday or longer-term trading styles.
Customizable Indicator Parameters:
➤ Supertrend: Adjust ATR length and multiplier factors.
➤ HalfTrend: Tweak amplitude and channel deviation settings.
➤ Ichimoku Cloud & Oscillators: Fine-tune the conversion/base lines and oscillator lengths to match individual trading strategies.
Visual Customization:
The script’s color schemes and plotting styles can be altered as needed, giving users the freedom to tailor the interface to their taste or existing chart setups.
🌟 Uniqueness of the Concept
Integrated Multi-Indicator Synergy:
Combines a diverse range of trend, momentum, and volume-based indicators into a single cohesive system for a holistic market view.
Master Candle Aggregation:
Consolidates numerous individual signals into a "Master Candle" that filters out noise and provides a clear, consensus-based trading signal.
Layered Visual Feedback:
Uses color-coded histograms, adaptive background cues, and dynamic overlays to deliver a visually intuitive guide to market sentiment at a glance.
Customization and Flexibility:
Offers adjustable parameters for each indicator, allowing users to tailor the system to fit diverse trading styles and market conditions.
✅ Conclusion:
Robust Trading Tool & Non-Repainting Reliability:
This versatile technical analysis tool computes an extensive range of indicators, aggregates them into a stable, non-repainting “Master Candle” signal, and maintains consistent, verifiable outputs on historical data.
Holistic Market Insight & Consistent Signal Generation:
By combining trend detection, momentum oscillators, and volume analysis, the indicator delivers a comprehensive snapshot of market conditions and generates dependable signals across varying timeframes.
User-Centric Design with Rich Visual Feedback:
Customizable settings, clear color-coded outputs, adaptive backgrounds, and real-time alerts work together to provide actionable, transparent feedback—enhancing the overall trading experience.
A Unique All-in-One Solution:
The integrated approach not only simplifies complex market dynamics into an easy-to-read visual guide but also empowers systematic traders with a powerful, adaptable asset for accurate decision-making.
❤️ Credits:
Pine Script™ User Manual
Supertrend
Ichimoku Cloud
Parabolic SAR
Price Volume Trend (PVT)
Average Directional Index (ADX)
Volume Oscillator
HalfTrend
Donchian Trend

Stock ETF Tracker 2.0The Stock Sector ETF tracker with Indicators is a versatile tool designed to track the performance of sector-specific ETFs relative to the current asset. It automatically identifies the sector of the underlying symbol and displays the corresponding ETF’s price action alongside key technical indicators. This helps traders analyze sector trends and correlations in real time.
---
Key Features
Automatic Sector Detection:
Fetches the sector of the current asset (e.g., "Technology" for AAPL).
Maps the sector to a user-defined ETF (default: SPDR sector ETFs) .
Technical Indicators:
Simple Moving Average (SMA): Tracks the ETF’s trend.
Bollinger Bands: Highlights volatility and potential reversals.
Donchian High (52-Week High): Identifies long-term resistance levels.
SPY Regime Filter: Red background color if SP500 is below 200 day SMA.
Customizable Inputs:
Adjust indicator parameters (length, visibility).
Override default ETFs for specific sectors.
Informative Table:
Displays the current sector and ETF symbol in the bottom-right corner.
---
Input Settings
SMA Settings
SMA Length: Period for calculating the Simple Moving Average (default: 200).
Show SMA: Toggle visibility of the SMA line.
Bollinger Bands Settings
BB Length: Period for Bollinger Bands calculation (default: 20).
BB Multiplier: Standard deviation multiplier (default: 2.0).
Show Bollinger Bands: Toggle visibility of the bands.
Donchian High (52-Week High)
Daily High Length: Days used to calculate the high (default: 252, approx. 1 year).
Show High: Toggle visibility of the 52-week high line.
Sector Selections
Customize ETFs for each sector (e.g., replace XLU with another utilities ETF).
---
Example Use Cases
Trend Analysis: Compare a stock’s price action to its sector ETF’s SMA for trend confirmation.
Volatility Signals: Use Bollinger Bands to spot ETF price squeezes or breakouts.
Sector Strength: Monitor if the ETF is approaching its 52-week high to gauge sector momentum.
Enjoy tracking sector trends with ease! 🚀
