EMA 20/100/200 alwaysThis script will always show the EMA 20/100/200 daily values across any time frame chart (e.g. showing daily 20 EMA while viewing the 5 minute chart)
Wyszukaj w skryptach "daily"

msoro daily DCATool to estimate PnL of your investment if you put in a fixed $ amount daily into btc for past year. It takes input as 365 days which can be changed as per need.

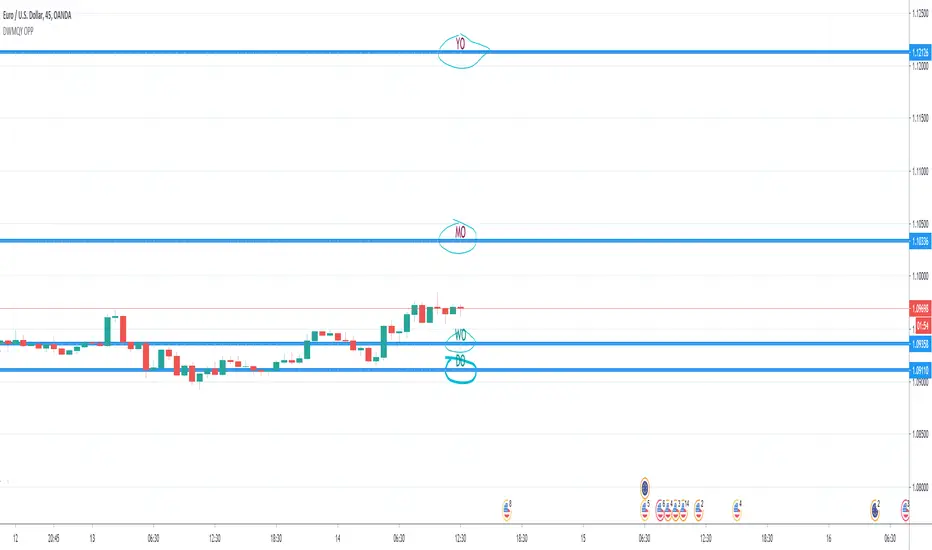
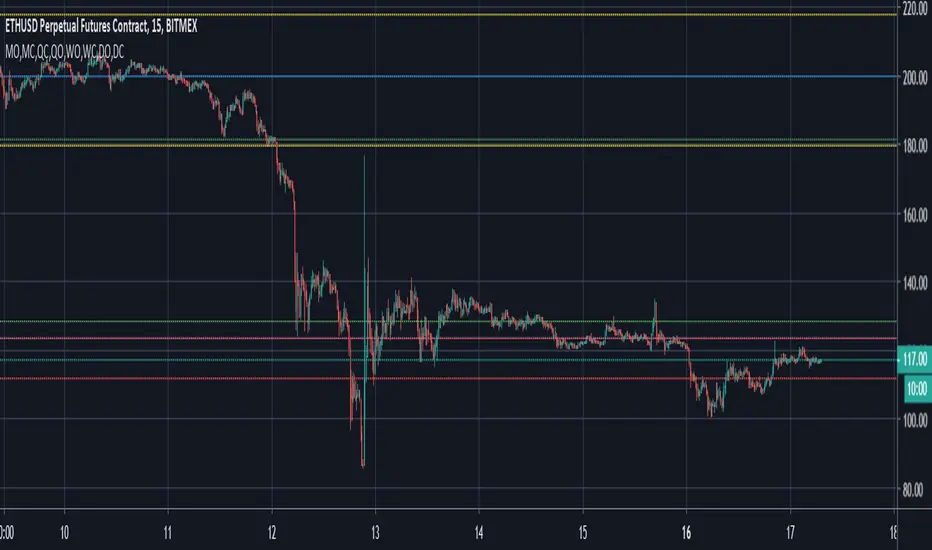
Day & Week & Month & Quarter & Year Open Price PointsPresent to your attention, basic “Day & Week & Month & Quarter & Year Open Price Points Indicator” !
You can determine support & resistance using Yearly, Quarterly, Monthly and Weekly open price points on a chart with any timeframe.
It is not a widely used technique, but according to different academic studies, levels are reliable. Google it! You can enhance your trading by adding that technique in your tool list.
At the current stage, Indicator shows Open Price Points.
Opening price points are extended into the future from the opening candle of each year, quarter, month and week and day.
By nature of that points, every level may be used as a support and as a resistance level at a similar time.
Initial setup:
1) Open the indicator Inputs settings, enable/disable additional Price Points.
2) Open the indicator Style settings, click on a style of each line and click on a “Price Line.”
How to use that?
With a lot of available strategies, there are two leading: Level convergence and Trend line convergence.
1) Level convergence involves locating two or more opening points that merge. This confluence can lead to greater accuracy and profitability.
2) Trend line convergence - The intersection of a trend line at a weekly, monthly, quarterly or even yearly opening level can produce fast and profitable reactions.
Try that!
As a stand-alone strategy, you can utilize that:
Price action under the WO (DO, MO, QO, YO) – Bearish
Price action above the WO (DO, MO, QO, YO) – Bullish
TIP: opening level not always good as a stand-alone tool!
Indicator Settings:
Show Daily Open (disabled by default)
Show Weekly Open (ON by default)
Show Monthly Open (ON by default)
Show Quarter Open (disabled by default)
Show Yearly Open (disabled by default)
Indicator Styling:
By default, each line is shown in the form of circles, line-width 1, silver colour.
Labels can be only in one of two states: Maroon (if open price less than ((open + high + low + close)/4) or Teal (if open price high than ((open + high + low + close)/4).
Alerts:
With the Indicator you can add a few different alerts:
DO Alert
WO Alert
MO Alert
QO Alert
YO Alert
Play with it:
Add a new alert with following condition: your SYMBOL crossing DWMQY OPP Weekly Open.
Options: Once per Bar.
Future of the Indicator:
The Indicator is a necessary part of more prominent Indicator which will include 8 modules in total:
2~ Arabian Wise Tunnels Module
3~ RH Waves Module (something like Vegas Waves)
4~ Trend Channels Module
5~ Opening Range Zoning Module
6~ Breakout Module
7~ BS Hemisphere Module
8~ Price Action Module
DISCLAIMER! RISK WARNING!
PAST PERFORMANCE IS NOT NECESSARILY INDICATIVE OF FUTURE RESULTS. TRADERS SHOULD NOT BASE THEIR DECISION ON INVESTING IN ANY TRADING PROGRAM SOLELY ON THE PAST PERFORMANCE PRESENTED, ADDITIONALLY, IN MAKING AN INVESTMENT DECISION, TRADERS MUST ALSO RELY ON THEIR OWN EXAMINATION OF THE PERSON OR ENTITY MAKING THE TRADING DECISIONS.
//Written by iambitboy request.
MTF Ichimoku CloudIchimoku Cloud , Multiple Time Frames, based on the script : MTF Selection Framework functions (PineCoders)
Possible display:
- four differents Ichimoku
- Tenkan, Kijun, Chikou and Kumo (monochrome or not)
- labels : offset from line, color if you change style and with/without abbreviation
Time Frames :
- 1m
- 3m
- 5m
- 15m
- 30m
- 45m
- 1h
- 2h
- 3h
- 4h
- Daily
- Weekly
- Monthly

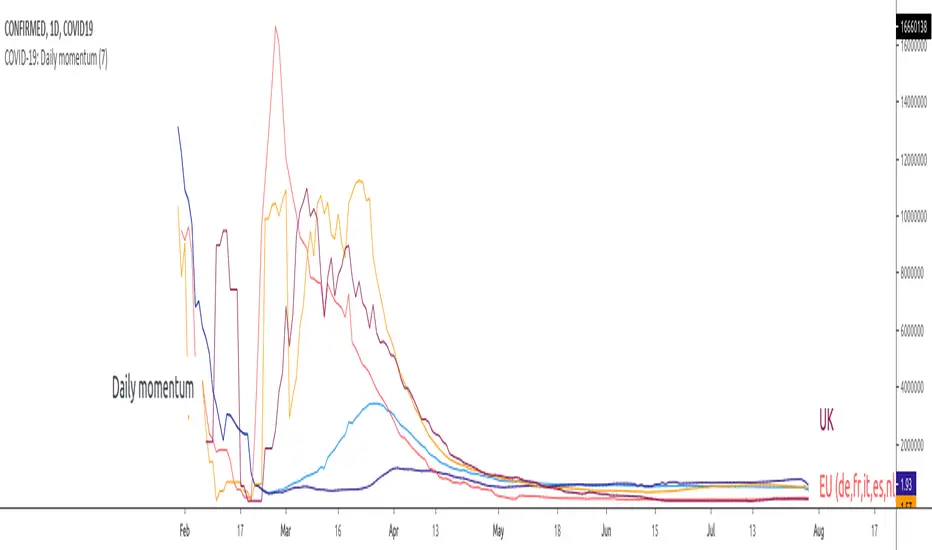
COVID-19: Daily momentumThis indicator shows 14-days moving average of daily rate of change (momentum, acceleration), in other words:
- up trends means that virus accelerates at the rate displayed on the right scale
- consolidation/horizontal movement - virus spreads at constant rate
- down trend - virus looses momentum IMPORTANT: the virus STILL accelerates but at a lower rate
By default the graphic displays World vs. EU vs. US vs. Asia while individual countries are available in Settings.
- EU includes the following countries (DE, FR, IT, ES, CH), all with more than 10k confirmed cases and more than 1k new daily infections.
- Asia includes CH and KR
To use the indicator it is important to disconnect main chart from the right scale, on main chart click on More (the 3 dots) -> Pin to scale -> Select "No Scale".
Ichimoku Timeframe - [Silver-Wong]"Ichi Time" displays an Ichimoku indicator from another timeframe.
IE: Displays Ichimoku Daily while you are on the 4H chart.
Available timeframes:
- 1H
- 4H
- 12H
- Daily
- Weekly

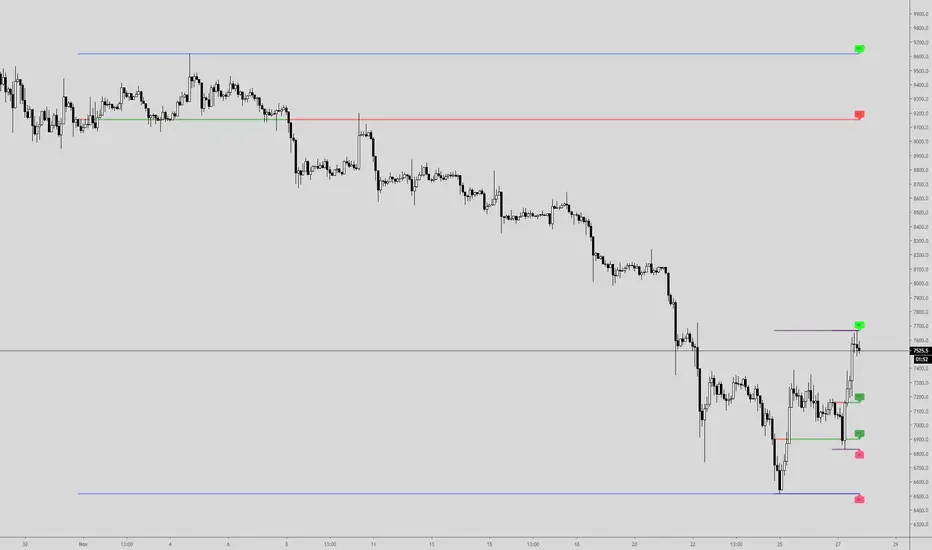
NKP Daily ZonesNKP Daily Zones is an indicator it will show where the buyers and sellers sitting to take the positions. it is created based on the last 10 days price movements. By using this we can detect reversals, continuations and trend strength, read on. ( we can apply this in lower timeframes like , 5min, 15min, 30min, 1hr)
NKP Daily zones has 2 main components:
Buyers zone dotted lines (Green)
Sellers zone dotted lines (Red)
How does it work?
The price moves above the seller zone area it means up trend continuation.
The price moves below the buyer zone area it means down trend continuation.
The price touches buyer zone area and the price moving up it means down trend completed and up trend started.
The price touches seller zone area and the price moving down it means up trend completed and down trend started.
What are the signals?
it wont generate any signals. just it will plot the buyers and seller zones.
Can we set the Alert on this?
Yes, we can set the alert based on the buyer/seller zone broken.
two custom alerts - NKP Buyer zone , NKP Seller zone
IMPORTANT: this script does not generate any signals. Perfectly catches long runs in trends at all underlings (stocks, indexes ) at 5 min, 15min, 30min, 1hr time frame. Lower/High period gives more incorrect signals. Don't use this in daily time frame.
Try it! Good luck and good trading!
For access, please PM us or visit the link below in our Signature.

Previous Quarterly, Monthly, Weekly, Daily Candle Open, Close.This script marks the Previous Quarterly, Monthly, Weekly, and Daily Candle Open and Closes. Colors can be changed as needed.
EMA Cross - Swing Trading on the Daily (by Leb Crypto)This indicator is best used on the Daily Chart.
It's simple yet powerful.
All it does is indicate where the 8 EMA crosses over or under the 21 EMA, indicating a potential LONG or SHORT position opportunity.
You can back test this on many charts, and find that it has a pretty decent success rate.
Obviously, it is NOT to be used on its own. It's best combined with other technical analysis skills.
Nevertheless, it is helpful in Swing Trading on the Daily chart.
Long/Buy when the green circle appears.
Short/Sell when the red circle appears.
Enjoy it.
Cheers,
Leb Crypto

Deribit Daily OptionsOverlays Deribit daily option expiration time and strike prices on chart. Also overlays historical volatility rounded to nearest whole number for quick reference.

MultiTimeFrame Fractals D W M [xdecow]This indicator shows fractals in different timeframes. With the possibility of coloring the bars with any combination of current, daily, weekly and monthly timeframes.
The return points are calculated as follows:
high > last 3 highs and close above highest low
low < last 3 lows and closes below lowest high
The direction of higher timeframes fractals tend to be more durable and reliable. This indicator helps to find the fractal alignment of different timeframes, so that you can look for trade opportunities in the same direction as the higher timeframes and improve your chances.

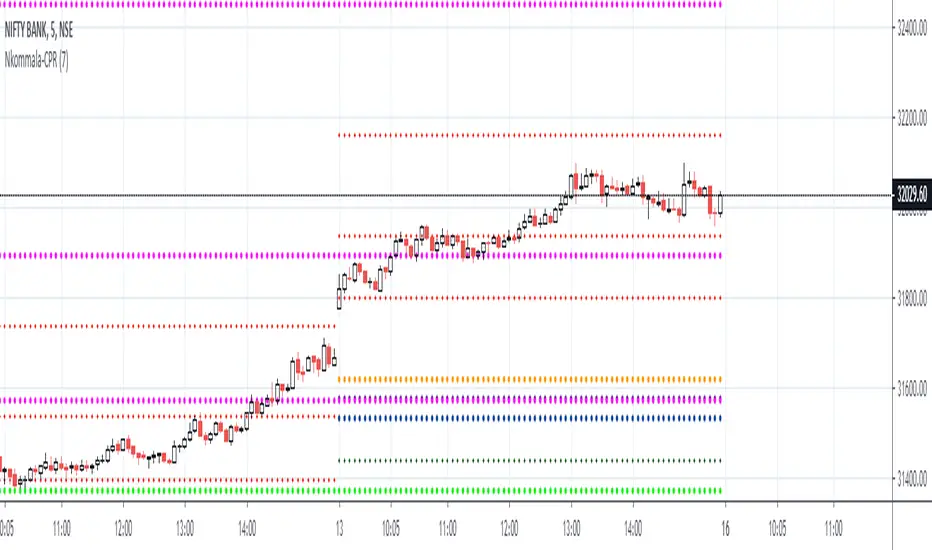
Pivots (CPR) - Daily, Weekly & Monthly (only for Indraday) Hi all Dear users,
Here, I have shared my CPR script on Daily, Weekly & Monthly basis. which will only works on intraday time frames. Best time frames recommended are 3,5 &15.
This will be very useful for intraday trades. And also it has more customizing options.
The features are:-
================
- Have an option to use only Daily pivots.
- Have an option to check tomorrow pivot ( After day closing).
- You can customize each and every style and colors.
- It also contains Previous day High, Previous Week High & Previous Month High.
- You can Show or Hide daily weekly Monthly and highs too.
Please share this AMAZING INDICATORS others.

Ind - Envelope Daily (Public)This is an envelope based on the daily timeframe , that can be imposed over any timeframe.
You can adjust EMA length and the multiplier to your preferance.
You can set an Alert based on the Alert condition of price exceeding the outer envelope .

MB DAILY CPR, HIGH, LOW, RESISTANCE AND SUPPORTThis script is based on Franklin O. Ochoa's "Secrets of a Pivot Boss". This script shows daily CPR with R1 to R4 and S1 to S4, previous day high, low, This script mostly works for swing, scalping and intraday.
Recommended to back test before use.
By using this script I will not accept liability for any loss or damage, including without limitation any loss of profit.

High, Low and MidpointThis indicator plots the daily high and low from the previous day. (BLACK)
It then calculates the midpoint of the high and low and plots this. (RED)
This indicator can be used to identify daily ranges and to identify possible support and resistance levels.


camarilla - Daily,Weekly,Monthly by Ganeshcamarilla - Daily,Weekly,Monthly levels in one chart for support and resitance

Volatility Breakout Daily [Alert]Valid on Bitcoin Daily Chart .
yellow line : open
green line : upward Volatility Breakthrough
red line : downward Volatility Breakthrough
Long strategy: Buy on the green line and liquidate the next day. (recommendation)
Short strategy: Sell on the red line and clear the market the next day. (Not recommended)
You can change the volatility coefficient K.
Only open to invited trader.
Test it before auto trading.
If isOpen is true then VK = (previous high - previous low) * k + open
if isOpen is false then VK = (previous high - previous low) * k + previous close
Alert setting
- Long
Condition : BTCUSD / Crossing Up / VKD (A) / VK (Long)
Options : Once Per Bar
- Exit long
Condition : VKD (A) / longExitCondition
Options : Once Per Bar Close
- Short
Condition : BTCUSD / Crossing Down / VKD (A) / VK (Short)
Options : Once Per Bar
- Exit short
Condition : VKD (A) / shortExitCondition
Options : Once Per Bar Close
* * *
비트코인 일간 차트에서 유효한 지표입니다.
시가(노란선)를 기준으로 위와 아래에 상방 변동성 돌파선(녹색선)과 하방 변동성 돌파선(빨간선)이 표시됩니다.
매수 전략 : 녹색선에서 매수하여 다음날 시가 청산합니다. (추천)
매도 전략 : 빨간선에서 매도하여 다음날 시가 청산합니다. (추천안함)
변동성 계수 K를 바꿀 수 있습니다.
초대된 분들께만 공개합니다.
자동 매매시 반드시 테스트해보고 사용하세요.
isOpen 이 참이면 VK = (전일 고가 - 전일 저가) * K + 당일 시가
isOpen 이 거짓이면 VK = (전일 고가 - 전일 저가) * K + 전일 종가
얼러트 설정 방법
- 매수 진입
조건 : BTCUSD / 상향돌파 / VKD (A) / VK (Long)
옵션 : 봉마다 한번
-매수 청산
조건 : VKD (A) / longExitCondition
옵션 : 봉 닫힐때 한번
- 매도 진입
조건 : BTCUSD / 하향돌파 / VKD (A) / VK (Short)
옵션 : 봉마다 한번
-매도 청산
조건 : VKD (A) / shortExitCondition
옵션 : 봉 닫힐때 한번

che_trader - Monthly, weekly and daily levelsI share with you my version of the most important high time frame levels in a version pleasant to the eye and with several options.
This indicator contains:
Current levels:
The possibility to change from green to red depending on whether the price is above or below the level.
Available for:
current daily open
current weekly open
current monthly open
The indicator shows the open, low and high for each default level.
It is also possible through the menu to add the levels for the last days, weeks or months, disabled by default.
This script is free to use!
Enjoy!
Buy & Sell - XMRBTC 1DPrivate Indicator
Indicator optimised for trading XMRBTC in 1D (daily) timeframe.
Buy and Sell signals as automated alerts.
Indicator optimised for trading XMRBTC in 1D timeframe.
The goal was to beat Buy & Hold on the whole period of the backtest. Results below!
The strategy is using a combo of Donchian Channels and Heikin Ashi, this is why there is a colored channel which can also be used to highlight the trend.
To get this indicator, use the links below, thanks !

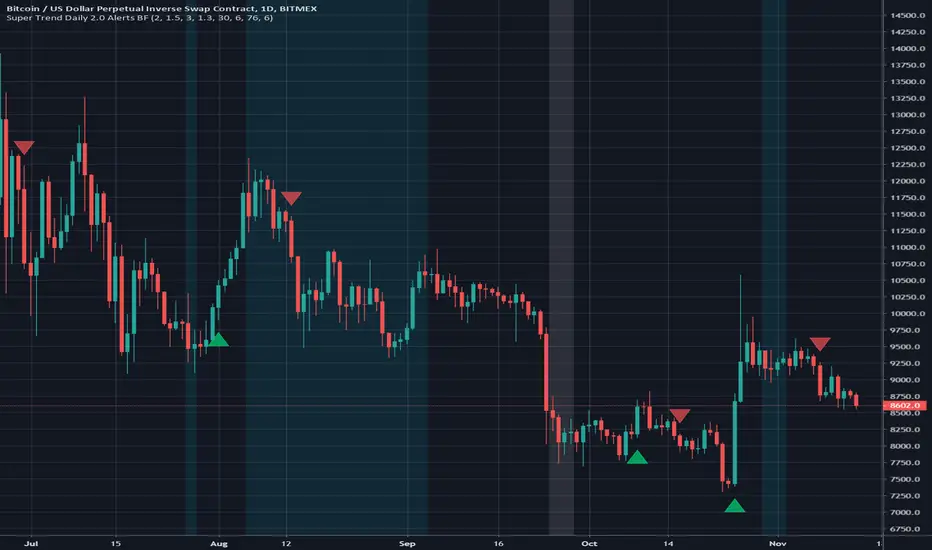
Super Trend Daily 2.0 Alerts BFThis is an alerts script for my Super Trend 2.0 indicator . It is intended as a companion script so you can backtest using the Strategy script and generate alerts using this Study script.
This Study script has the same default settings as the Strategy script and its only purpose is to provide alerts for the long and short signals the Strategy generates. Obviously, if you want to generate alerts based on a Strategy backtest, please ensure the settings are the same in the Study as in the Strategy.
For illustration, I have plotted arrows on the chart for long and short signals, and also colored the background to show when the rate of change function determines a choppy/sideways market.
ALERTS
There are 2 alerts set up:
Long Entry
Short Entry
ILLUSTRATION
Green arrow = Long Entry
Red arrow = Short Entry
White background = No short trades
Aqua background = No long trades
EXAMPLE USE CASE
1. Open a Bitcoin/USD chart on 1D timeframe.
2. Open this script and the Super Trend 2.0 indicator script.
3. Backtest with the Strategy Backtester and change the settings if you like until you get a desirable outcome for your own purposes.
4. Once you are happy with the backtest, change the settings in the Alerts script (this one) so they match the Strategy settings.
5. Set up the alerts according to your preferences.