MA Streak Change ChannelChange Channel is like KC unless it uses percentage changes in price to set channel distance. Midline is zero-lag smoothed ROC with dynamic period based on MA Streak indicator, if MA Streak shows an ongoing trend, midline going strong and break out the channel.
Consider using ▲ green areas as a signal to buy and ▼ red areas as a sell signal. It works best in a flat market. Use in combination with other indicators.
Wyszukaj w skryptach "change"

Change in State of Delivery CISD [AlgoAlpha]🟠 OVERVIEW
This script tracks how price “changes delivery” after failed attempts to push in one direction. It builds swing levels from pivots, watches for those levels to be wicked, and then checks if price delivers cleanly in the opposite direction. When the pattern meets the script’s tolerance rules, it marks a Change in State of Delivery (CISD). These CISD levels are drawn as origin lines and are used to spot shifts in intent, failed pushes, and continuation attempts. A CISD becomes stronger when it forms after opposing liquidity is swept within a defined lookback.
🟠 CONCEPTS
The script first defines structure using swing highs/lows. These levels act as potential liquidity points. When price wicks through a swing, the script registers a mitigation event. After this, it looks for a reversal-style candle sequence: a failed push, followed by a counter-move strong enough to pass a tolerance ratio. This ratio compares how far price expanded away from the failed attempt versus the counter-move that followed. If the ratio is high enough, this becomes a CISD. The idea is simple: liquidity interaction sets context , and the tolerance logic identifies actual intent . CISD levels and sweep markers combine these two ideas into a clean map of where delivery flipped.
🟠 FEATURES
Liquidity tracking: marks swing highs/lows and updates them until expiry
Liquidity sweep confirmation when CISD aligns with recent mitigations
Alert conditions for all key events: mitigations, CISDs, and strong CISDs
🟠 USAGE
Setup : Add the script to your chart. Use it on any timeframe where swing behavior matters. Set the Swing Period for how wide a pivot must be. Set Noise Filter to control how strict the CISD detection is. Liquidity Lookback defines how recent a wick must be to confirm a sweep.
Read the chart : Origin lines mark where the CISD began. A green line signals bullish intent; a red line signals bearish intent. ▲ and ▼ shapes show CISDs that form after liquidity is swept, these mark strong signals for potential entry. Swing dots show recent swing highs/lows. Candle colors follow the latest CISD trend.
Settings that matter : Increasing Swing Period produces fewer but stronger swings. Raising Noise Filter requires cleaner counter-moves and reduces false CISDs. Liquidity Lookback controls how strict the sweep confirmation is. Expiry Bars decides how long swing levels remain active.

Changed Percentage Labels - Quan DaoThis overlayed utility is used for showing the volatality of the price.
It is useful to see the changed percentage of the price in order to decide what stock/crypto to buy, b/c if the volatility (changed percentage) is high it's likely that you can make bigger profit.
Added option to display changed percentage for:
- Current Close price compared to previous Closed price.
- Close price compared to Open price.
- High price compared to Low price.
As a limit of current pine script, it can only show the last 50 labels for now.

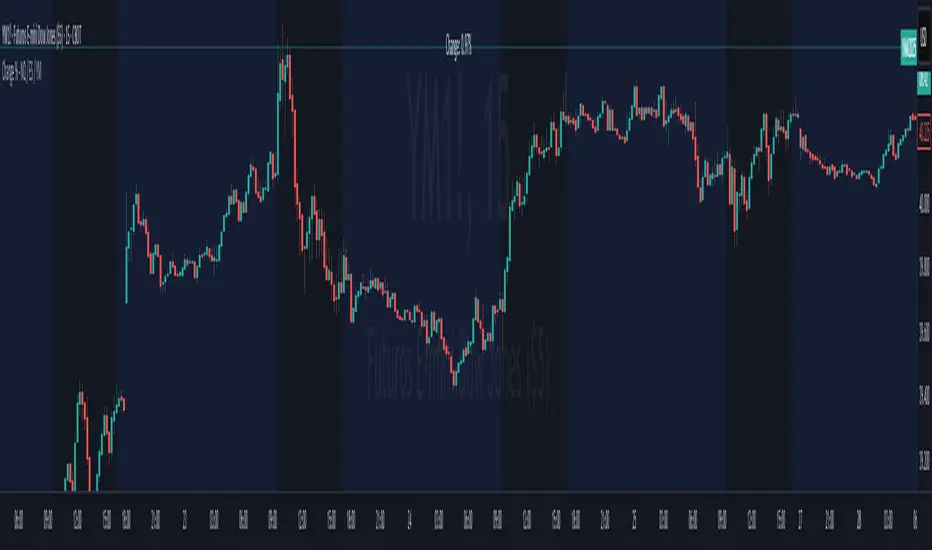
Change % Inteligente - NQ / ES / YMTopstep Compliance: Daily Price Change % Alert (NQ / ES / YM)
Script Purpose
This script helps funded traders (especially those using Topstep or similar programs) monitor the real-time percentage change of major equity index futures: Nasdaq (NQ), S&P 500 (ES), and Dow Jones (YM).
⚠️ Why it matters
Topstep prohibits trading within 2% of the daily price limits set by the CME. If a trader holds a position too close to those limits, they risk account disqualification.
📊 How it works
• Detects the instrument: NQ1!, ES1!, YM1!, or M2025 contracts
• Calculates the real-time % change from today’s market open
• Simulates daily CME price limits (+7% / -7%)
• Highlights when price enters the last 2% of the limit range (prohibited zone)
• Displays a clean, floating panel with the current % change and a warning if necessary
• Sends a visual and optional audio alert when in the prohibited zone
🧠 What makes this script unique?
This tool is **not for technical analysis**. It focuses exclusively on **funding program compliance** and **account protection**, which is not covered by other public scripts. It’s lightweight, intuitive, and designed for traders who manage risk like professionals.
✅ Open-source and ready for review.
✅ CHART SETUP FOR PUBLICATION
✔️ Use a clean chart
✔️ Only apply this script
✔️ Make sure the panel is visible (top-right or top-center recommended)
❌ No extra indicators or drawings
✔️ Use NQM2025, ESM2025 or YMM2025 on a volatile day (to show -1% to -3% range)
INSTRUCTIONS
1. Add the script to your chart.
2. Use it with NQ1!, ES1!, or YM1! (or M2025 contracts).
3. The panel will show today’s price change %.
4. If the market is within the last 2% of the CME price limit, a warning will appear.
5. Use this to avoid violating Topstep’s trading rules during volatile days.
Change in State of Delivery (CISD) [SB Instant]🧠 Modified by SB | Core Logic by LuxAlgo
🔗 Licensed under CC BY-NC-SA 4.0
Change in State of Delivery (CISD) is a concept rooted in observing shifts in order flow behavior, designed to detect the first signs of trend exhaustion and potential reversal. This model tracks when the current delivery (trend) structure — bullish or bearish — is violated by an opposing force, signaling a potential change in market intent.
In simple terms:
A Bullish CISD is triggered when sellers fail to maintain control, and buyers break above a delivery line.
A Bearish CISD is triggered when buyers fail, and sellers break below a delivery line.
This version uses real-time logic, triggering alerts immediately on break, rather than waiting for candle-close confirmation — giving faster, actionable signals to precision-driven traders.
⚙️ Core Features
Detection Modes
Classic: Traditional swing-based structural break detection
Liquidity Sweep: Logic incorporating wick sweeps (liquidity grabs)
Custom Parameters
Swing Length: Number of candles used to identify swing points
Minimum CISD Duration: Minimum length required for valid delivery phase
Maximum Swing Validity: How long the structure remains valid for potential breaks
Visual Options
Label and line styling options
Solid line = Initial break of delivery structure
Dashed line = Continuation break in the same trend direction
This allows you to visually differentiate a new reversal vs. a continuation of the existing trend.
🚨 Built-in Alerts
Bullish CISD Detected (Instant)
Bearish CISD Detected (Instant)
These alerts fire immediately when structure is broken, offering early confirmation for aggressive or reactive trade setups.
🔔 IMPORTANT:
If an alert triggers but the delivery line is not present, wait for the price to form the CISD label again and manually mark the price level using a horizontal ray. This ensures you are trading from a clearly defined structure.
🕒 Recommended Timeframes
✅ Use 30-Minute or 4-Hour charts to identify high-confidence CISD zones
🎯 Then drop to the 1-Minute or 5-Minute chart for precise entry execution
This top-down approach aligns higher timeframe narrative with lower timeframe entry triggers, increasing your edge in both timing and context.
🧠 How to Use CISD Effectively
Bullish Scenario:
Watch for breaks above bearish delivery structures, especially if confirmed with:
Fair Value Gaps (FVG)
The Strat 2-2 reversal
MSS (Market Structure Shift)
Bearish Scenario:
Look for breaks below bullish delivery setups in alignment with:
BOS (Break of Structure)
The Strat 3-1-2
Bearish liquidity sweeps
Key Tip:
Solid line = Initial CISD (new shift)
Dashed line = Continuation of current trend
This visual distinction helps you determine when a market is shifting vs. extending.
📎 Disclaimer
This tool is provided for educational purposes only and is not intended as financial advice. Always backtest, paper trade, and manage risk responsibly.
📚 Credits
Original CISD framework developed by LuxAlgo
Real-time execution logic, alert enhancements, and intraday utility designed by SB (SamB)

Change in DominanceTitle: Change in Dominance Indicator
Description:
This is a tool designed to gauge the prevailing trend in the cryptocurrency market. By analyzing the Rate of Change (ROC) in percentage terms over the previous 9 bars for BTC Dominance (BTC.D), Ethereum Dominance (ETH.D), Other Altcoins Dominance (OTHER.D), and USDT Dominance (USDT.D).
How It Works:
The indicator calculates the ROC for BTC.D, ETH.D (aggregated as part of the Altcoin market), OTHER.D (also included in the Altcoin calculation), and USDT.D.
Three lines represent the trends for Bitcoin (BTC), Altcoins (ETH and OTHER combined), and USDT respectively:
Green Line: Represents the trend for BTC. A higher green line indicates a dominance of BTC in the market trend, suggesting money flow into Bitcoin.
Silver Line: Indicates the Altcoin trend (combining ETH and OTHER). When the silver line is the highest among the three, it signals that Altcoins are leading the market, which can be considered bullish as it suggests money is flowing into Altcoins.
Red Line: Represents the USDT trend. A dominant red line over others implies a bearish market sentiment, indicating money flow out of cryptocurrencies and into USDT.
Usage Tips:
Altcoin Bullishness: When the silver line is above both the red and green lines, it suggests a bullish trend for Altcoins, indicating that money is flowing into the Altcoin sector of the market.
Market Bearishness: If the red line surpasses the silver and green lines, it could be a signal that investors are moving their funds into USDT, often a sign of bearish market sentiment.
BTC Bullishness: A higher green line compared to the silver and red lines implies that Bitcoin is the dominant force in the market, suggesting a bullish sentiment for BTC.

Change of VolatilityOVERVIEW
The Change of Volatility indicator is a technical indicator that gauges the amount of volatility currently present in the market. The purpose of this indicator is to filter out with-trend signals during ranging/non-trending/consolidating conditions.
CONCEPTS
This indicator assists traders in capitalizing on the assumption that trends are more likely to start during periods of high volatility compared to periods of low volatility . This is because high volatility indicates that there are bigger players currently in the market, which is necessary to begin a sustained trending move.
So, to determine whether the current volatility in the market is low, the indicator will grey out all the areas on the chart whose short term standard deviation of volatility is lower than the long term standard deviation of volatility.
If the short term standard deviation of volatility is above the long term standard deviation of volatility, the current volatility in the market is considered high. This would the ideal time to enter a trending trade due to the assumption that trends are more likely to start during these high-volatility periods.
HOW DO I READ THIS INDICATOR
When the histogram is grey, don't take any trend trades since the current volatility is less than the usual volatility experienced in the market.
When the histogram is green, take all valid with-trend trades since the current volatility is greater than the usual volatility experienced in the market.

Change % controlIndicator shows percent change of current bar and between current value and low/high value N (default = 3) bars back.
Sometimes helps not to jump into the left trains and find your departing.
Индикатор показывает процентное изменение текущего бара а также изменение между текущим значением и N (по умолчанию 3 ) значений назад, не считая текущий.
Часто помогает не запрыгивать в уезжающий поезд а найти свой отправляющийся.

Change Per Period - Tom1traderwww.tradingview.com
Plots the values between current close and close (specified number of periods) ago. User chooses the period defaulted to 1 and the period of a simple moving average of the values in the series. Made this specifically to measure the drift of the VIX exchange traded funds VXX, UVXY and SVXY. The fact that they must drift can be strategic in trading.
In the chart example it shows that VXX drifts down usually between -$10 and -$20 over a 60 day period (eyeball) and that for a few days in February of 2017 it had drifted down -$75. To find a positive change (briefly) you can see you have to go back to November of 2016. If you use Heiken Ashi candles or ohlc bars or change between regular candles and these there is a set of variables in this code that lets you do that without changing your indicator results. Anyhow use it or any of the code if it helps you, good luck with your trading and keep smiling! (any feedback appreciated also :-) )

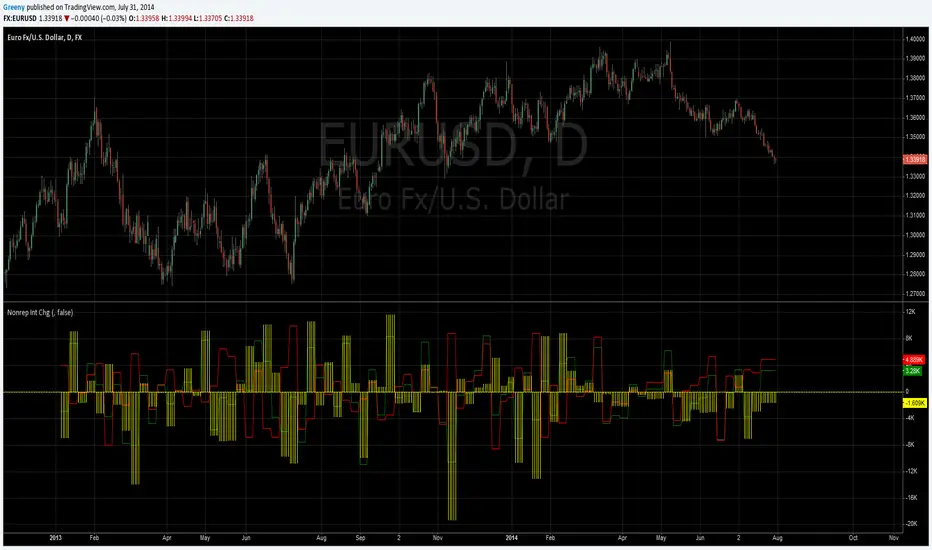
COT (Legacy): Non-Reportable Interest ChangeChange in Open Interest for non reportable traders from legacy commitment of traders (COT) report. For the main symbol but also allows to override it. Also allows to include options in consideration.
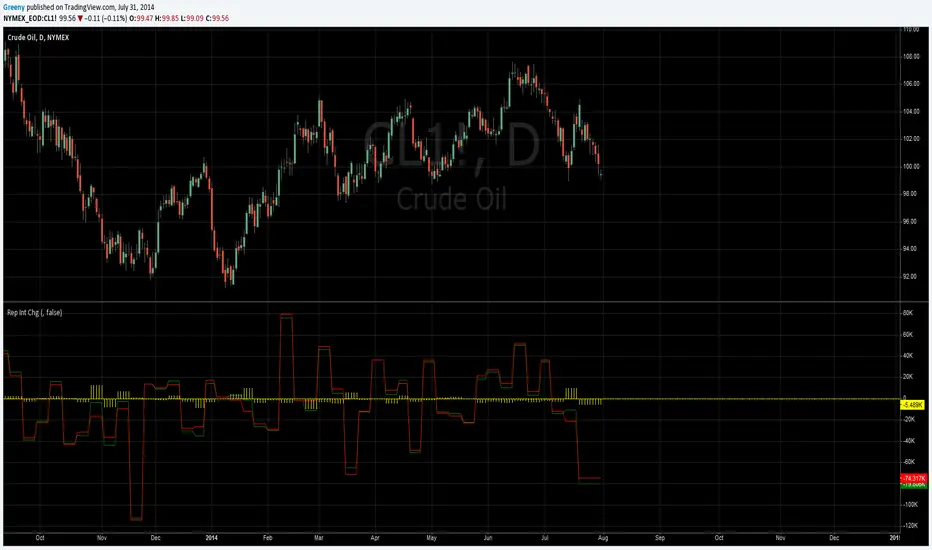
COT (Legacy): Reportable Interest ChangeChange in Open Interest for all reportable traders from legacy commitment of traders (COT) report. For the main symbol but also allows to override it. Also allows to include options in consideration.
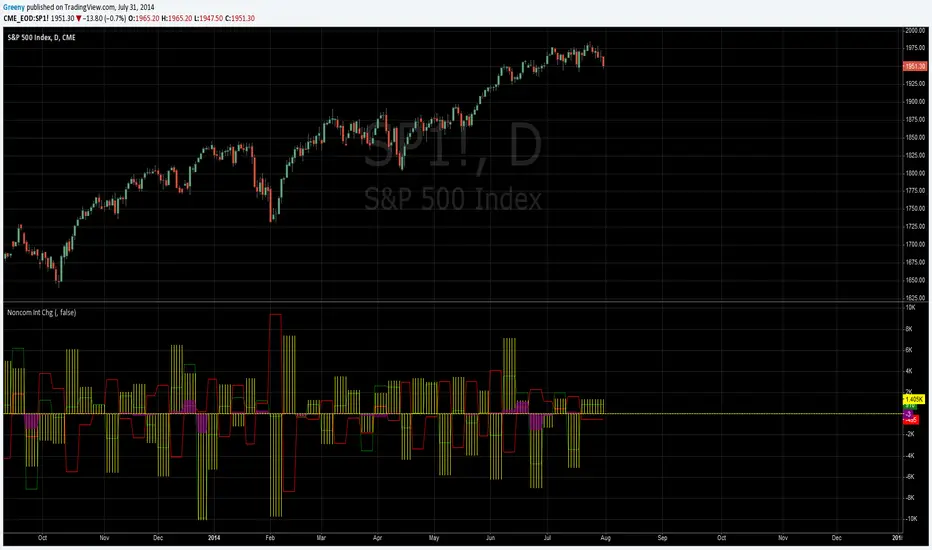
COT (Legacy): Noncommercial Interest ChangeChange in Open Interest for non commercial traders from legacy commitment of traders (COT) report. For the main symbol but also allows to override it. Also allows to include options in consideration.
COT (Legacy): Commercial Interest ChangeChange in Open Interest for commercial traders from legacy commitment of traders (COT) report. For the main symbol but also allows to override it. Also allows to include options in consideration.
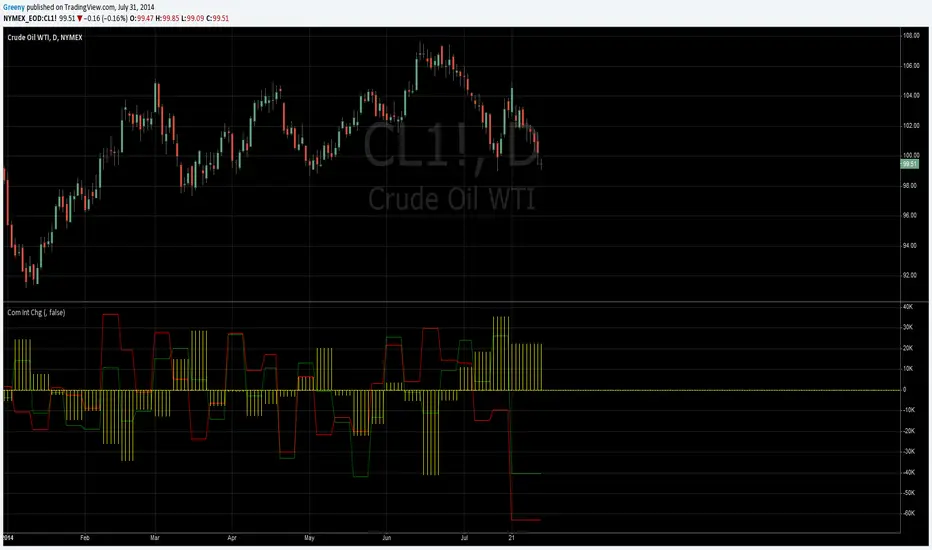
COT (Legacy): Open Interest ChangeChange in Open Interest from legacy commitment of traders (COT) report. For the main symbol but also allows to override it. Also allows to include options in consideration.

ZS Game Changer Pump & Dump DetectorZS GAME CHANGER PUMP AND DUMP DETECTOR - TOP 2 MOMENTUM TRACKER
Created by Zakaria Safri
An intelligent indicator specifically designed to identify and highlight the two most significant pump and dump candles within your selected lookback period. Perfect for traders who want to focus on the game-changing moves that truly matter in volatile markets like cryptocurrency, stocks, and forex.
CORE FEATURES
AUTOMATIC GAME CHANGER DETECTION
The indicator continuously scans your specified lookback period and automatically identifies the top 2 strongest pump candles and top 2 strongest dump candles. These game-changing candles are highlighted with distinctive gold labels and horizontal reference lines, making them instantly visible on your chart. Unlike other indicators that show every small move, this focuses exclusively on the market-moving moments that define trends and create opportunities.
INTELLIGENT PUMP AND DUMP CLASSIFICATION
Uses advanced percentage-based calculations to classify candles as pumps when price surges significantly upward and dumps when price plunges sharply downward. The detection system accounts for candle body size, wick proportions, and volume confirmation to ensure only legitimate momentum moves trigger signals. Customizable thresholds allow adaptation to any market volatility profile from calm stocks to wild altcoins.
ADVANCED WICK EXCLUSION FILTER
Eliminates false signals caused by candles with large wicks and small bodies. This filter focuses analysis exclusively on candles with substantial body sizes that indicate genuine directional conviction rather than temporary spikes followed by rejection. The body to candle ratio is fully adjustable to match your preferred signal quality standards.
VOLUME CONFIRMATION SYSTEM
Optional volume filter ensures detected pumps and dumps are backed by real market participation. The indicator compares current volume against a moving average and only triggers signals when volume exceeds your specified multiplier threshold. This eliminates low-volume noise and focuses on moves supported by institutional or crowd participation.
RALLY SEQUENCE DETECTION
Identifies and highlights consecutive sequences of pump or dump candles with colored background overlays. Green background indicates sustained buying pressure across multiple candles while red background shows sustained selling pressure. The rally detection system includes an optional one-miss allowance that prevents the sequence from breaking due to a single neutral candle.
HORIZONTAL REFERENCE LINES
Draws dashed lines from each game changer candle extending to the current bar, providing constant visual reference to the most significant support and resistance levels created by extreme momentum. The top game changer gets a thick dashed line while the second gets a dotted line for easy differentiation. Labels on the right side display the exact percentage move.
COMPREHENSIVE STATISTICS DASHBOARD
Real-time information panel showing current market status as pumping, dumping, or neutral along with the current candle percentage change. Displays the exact percentage values for top pump number 1, top pump number 2, top dump number 1, and top dump number 2. Shows running totals of all pumps and dumps detected since chart load. Tracks consecutive candle counts during active rally sequences.
TESTING AND VERIFICATION MODE
Built-in debug mode displays percentage change directly on each qualifying pump and dump candle, allowing instant verification that calculations are accurate. Shows which filters are currently active with a simple code in the dashboard. Helps traders understand exactly why certain candles qualified as game changers.
HOW THE GAME CHANGER DETECTION WORKS
SCANNING ALGORITHM
Every bar close, the indicator scans backward through your specified lookback period examining every candle's percentage change from its previous close. For bullish moves, it identifies the two candles with the largest positive percentage change that meet your threshold requirements. For bearish moves, it identifies the two candles with the largest negative percentage change meeting threshold requirements.
RANKING SYSTEM
Candles are ranked purely by their percentage move magnitude. The number 1 game changer is always the single strongest move in the lookback period. The number 2 game changer is the second strongest move. Rankings update dynamically as new candles form and old candles exit the lookback window.
VISUAL IDENTIFICATION
Game changer number 1 for both pumps and dumps receives a large gold label reading GAME CHANGER NUMBER 1 with zero transparency for maximum visibility. Game changer number 2 receives a slightly smaller gold label with partial transparency. The candle bars themselves are colored in gold instead of the standard green or red. Horizontal lines extend from the game changer price level to current bar.
FILTER APPLICATION
Only candles that pass your configured filters qualify for game changer consideration. If wick exclusion is enabled, candles with large wicks and small bodies are ignored. If volume confirmation is enabled, only candles with above-average volume qualify. This ensures game changers represent legitimate market moves rather than aberrations.
PRACTICAL APPLICATIONS
FOR CRYPTOCURRENCY TRADERS
Crypto markets experience extreme volatility with occasional massive pump and dump candles that define entire trends. This indicator instantly identifies which candles represent true market structure shifts versus normal noise. Use the game changer levels as key support and resistance for entries, exits, and stop placement. The top pump often marks the local high to watch for breakouts while the top dump marks the local low for reversal trades.
FOR DAY TRADERS
Intraday charts contain hundreds of candles but only a few truly matter for the session outcome. Game changer detection filters out 98 percent of candles to show you the 2 percent that drove the actual price movement. Enter trades on the side of the strongest recent game changer. Use game changer levels as magnet prices where algorithmic trading often returns.
FOR SWING TRADERS
On daily and four-hour timeframes, game changers represent major institutional activity or news-driven moves. The top dump often marks capitulation selling that creates reversal opportunities. The top pump often marks FOMO buying that creates resistance levels. Swing traders can build positions knowing these levels will be defended or tested multiple times.
FOR VOLATILITY ANALYSIS
Understanding which candles created the most volatility helps assess market risk. Multiple game changers clustered together indicate unstable choppy conditions. Game changers separated by many neutral candles indicate trending stable conditions. Use this context to adjust position sizing and stop distances appropriately.
FOR SUPPORT AND RESISTANCE TRADING
Game changer candles create the strongest support and resistance levels because they represent prices where massive volume transacted in short time periods. These levels have higher probability of holding on retest compared to arbitrary moving averages or pivot points. Trade bounces off game changer levels or breakouts through them.
RECOMMENDED SETTINGS BY MARKET
CRYPTOCURRENCY 15-MINUTE TO 1-HOUR CHARTS
Candle Size Threshold: 2.0 percent
Body to Candle Ratio: 0.5
Volume Multiplier: 1.5 times average
Game Changer Lookback: 100 bars
Extreme Threshold: 3.5 percent
Enable Wick Filter: Yes
Enable Volume Confirmation: Yes
Minimum Rally Candles: 3
STOCKS DAILY CHARTS
Candle Size Threshold: 1.0 percent
Body to Candle Ratio: 0.6
Volume Multiplier: 2.0 times average
Game Changer Lookback: 50 bars
Extreme Threshold: 2.5 percent
Enable Wick Filter: Yes
Enable Volume Confirmation: Yes
Minimum Rally Candles: 2
FOREX 1-HOUR TO 4-HOUR CHARTS
Candle Size Threshold: 0.5 percent
Body to Candle Ratio: 0.5
Volume Multiplier: Not applicable
Game Changer Lookback: 80 bars
Extreme Threshold: 1.0 percent
Enable Wick Filter: Yes
Enable Volume Confirmation: No
Minimum Rally Candles: 3
SCALPING 1-MINUTE TO 5-MINUTE CHARTS
Candle Size Threshold: 0.8 percent
Body to Candle Ratio: 0.4
Volume Multiplier: 1.2 times average
Game Changer Lookback: 50 bars
Extreme Threshold: 1.5 percent
Enable Wick Filter: No
Enable Volume Confirmation: Yes
Minimum Rally Candles: 2
WHAT IS INCLUDED
Automatic identification of top 2 pump candles
Automatic identification of top 2 dump candles
Gold colored game changer labels with size differentiation
Gold colored candle bars for game changers
Horizontal reference lines from game changers to current price
Regular pump and dump detection with green and red candles
Rally sequence detection with background highlighting
Extreme move detection and labeling system
Real-time statistics dashboard with all key metrics
Percentage change debug mode for verification
Volume confirmation filter with adjustable multiplier
Wick exclusion filter with adjustable body ratio
Customizable lookback period from 20 to 500 bars
Consecutive candle counter for rally tracking
Alert system for game changers, pumps, dumps, and rallies
Works on all timeframes from 1 minute to monthly
Compatible with stocks, forex, cryptocurrency, and futures
UNDERSTANDING GAME CHANGERS
WHAT MAKES A CANDLE A GAME CHANGER
A game changer is not just a large move but the largest move within context. In a volatile crypto market, a 5 percent pump might not rank in the top 2. In a stable stock, a 2 percent pump could be the number 1 game changer. The indicator adapts to your specific instrument and timeframe to find what truly matters in that context.
WHY FOCUS ON TOP 2 ONLY
Markets are driven by a small number of significant moves rather than the average of all moves. By focusing exclusively on the top 2 in each direction, traders can ignore noise and concentrate on the price levels that actually matter for support, resistance, and momentum. This creates clarity in decision making.
GAME CHANGERS AS MARKET STRUCTURE
The top pump often marks the recent high that bulls must break to continue uptrend. The top dump often marks the recent low that bears must break to continue downtrend. These become the key levels around which all other price action rotates. Understanding this structure is essential for profitable trading.
GAME CHANGERS AS SENTIMENT INDICATORS
Consecutive pump game changers signal strong bullish sentiment and FOMO conditions. Consecutive dump game changers signal fear and capitulation. Alternating pump and dump game changers signal indecision and range conditions. Read the pattern of game changers to gauge market psychology.
VERIFICATION AND TESTING
HOW TO VERIFY ACCURACY
Enable Show Debug Info on Chart in the Testing and Debug settings group. This displays the percentage change calculation directly on every qualifying pump and dump candle. Manually verify by calculating open minus close divided by close multiplied by 100. The debug percentage should match your manual calculation exactly.
HOW TO TEST FILTERS
Toggle wick exclusion filter on and off while watching how many candles qualify. With filter on, candles with long wicks and small bodies should disappear. Toggle volume confirmation on and off to see how low-volume candles get excluded. Adjust the thresholds and watch the real-time impact on signal count.
HOW TO VERIFY GAME CHANGERS
Look at your chart and visually identify which candle had the biggest green body in the lookback period. The game changer number 1 pump label should be on that exact candle. Repeat for the biggest red candle to verify game changer number 1 dump. The rankings should match your visual assessment.
LOOKBACK PERIOD EFFECTS
Decrease the lookback period to 20 bars and watch game changers update to only recent moves. Increase to 500 bars and watch game changers potentially change to older historic moves. The optimal lookback balances recency with significance. Too short misses important levels, too long includes irrelevant history.
DASHBOARD INFORMATION GUIDE
STATUS ROW
Shows PUMPING when current candle qualifies as a pump, DUMPING when current candle qualifies as a dump, or NEUTRAL when current candle does not meet threshold requirements. This updates in real-time on every bar close.
CURRENT CHANGE ROW
Displays the percentage change of the current candle from its previous close. Positive percentages indicate bullish candle, negative indicate bearish candle. This number may or may not meet your threshold to qualify as pump or dump.
TOP PUMP NUMBER 1
The highest positive percentage change found in your lookback period. This candle is marked with the large gold GAME CHANGER NUMBER 1 label below it. Shows N/A if no pumps exist in the lookback period.
TOP PUMP NUMBER 2
The second highest positive percentage change found in your lookback period. Marked with smaller gold GAME CHANGER NUMBER 2 label. Shows N/A if only one or zero pumps exist.
TOP DUMP NUMBER 1
The highest negative percentage change magnitude found in your lookback period. This candle is marked with the large gold GAME CHANGER NUMBER 1 label above it. Shows N/A if no dumps exist.
TOP DUMP NUMBER 2
The second highest negative percentage change magnitude found in your lookback period. Marked with smaller gold GAME CHANGER NUMBER 2 label. Shows N/A if only one or zero dumps exist.
TOTAL PUMPS
Running count of all pump candles detected since you loaded the indicator on this chart. This number continuously increases as new qualifying pumps form. Resets when you reload the chart.
TOTAL DUMPS
Running count of all dump candles detected since chart load. Increases as new qualifying dumps form and resets on chart reload.
CONSECUTIVE
Shows the current count of consecutive pump or dump candles during an active rally. Displays 3 UP during a 3-candle pump rally or 5 DN during a 5-candle dump rally. Shows 0 when no rally is active.
ALERT SYSTEM
GAME CHANGER DETECTED ALERT
Triggers whenever the current candle becomes one of the top 2 pumps or top 2 dumps. This is the highest priority alert indicating a market-moving event just occurred. Use this alert for immediate notification of significant opportunities.
PUMP DETECTED ALERT
Triggers on every candle that qualifies as a pump according to your threshold and filter settings. This includes regular pumps and extreme pumps but excludes game changers which have their separate alert. Use for general upward momentum monitoring.
DUMP DETECTED ALERT
Triggers on every candle that qualifies as a dump according to your settings. Includes regular and extreme dumps but excludes game changers. Use for general downward momentum monitoring.
PUMP RALLY STARTED ALERT
Triggers when consecutive pump candles reach your minimum rally threshold. Indicates the beginning of a sustained upward movement sequence. Use to catch trends early.
DUMP RALLY STARTED ALERT
Triggers when consecutive dump candles reach your minimum rally threshold. Indicates the beginning of a sustained downward movement sequence. Use for trend following or reversal timing.
ALERT MESSAGE FORMAT
All alerts include the ticker symbol and current price using TradingView placeholders. Messages are descriptive and specify which type of signal triggered. Alerts work with TradingView notification system including email, SMS, webhook, and app notifications.
TECHNICAL SPECIFICATIONS
CALCULATION METHODOLOGY
Percentage change calculated as current close minus previous close divided by previous close multiplied by 100. Body ratio calculated as absolute value of close minus open divided by high minus low. Volume elevation calculated as current volume divided by 20-period simple moving average of volume. Game changer ranking uses absolute value comparison across entire lookback array.
PERFORMANCE CHARACTERISTICS
Lightweight calculations optimized for speed on all timeframes. No repainting of signals ensuring all triggers are final on bar close. Variables properly scoped with var keyword for memory efficiency. Maximum bars back set to 500 to prevent excessive historical loading. Updates in real-time on every bar close without lag.
COMPATIBILITY
Works on all TradingView plans including free, pro, and premium. Compatible with stocks, forex, cryptocurrency, futures, indices, and commodities. Functions correctly on all timeframes from 1 second to monthly. No external data requests ensuring fast loading. Overlay true setting places directly on price chart.
RISK DISCLAIMER
This indicator is a technical analysis tool for identifying momentum and should not be used as the sole basis for trading decisions. Game changer levels can be broken during strong trends and are not guaranteed support or resistance. Pump and dump detection does not predict future price direction. Always use proper risk management with stop losses on every trade. Combine this indicator with other forms of analysis including fundamentals, market context, and risk assessment. Practice on demo accounts before live trading. Past performance of game changer signals does not guarantee future results. Trading carries substantial risk of loss and is not suitable for all investors. The creator is not responsible for trading losses incurred while using this tool.
SUPPORT AND UPDATES
Regular updates based on user feedback and market evolution. Built following PineCoders industry standards and best practices for code quality. Clean well-documented code structure for transparency and auditability. Optimized performance across all timeframes and instruments. Active development with continuous improvements and feature additions.
WHY CHOOSE ZS GAME CHANGER PUMP AND DUMP DETECTOR
Focuses on what matters by highlighting only the top 2 moves in each direction instead of cluttering your chart with every small fluctuation. Saves time by automatically identifying the most significant candles rather than requiring manual scanning. Provides clarity through visual gold labels and reference lines that make game changers unmistakable. Adapts to any market with customizable thresholds for volatility and volume. Eliminates noise with advanced wick and volume filters ensuring signal quality. Offers verification through debug mode proving calculations are accurate and trustworthy. Includes comprehensive statistics showing exact percentages and counts. Works everywhere across all markets, timeframes, and instruments without modification.
Transform your chart analysis by focusing exclusively on the game-changing moments that define trends and create opportunities.
Version 1.1 | Created by Zakaria Safri | Pine Script Version 5 | PineCoders Compliant

Cumulative Price Change AlertCumulative Price Change Alert
Version: 1.0
Author: QCodeTrader 🚀
Overview 🔍
The Cumulative Price Change Alert indicator analyzes the percentage change between the current and previous open prices and sums these changes over a user-defined number of bars. It then generates visual buy and sell signals using arrows and labels on the chart, helping traders spot cumulative price momentum and potential trading opportunities.
Key Features ⚙️
Customizable Timeframe 🕒:
Use a custom timeframe or default to the chart's timeframe for price data.
User-Defined Summation 🔢:
Specify the number of bars to sum, allowing you to analyze cumulative price changes.
Custom Buy & Sell Conditions 🔔:
Set individual percentage change thresholds and cumulative sum thresholds to tailor signals for
your strategy.
Visual Alerts 🚀:
Displays green upward arrows for buy signals and red downward arrows for sell signals directly
on the chart.
Informative Labels 📝:
Provides labels with formatted percentage change and cumulative sum details for the analyzed
bars.
Versatile Application 📊:
Suitable for stocks, forex, crypto, commodities, and more.
How It Works ⚡
Price Change Calculation ➗:
The indicator calculates the percentage change between the current bar's open price and the
previous bar's open price.
Cumulative Sum ➕:
It then sums these percentage changes over the last N bars (as specified by the user).
Signal Generation 🚦:
Buy Signal 🟢: When both the individual percentage change and the cumulative sum exceed
their respective buy thresholds, a green arrow and label are displayed.
Sell Signal 🔴: Conversely, if the individual change and cumulative sum fall below the sell
thresholds, a red arrow and label are shown.
How to Use 💡
Add the Indicator ➕:
Apply the indicator to your chart.
Customize Settings ⚙️:
Set a custom timeframe if desired.
Define the number of bars to sum.
Adjust the buy/sell percentage change and cumulative sum thresholds to match your trading
strategy.
Interpret Visual Cues 👀:
Monitor the chart for green or red arrows and corresponding labels that signal potential buy or
sell opportunities based on cumulative price movements.
Settings Explained 🛠️
Custom Timeframe:
Select an alternative timeframe for analysis, or leave empty to use the current chart's timeframe.
Number of Last Bars to Sum:
Determines how many bars are used to compute the cumulative percentage change.
Buy Condition - Min % Change:
The minimum individual percentage change required to consider a buy signal.
Buy Condition - Min Sum of Bars:
The minimum cumulative percentage change over the defined bars needed for a buy signal.
Sell Condition - Max % Change:
The maximum individual percentage change threshold for a sell signal.
Sell Condition - Max Sum of Bars:
The maximum cumulative percentage change over the defined bars for triggering a sell signal.
Best Use Cases 🎯
Momentum Identification 📈:
Quickly spot strong cumulative price movements and momentum shifts.
Entry/Exit Signals 🚪:
Use the visual signals to determine potential entry and exit points in your trading.
Versatile Strategy Application 🔄:
Effective for scalping, swing trading, and longer-term analysis across various markets.
UPD: uncheck labels for better performance

Time Change Indicator-AYNETDetailed Scientific Explanation of the Time Change Indicator Code
This Pine Script code implements a financial indicator designed to measure and visualize the percentage change in the closing price of an asset over a specified timeframe. It uses historical data to calculate changes and displays them as a histogram for intuitive analysis. Below is a comprehensive scientific breakdown of the code:
1. User Inputs
The script begins by defining user-configurable parameters, enabling flexibility in analysis:
timeframe: The user selects the timeframe for measuring price changes (e.g., 1 hour, 1 day). This determines the granularity of the analysis.
positive_color and negative_color: Users choose the colors for positive and negative changes, enhancing visual interpretation.
2. Data Retrieval
The script employs request.security to fetch closing price data (close) for the specified timeframe. This function ensures that the indicator adapts to different timeframes, providing consistent results regardless of the chart's base timeframe.
Current Closing Price (current_close):
current_close
=
request.security(syminfo.tickerid, timeframe, close)
current_close=request.security(syminfo.tickerid, timeframe, close)
Retrieves the closing price for the defined timeframe.
Previous Closing Price (prev_close): The script uses a variable (prev_close) to store the previous closing price. This variable is updated dynamically as new data is processed.
3. Price Change Calculation
The script calculates both the absolute and percentage change in closing price:
Absolute Price Change (price_change):
price_change
=
current_close
−
prev_close
price_change=current_close−prev_close
Measures the difference between the current and previous closing prices.
Percentage Change (percent_change):
percent_change
=
price_change
prev_close
×
100
percent_change=
prev_close
price_change
×100
Normalizes the change relative to the previous closing price, making it easier to compare changes across different assets or timeframes.
4. Conditional Logic for Visualization
The script uses a conditional statement to determine the color of each histogram bar:
Positive Change: If price_change > 0, the bar is assigned the user-defined positive_color.
Negative Change: If price_change < 0, the bar is assigned the negative_color.
This differentiation provides a clear visual cue for understanding price movement direction.
5. Visualization
The script visualizes the percentage change using a histogram and enhances the chart with dynamic labels:
Histogram (plot.style_histogram):
Each bar represents the percentage change for a given timeframe.
Bars above the zero line indicate positive changes, while bars below the zero line indicate negative changes.
Zero Line (hline(0)): A reference line at zero provides a baseline for interpreting changes.
Dynamic Labels (label.new):
Each bar is annotated with its exact percentage change value.
The label's position and color correspond to the bar, improving clarity.
6. Algorithmic Flow
Data Fetching: Retrieve the current and previous closing prices for the specified timeframe.
Change Calculation: Compute the absolute and percentage changes between the two prices.
Bar Coloring: Determine the color of the histogram bar based on the change's direction.
Plotting: Visualize the changes as a histogram and add labels for precise data representation.
7. Applications
This indicator has several practical applications in financial analysis:
Volatility Analysis: By visualizing percentage changes, traders can assess the volatility of an asset over specific timeframes.
Trend Identification: Positive and negative bars highlight periods of upward or downward momentum.
Cross-Asset Comparison: Normalized percentage changes enable the comparison of price movements across different assets, regardless of their nominal values.
Market Sentiment: Persistent positive or negative changes may indicate prevailing bullish or bearish sentiment.
8. Scientific Relevance
This script applies fundamental principles of data visualization and time-series analysis:
Statistical Normalization: Percentage change provides a scale-invariant metric for comparing price movements.
Dynamic Data Processing: By updating the prev_close variable with real-time data, the script adapts to new market conditions.
Visual Communication: The use of color and labels improves the interpretability of quantitative data.
Conclusion
This indicator combines advanced Pine Script functions with robust financial analysis techniques to create an effective tool for evaluating price changes. It is highly adaptable, providing users with the ability to tailor the analysis to their specific needs. If additional features, such as smoothing or multi-timeframe analysis, are required, the code can be further extended.

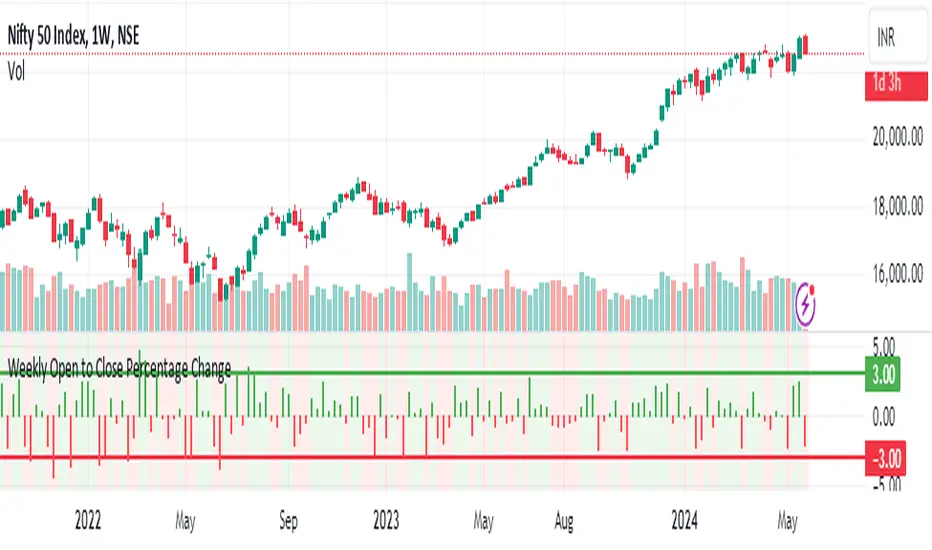
Weekly Open to Close Percentage ChangeThe "Weekly Open to Close Percentage Change Indicator" is a powerful tool designed to help traders and investors track the percentage change in price from the open of the current week's candle to its close. This indicator provides a clear visualization of how the price has moved within the week, offering valuable insights into weekly market trends and momentum.
Key Features:
Weekly Analysis: Focuses on weekly time frames, making it ideal for swing traders and long-term investors.
Percentage Change Calculation: Accurately calculates the percentage change from the open price of the current week's candle to the close price.
Color-Coded Visualization: Uses color coding to differentiate between positive and negative changes:
Green for positive percentage changes (price increase).
Red for negative percentage changes (price decrease).
Histogram Display: Plots the percentage change as a histogram for easy visual interpretation.
Background Highlighting: Adds a background color with transparency to highlight the nature of the change, enhancing chart readability.
Optional Labels: Includes an option to display percentage change values as small dots at the top for quick reference.
How to Use:
Add the script to your TradingView chart by opening the Pine Editor, pasting the script, and saving it.
Apply the indicator to your chart. It will automatically calculate and display the weekly percentage change.
Use the color-coded histogram and background to quickly assess weekly price movements and make informed trading decisions.
Use Cases:
Trend Identification: Quickly identify whether the market is trending upwards or downwards on a weekly basis.
Market Sentiment: Gauge the market sentiment by observing the weekly price changes.
Swing Trading: Ideal for swing traders who base their strategies on weekly price movements.
Note: This indicator is designed for educational and informational purposes. Always conduct thorough analysis and consider multiple indicators and factors when making trading decisions.
[ROC3] Rate of Change Candle ColorROC is a statistical indicator which tracks how much a security's price has changed over a certain period, showing whether momentum is picking up or slowing down. It’s a handy tool because it helps traders spot trend changes and understand how strong a trend is.
My ROC3 indicator will color the candlesticks based on the Rate of Change (ROC) and its Exponential Moving Average (EMA). This indicator helps traders visually identify bullish and bearish trends by applying color to the candles, making it easier to spot momentum shifts and trend changes.
How It Works:
Rate of Change (ROC): Calculates the percentage change in the price over a specified number of bars. This indicator measures the speed at which price changes.
EMA of ROC: Applies an Exponential Moving Average to the ROC values to provide a smoothed benchmark. The EMA helps to reduce noise and make trend identification more reliable.
Coloring Logic:
Bullish Candles (Green): When the current ROC is higher than the EMA of the ROC.
Bearish Candles (Red): When the current ROC is lower than the EMA of the ROC.
Settings:
ROC Length (Default: 60): The number of bars used to calculate the Rate of Change. Adjust this parameter to change the sensitivity of the ROC calculation.
ROC EMA Length (Default: 7): The number of bars used to calculate the Exponential Moving Average of the ROC. This length determines how smooth the EMA is. A shorter length reacts faster to price changes, while a longer length provides a smoother, slower response.
How to Use:
Apply the Indicator: Add the Rate of Change Candle Color indicator to your TradingView chart.
Interpret the Colors:
Green Candles: Indicate bullish momentum. The current ROC is greater than its EMA, suggesting upward pressure.
Red Candles: Indicate bearish momentum. The current ROC is less than its EMA, suggesting downward pressure.
Adjust Settings: Customize the ROC Length and ROC EMA Length based on your trading strategy. Shorter ROC lengths may capture more short-term trends, while longer lengths provide a broader view.
Combine with Other Indicators: Use the in conjunction with other technical indicators or chart patterns to enhance your trading analysis.
Example Use Case:
Trend Confirmation: Use the color changes to confirm bullish or bearish trends. Green candles can confirm uptrends, while red candles may signal downtrends or potential reversals.
Momentum Analysis: Monitor how frequently the ROC crosses above or below its EMA to gauge momentum strength and make informed trading decisions.
Note:
This indicator is designed to assist with trend analysis and should be used as part of a broader trading strategy. Always conduct your own research and analysis before making trading decisions.
Cherio...

Magnificent 7 Overall Percentage Change with MA and Angle LabelsMagnificent 7 Overall Percentage Change with MA and Angle Labels
Overview:
The "Magnificent 7 Overall Percentage Change with MA and Angle Labels" indicator tracks the percentage change of seven key tech stocks (Apple, Microsoft, Amazon, NVIDIA, Tesla, Meta, and Alphabet) and displays their overall average percentage change on the chart. It also provides a moving average of this overall change and calculates the angle of the moving average to help traders gauge the momentum and direction of the overall trend.
How it works:
Real-Time Percentage Change: The indicator calculates the percentage change of each of the "Magnificent 7" stocks compared to their previous day's closing price, giving a snapshot of the market's performance.
Overall Average: It then computes the average of the seven stocks' percentage changes to reflect the broader movement of these major tech companies.
Moving Average: The indicator offers a choice of four types of moving averages (SMA, EMA, WMA, or VWMA) to smooth the overall percentage change, allowing traders to focus on the trend rather than short-term fluctuations.
Slope and Angle Calculation: To provide additional insights, the indicator calculates the slope of the moving average and converts it into an angle (in degrees). This can help traders determine the strength of the trend—steeper angles often indicate stronger momentum.
Key Features:
Percentage Change of the "Magnificent 7":
Tracks the percentage change of Apple (AAPL), Microsoft (MSFT), Amazon (AMZN), NVIDIA (NVDA), Tesla (TSLA), Meta (META), and Alphabet (GOOGL) on the current chart's timeframe.
Overall Average Change:
Computes the average percentage change across all seven stocks, giving a combined view of how the most influential tech stocks are performing.
Customizable Moving Averages:
Offers four types of moving averages (SMA, EMA, WMA, VWMA) to provide flexibility in tracking the trend of the overall percentage change.
Angle Calculation:
Measures the angle of the moving average in degrees, which helps assess the strength of the market’s momentum. Alerts and visual cues can be triggered based on the angle's steepness.
Visual Cues:
The percentage change is plotted in green when positive and red when negative, with a background color that changes accordingly. A zero line is plotted for reference.
Use Case:
This indicator is ideal for traders and investors looking to track the collective performance of the most dominant tech companies in the market. It provides real-time insights into how the "Magnificent 7" stocks are moving together and offers clues about potential market momentum based on the direction and angle of their average percentage change.
Customization:
Moving Average Type and Length: Choose between different types of moving averages (SMA, EMA, WMA, VWMA) and adjust the length to suit your preferred timeframe.
Angle Threshold: Set an angle threshold to trigger alerts when the moving average slope becomes too steep, indicating strong momentum.
Alerts:
Alerts can be created based on the crossing of the moving average or when the angle of the moving average exceeds a specified threshold. This ensures traders are notified when the trend is accelerating or decelerating significantly.
Conclusion:
The "Magnificent 7 Overall Percentage Change with MA and Angle Labels" indicator is a powerful tool for those wanting to monitor the performance of the most influential tech stocks, analyze their overall trend, and receive timely alerts when market conditions shift.

Market Structures + ZigZag [TradingFinder] CHoCH/BOS - MSS/MSB🟣 Introduction
🔵 Market Structure
Grasping market structure entails examining market behavior. Essentially, market structure refers to the formation and progression of the market within its trends.
Market structures are generally fractal and nested, leading us to classify them into internal (minor) and external (major) structures. There are several definitions of market structure, with differing perspectives such as Smart Money and ICT offering their own interpretations.
🔵 Zig Zag
The Zigzag indicator is a lagging tool that identifies points on a price chart where significant changes occur compared to the previous wave. By connecting these points, it helps traders detect trends.
This indicator minimizes random price fluctuations, aiming to clarify the primary price trend.
Pivots are points on a price chart where the direction changes. Also known as reversal points, pivots form when supply and demand forces overpower one another.
There are various types of technical analysis pivots, which can be divided into two categories: minor pivots and major pivots, each with distinct significance in analysis.
Major Pivot : These pivots signify substantial changes in the chart's direction and occur at the end of trends. Analysts focusing on primary analysis prioritize major pivot points. In fact, most technical analysis tools are evaluated and based on major pivots.
Minor Pivot : These pivots highlight smaller, subsidiary points and directions, appearing at the end of corrections. Analysts who focus on minor pivots represent small trends. It's important to note that minor pivots are not suitable for use in primary technical tools.
Identifying Minor and Major Pivots :
Minor pivots are formed between two major pivots and do not break the opposing major pivot. (Internal Pivot)
Major pivots are those that either successfully break the opposing pivot or move beyond the previous pivot of the same type. (External Pivot)
🟣 How to Use
🔵 Identifying Break of Structure (BOS)
In a given trend, such as a downtrend, a Break of Structure occurs when the price drops below the previous low and forms a new low (LL). In an uptrend, a BOS (MSB) happens when the price rises and exceeds the last high.
To confirm a trend, at least one BOS is required. The break above or below the previous high or low must be validated by the closing of at least one candle beyond that level.
🔵 Identifying Change of Character (CHOCH)
Change of Character (CHOCH) is an essential concept in market structure analysis, indicating a trend change. In other words, a trend concludes with a CHOCH (MSS). For example, in a downtrend, the price declines with BOS.
While BOS highlights the trend's strength, a CHOCH occurs when the price rises and surpasses the last high, signaling a transition from a downtrend to an uptrend.
This does not imply immediately entering a buy trade; instead, it is prudent to wait for a BOS in the upward direction to confirm the uptrend.
Unlike BOS, confirming a CHOCH does not require a candle to close; simply breaking above or below the previous high or low with the candle's wick is sufficient. The following examples illustrate bearish and bullish CHOCH.
Terms :
Market Structure Shift = MSS
Market Structure Break = MSB
🔵 Zig Zag
Based on identifying pivots and drawing zigzag lines, you can have different uses of this indicator.
Including :
Identifying pivot types along with major and minor recognition.
Identifying internal and external breakouts.
Identifying support and resistance levels.
Identifying Elliott Waves.
Identifying classic patterns.
Identifying pivots with higher validity.
Identifying trends and range areas.
🟣 Settings
Pivot Period Market Structure and ZigZag Line: Using this input, you can determine the pivot period for identifying swings.
Through the settings, you can customize the display, visibility, and color of each line as desired.

Price Change IndicatorPrice Change Indicator (PCI)
Version: 1.0
Author: LazyTrader 🚀
🔍 Overview
The Price Change Indicator (PCI) helps traders visualize and compare price changes between the current bar and the previous bar. It provides a customizable display of price changes in two formats:
Percentage (%) Change – Relative price movement.
Natural Change – Absolute difference in price units.
⚙️ Key Features
✅ Customizable Calculation Method: Choose how the price change is calculated:
Opening Price
Closing Price
High
Low
✅ Flexible Display Format:
Show Percentage (%) Change.
Show Natural (Absolute) Change in price.
✅ Adjustable Sensitivity with Multiplier:
100 (Standard Change)
1000 (Small Change)
10000 (Tiny Change)
✅ Intuitive Labeling:
Green label (above bar) for increase.
Red label (below bar) for decrease.
No label if no change.
Large, easy-to-read labels for better visibility.
✅ Perfect for Any Market:
Stocks 📈
Forex 💱
Crypto 🚀
Commodities 🛢️
📊 How It Works
The indicator calculates the difference between the current and previous bar’s price based on your chosen method.
The result is displayed as either a percentage (%) or a natural price change.
If the price has increased, a green label is displayed above the bar.
If the price has decreased, a red label is displayed below the bar.
⚡ How to Use
Add the indicator to your chart.
Go to settings and customize:
Select calculation method (Open, Close, High, Low).
Choose display format (% or Natural Change).
Adjust multiplier for more sensitivity.
Analyze the labels to see price movements easily!
🔧 Settings Explained
Setting Description
Price Calculation Method: Choose Open, Close, High, or Low price for comparison.
Display Format: Show either % Change or Natural Change.
Multiplier: Apply 100, 1000, or 10000 to scale small price changes.
Show Labels: Toggle labels on/off.
🎯 Best Use Cases
🔹 Identifying strong price movements
🔹 Spotting trends and momentum shifts
🔹 Comparing price movement intensity
🔹 Works for scalping, swing trading, and long-term analysis

Highest Single-Day Percentage Change (Close to Close)This Pine Script is designed to calculate and display the largest percentage change in stock price between consecutive days' closing prices. Here's a high-level breakdown of what the script does:
Daily Percentage Change Calculation:
It calculates how much the stock price changed from the previous day's close to the current day's close. The change is expressed as a percentage of the previous day's closing price.
Tracking the Highest Change:
The script keeps track of the largest percentage increase or decrease it has encountered in the dataset (from previous close to current close). It updates the value if a new day exceeds the current largest recorded percentage change.
Visual Representation:
The daily percentage changes are plotted as a line graph, allowing you to see how the stock's price fluctuates from one day to the next.
A separate line is drawn to represent the highest percentage change detected so far.
If a day's price change matches the highest recorded change, a label appears on the chart to highlight that specific point.
Dynamic Updates:
The script is dynamic, meaning it continually updates as new data comes in. So, as new days are added to the chart, the script checks if the percentage change exceeds the previously highest recorded value.
Why This Is Useful:
For traders and investors: It provides a quick way to identify which day saw the most significant price movement, helping to spot major market events or volatility.
For historical analysis: You can quickly find the most extreme single-day price swings in a stock's historical data, which might be useful for understanding past market behavior or making predictions about future moves.
