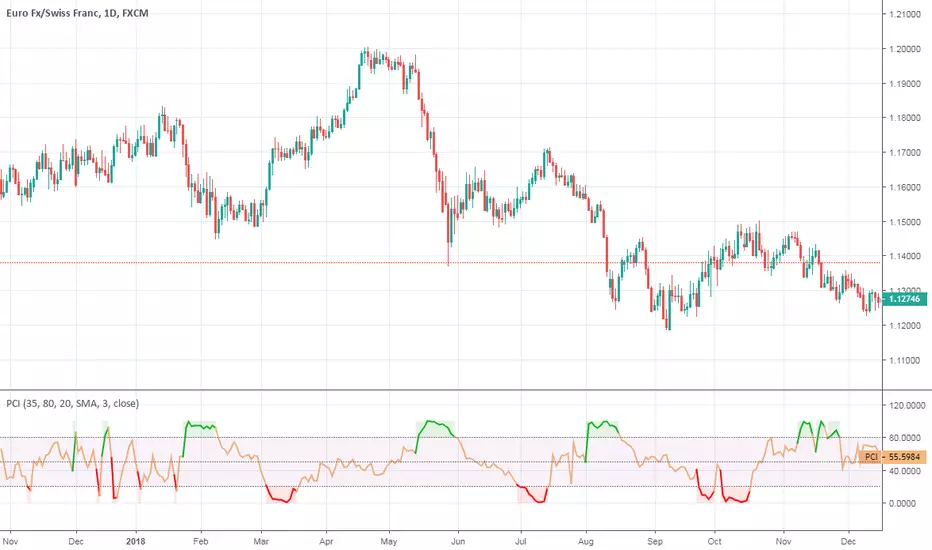
Phase Change IndexPhase Change Index script.
This indicator was developed and described by M. H. Pee (Stocks & Commodities V.22:5 (28-37): Phase Change Index).
Other indicators of M. H. Pee:
Wyszukaj w skryptach "change"
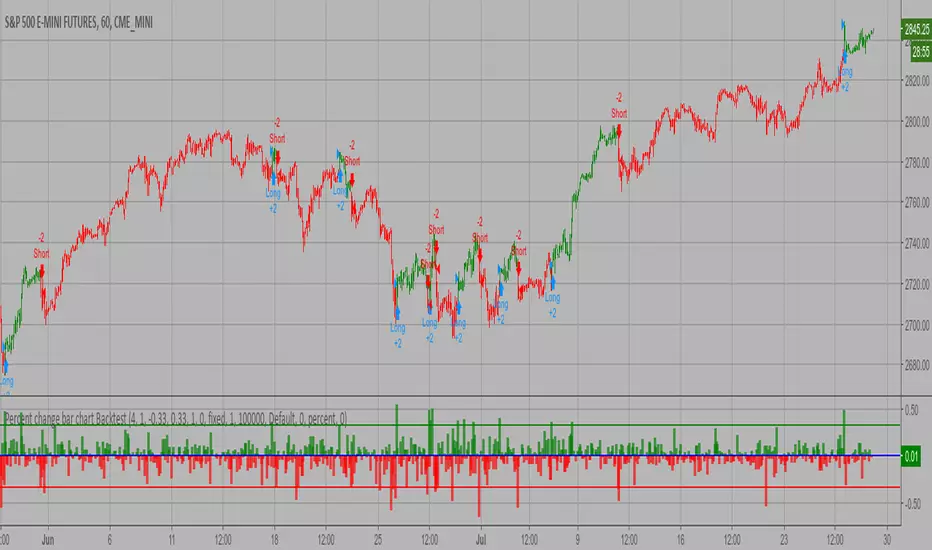
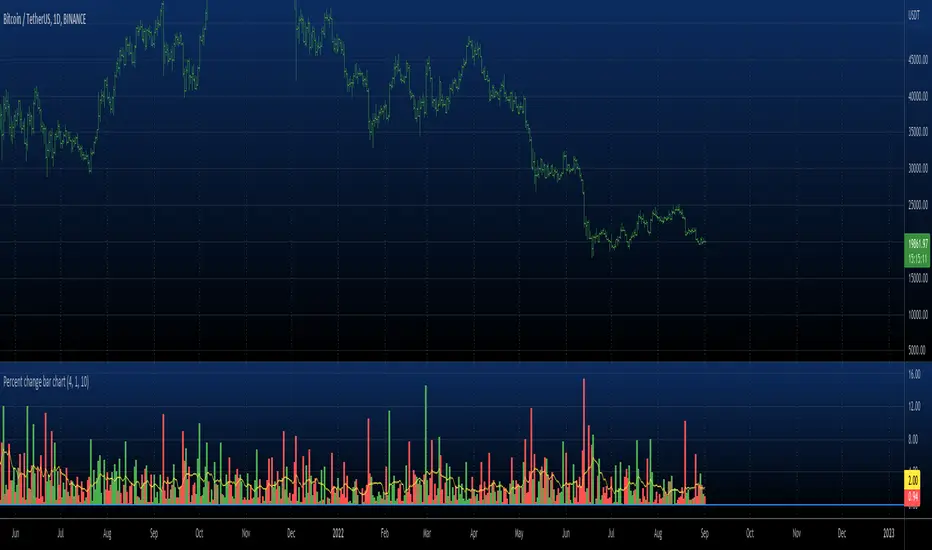
Percent change bar chart Backtest This histogram displays price or % change from previous bar.
You can change long to short in the Input Settings
WARNING:
- For purpose educate only
- This script to change bars colors.
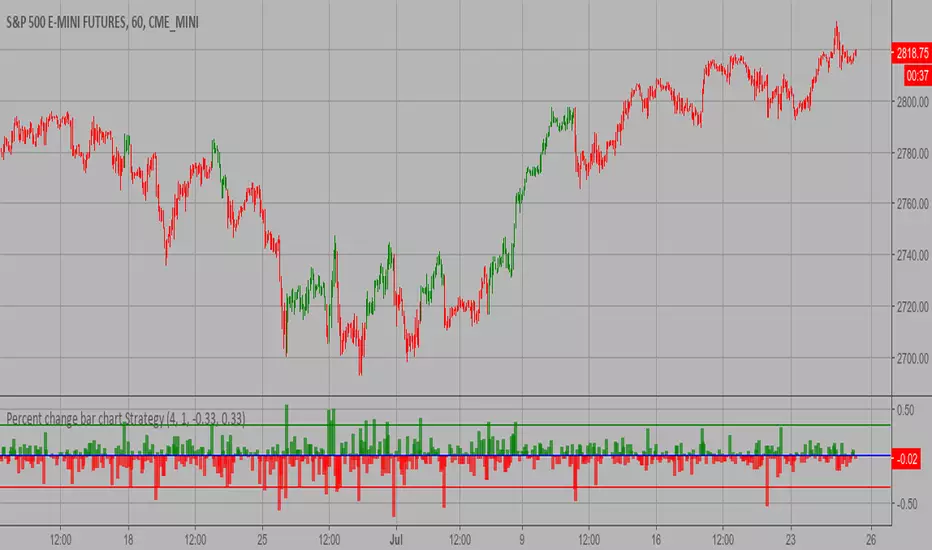
Percent change bar chart Strategy This histogram displays price or % change from previous bar.
WARNING:
- This script to change bars colors.
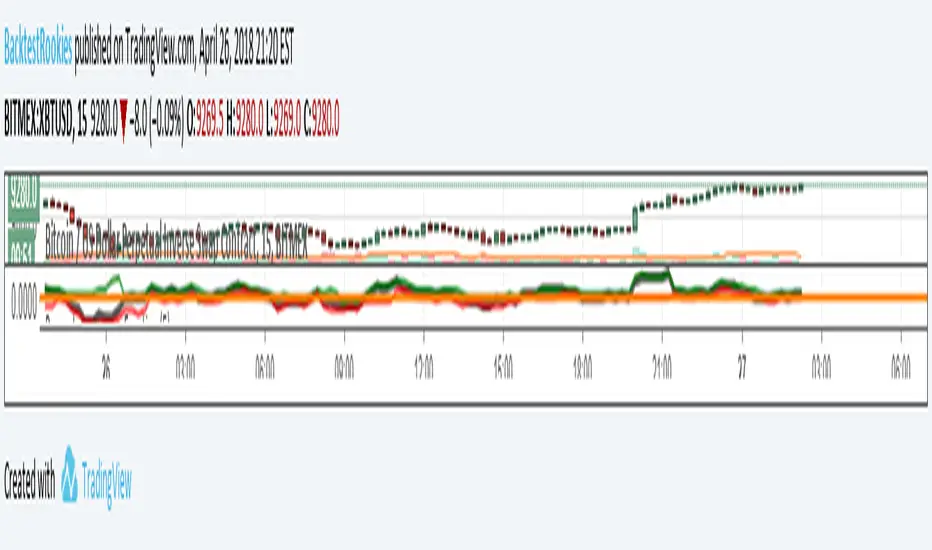
Percentage Change FunctionThis is little code snippet can be copied and pasted into your own strategies and indicators to easily calculate some interesting percentage change levels within a given lookback period.
The function will return:
The price change from the start to the end of the period
The price change from the start of the period to the highest point within the period
The price change from the start of the period to the lowest point within the period
It was originally intended to be used in conjunction with other scripts to assist with decision making. However, it doesn't look too bad as an indicator and so plots have been added.
For more information regarding the code, some commentary and free tutorials, you can visit the Bactest-Rookies (.com) website.
Percent change bar chart Strategy Backtest This histogram displays price or % change from previous bar.
Can be applied to any time frame.
This strategy buy if value above 0 and sell if value below 0.
You can change long to short in the Input Settings
Please, use it only for learning or paper trading. Do not for real trading.

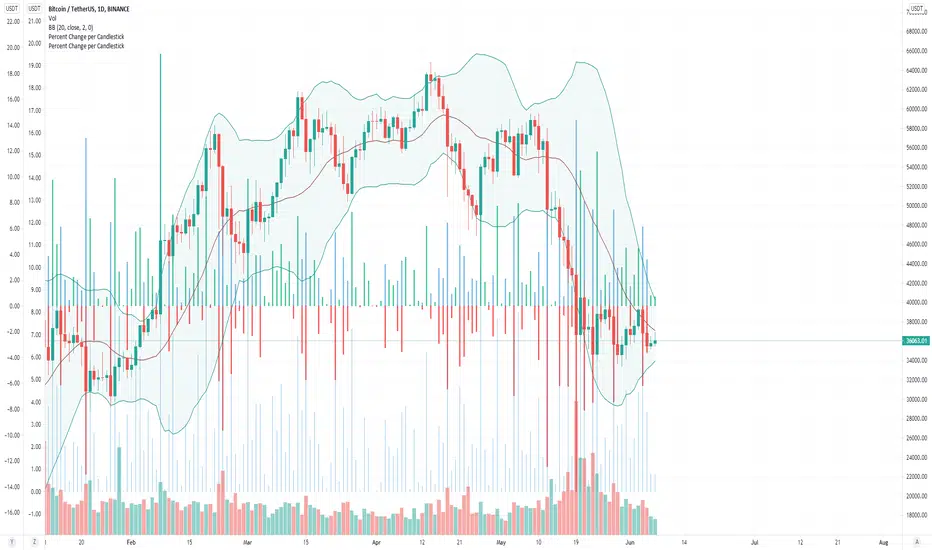
Percent Change per CandlestickThe script has two options: volatility (absolute value of change) and updown which has positive and negatives. That's it. useful for alerts.
Rate Of Change Bands [CC]The Rate Of Change Bands were created by Vitali Apirine (Stocks and Commodities March 2021 pg 14) and this indicator is a great method to not only check the momentum but also check the trend strength as well. I have color coded the lines so buy when the line turns green and sell when it turns red.
Let me know if there are any other indicators you want me to publish!

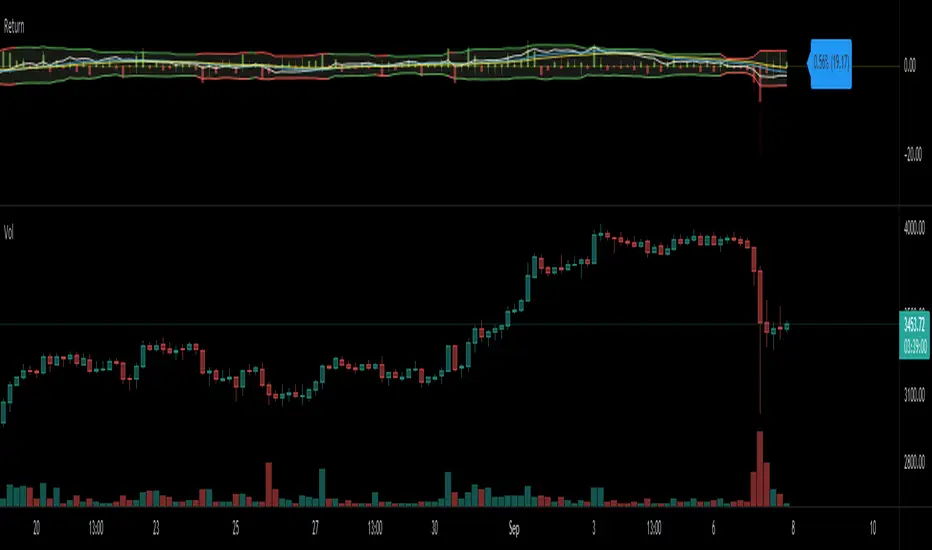
Return (Percent Change)This Script displays Regular or Log Returns as either a line or histogram and labels the current bar.
If something other than price is selected as the source, the result is percent change with a positive or negative slope.
If a moving average of price is used as the source, the result is analogous to a strength index
Other options include a look-back period adjustment (the default is 1),
smoothing results by converting to an EMA, and
Bollinger Bands with Length and Standard Deviation inputs.
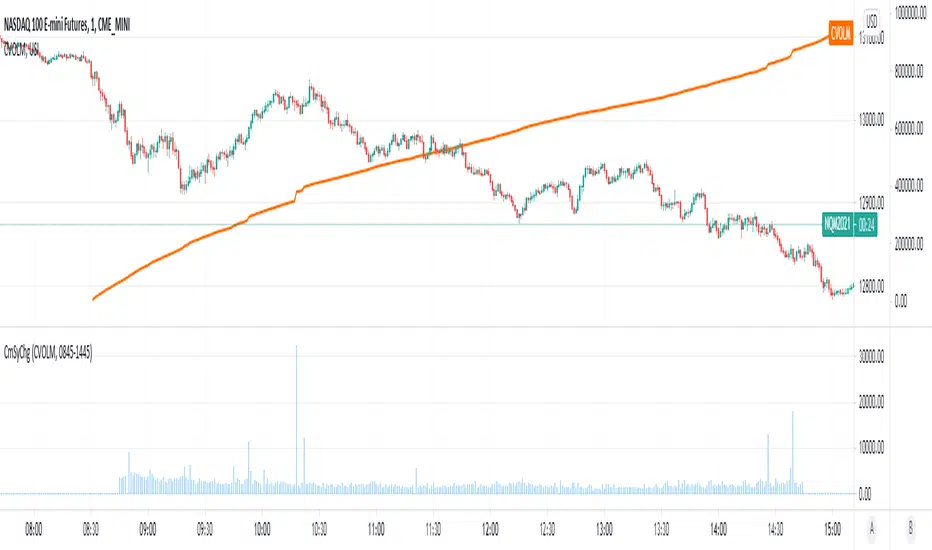
Cumulative Symbol ChangeSome symbols in trading view are cumulative - meaning they increment continuously throughout the trading day and are reset to 0 at the new trading day.
For example USI:CVOLM (Call Volume in Miami).
This script subtracts the current cumulative value from the prior cumulative value, so the change/delta in the cumulative value can be determined bar-by-bar.
COVID-19: Daily changeNew daily infections (daily change) of COVID-19.
The chart shows new daily cases across the entire planet, the US, EU (de+fr+it+es only) and a small country (RO) that does not matter to anybody but me. You can show/hide different country in Settings.
Select "COVID-19: CONFIRMED" data in main chart and add the indicator.

GMS: Percent Change With LengthBasic Percentage Change Over Time. Works on any timeframe.
- Global Market Signals

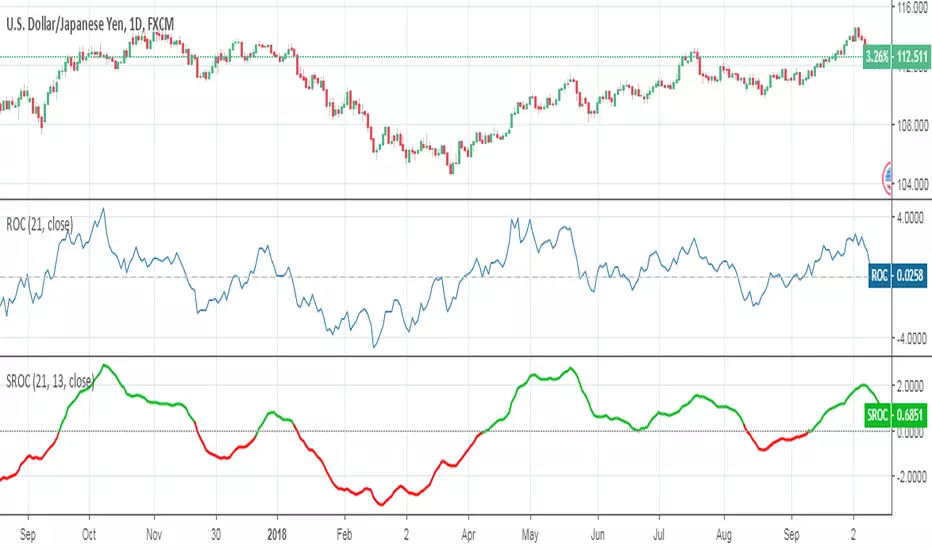
Smoothed Rate of ChangeSmoothed Rate of Change indicator script.
This indicator was originally developed by Fred G. Schutzman.

Percent change bar chart v 3.0 This histogram displays price or % change from previous bar.
Can be applied to any time frame.
06/01/2017
Added look back bars.
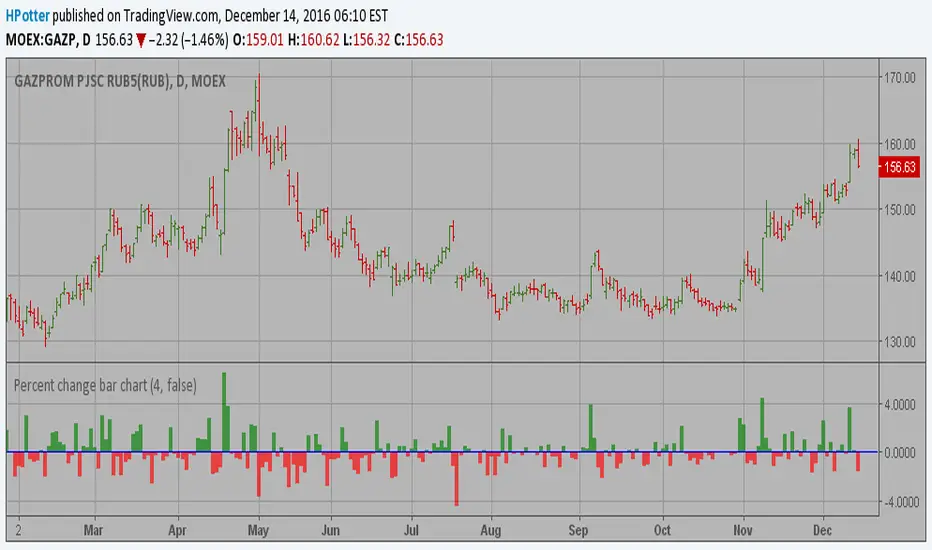
Percent change bar chart This histogram displays price or % change from previous bar.
Can be applied to any time frame.
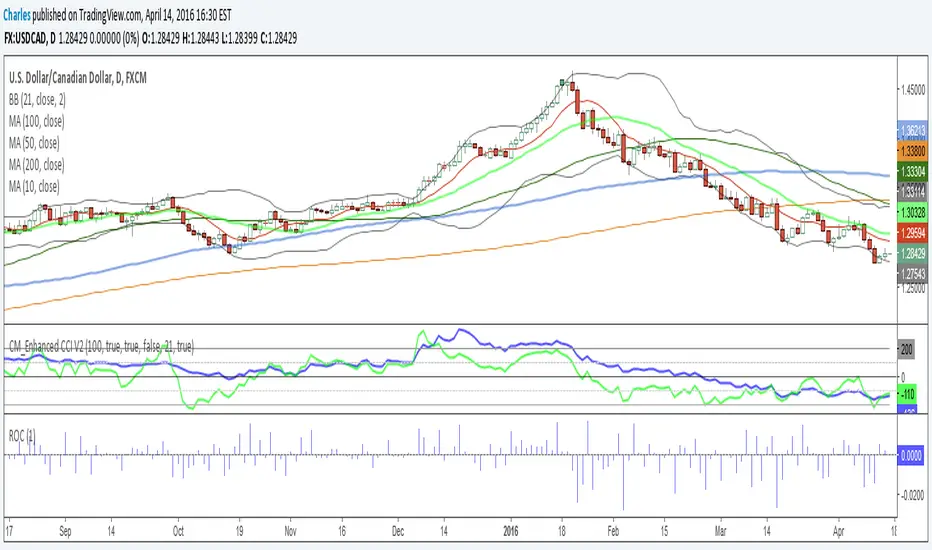
Rate Of Change - Absolute ValueMeasures the period's change in terms of the instrument's value (e.g. pip, dollar, etc) instead of as a percentage. I generally use it on a daily time frame with a period=1 to see how the current day's move compares with prior days' moves in order to gain a perspective into how this move ranks historically.


Changevolume%This indicator give you the volume changes different avreage % between bars . and can show you where the trend is going
1 min graph

Change Analysis and AlertsThe "Change Analysis and Alerts" script in Pine Script allows you to analyze and visualize the percentage change of different values on a chart. It calculates the true change based on the closing prices and provides options to input custom values for comparison. The script also includes an alert feature that triggers when the true change exceeds a specified threshold.
Examples:
Analyzing True Change:
Show the true change between consecutive candle closes as a histogram.
Set a threshold for the true change and receive an alert when it surpasses the specified value.
Comparing Custom Values:
Input custom values to analyze the percentage change between different price levels (e.g., high-low, open-close).
Highlight the value with the highest change in each period.
Visualize the changes as columns on the chart for easy comparison.
By using the "Change Analysis and Alerts" script, traders and analysts can gain insights into the magnitude of price changes and receive alerts when significant changes occur.
Please note that this description and examples are provided for illustrative purposes and can be customized based on your specific needs and preferences.
If you need further assistance, feel free to ask.

Renko WPR Color ChangerChanges color when williams percent R is between 0 and -20 or when between -80 and -100. Works with renko, HA and regular candles. Can change color.

Change in State of Delivery CISD ICT [TradingFinder] Liquidity 1🔵 Introduction
🟣 What is CISD ?
Change in State of Delivery (CISD) is a key concept in technical analysis, similar to Change of Character (ChoCh) and Market Structure Shift (MSS) in the ICT (Inner Circle Trader) and Smart Money trading styles. Like ChoCh and MSS, CISD helps traders identify critical changes in market structure and make timely entries into trades.
To determine the CISD Level, traders typically review the last 1 to 4 candles to identify the first positive or negative candle. The CISD Level is then set using the opening price of the next candle.
In this version of the indicator, support and resistance levels are defined based on liquidity, which includes patterns such as SFP (Swing Failure Pattern), fake breakout, and false breakout.
Bullish CISD :
Bearish CISD :
🔵 How to Use
🟣 Bullish CISD (Change in State of Delivery Upward)
In Bullish CISD, the trend shifts from bearish to bullish after the price hits a liquidity zone, typically indicated by patterns such as SFP, fake breakout, or false breakout.
The steps to identify Bullish CISD are as follow s:
Identify the liquidity zone (SFP, fake breakout).
Review the candles and find the first positive candle.
Set the CISD Level using the opening price of the next candle after the positive candle.
Confirm the change in state of delivery when the price closes above the CISD Level.
Enter the trade after CISD confirmation.
🟣 Bearish CISD (Change in State of Delivery Downward)
In Bearish CISD, the trader looks for a shift from a bullish to a bearish trend. This change typically occurs when the price hits a liquidity level, indicated by patterns such as SFP or false breakout.
The steps to identify Bearish CISD are :
Identify the liquidity zone.
Review the candles and find the first negative candle.
Set the CISD Level using the opening price of the next candle after the negative candle.
Confirm the change in state of delivery when the price closes below the CISD Level.
Enter a short trade after CISD confirmation.
🟣 CISD Compared to ChoCh and MSS (CISD Vs ChoCh/ MSS)
CISD, ChoCh, and MSS are all tools for identifying trend changes in the market, but they have some differences :
CISD: Focuses on a change in the state of delivery and uses liquidity patterns (SFP, fake breakout) and key candles to confirm trend reversals.
ChoCh: Identifies a change in the market’s character, often signaling rapid shifts in trend direction.
MSS: Focuses on changes in market structure and identifies the breaking of key levels as a signal of trend shifts.
🔵 Settings
🟣 CISD Logical settings
Bar Back Check : Determining the return of candles to identify the CISD level.
CISD Level Validity : CISD level validity period based on the number of candles.
🟣 SFP Logical settings
Swing period : You can set the swing detection period.
Max Swing Back Method : It is in two modes "All" and "Custom". If it is in "All" mode, it will check all swings, and if it is in "Custom" mode, it will check the swings to the extent you determine.
Max Swing Back : You can set the number of swings that will go back for checking.
🟣 CISD Display settings
Displaying or not displaying swings and setting the color of labels and lines.
🟣 SFP Display settings
Displaying or not displaying swings and setting the color of labels and lines.
🔵 Conclusion
CISD is a powerful tool for identifying trend reversals using liquidity patterns and key candle analysis. Traders can use the CISD Level to detect trend changes and find optimal entry and exit points.
This concept is similar to ChoCh and MSS but stands out with its focus on confirming trend changes through liquidity and specific patterns. With the right approach, CISD helps traders capitalize on market movements more effectively.

Change Candle Color When 5 EMA Not ConnectedThis custom TradingView indicator changes the color of candlesticks to yellow whenever the 5-period Exponential Moving Average (EMA) is not "connected" to the current candle.
How It Works:
The 5 EMA is calculated based on the closing prices of the last 5 candles.
A candle is considered "not connected" to the EMA if:
The high and low of the current candle are both either above or below the 5 EMA, implying a significant deviation from the EMA.
When this condition is met, the candle color is changed to yellow to highlight this disconnection.
The default behavior of the script is to not display the 5 EMA line, keeping the chart uncluttered while focusing on the candlestick colors.
Usage:
This indicator is useful for scalping or short-term trading strategies, as it helps identify when the price has moved significantly away from the 5 EMA. A yellow candle could signal potential overextension or a possible reversal if the price is far from the EMA. Traders can use this as part of their risk management or entry/exit decision-making process.
Customization:
The indicator doesn't display the 5 EMA line, but you can modify the script to show it if needed by uncommenting the plot(ema5) line.
You can adjust the period of the EMA by modifying the ema5 period in the code, though the default setting is 5 periods.
