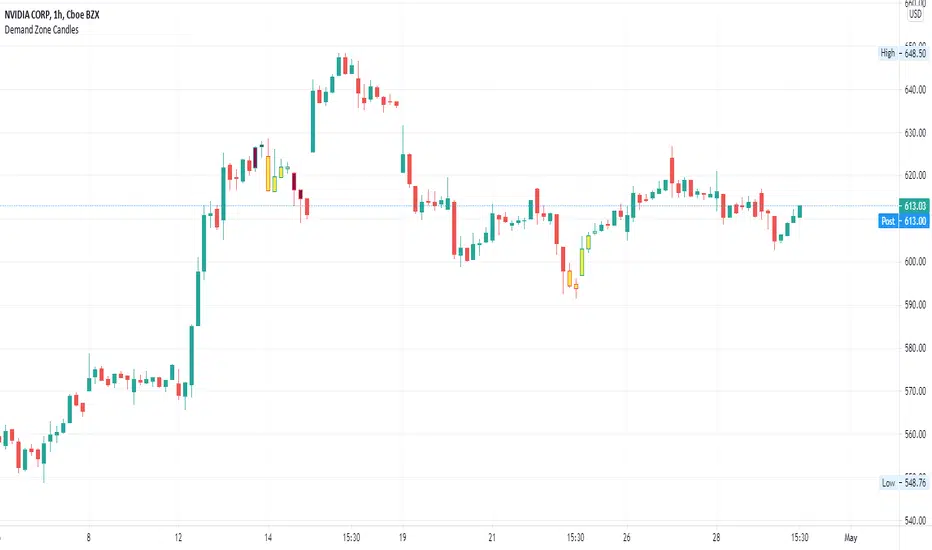
Supply/Demand Zone CandlesThis is a Pine Script to do a basic scan for demand zones and supply zones based on a Leg-Base-Leg-Base pattern.
Yellow candles define a Demand Zone.
Maroon candles define a Supply Zone.
Wyszukaj w skryptach "candle"
High timeframe Highs, Lows, Opens, Closes. HTF Candles displayPosting previously requested indicator.
Overlays higher timeframe high and low over the current bars - pictured is daily high and low overlayed on lower timeframe chart.
Can be set to fill between the open and close to show higher timeframe candles by color, with bullish or bearish fills
Very versatile and can be used to display weekly or monthly opens, or used to display previous weekly highs and lows for charting out possible liquidity points, etc.
Originally converted from Chris Moody's HLOC pine version 2 indicator.

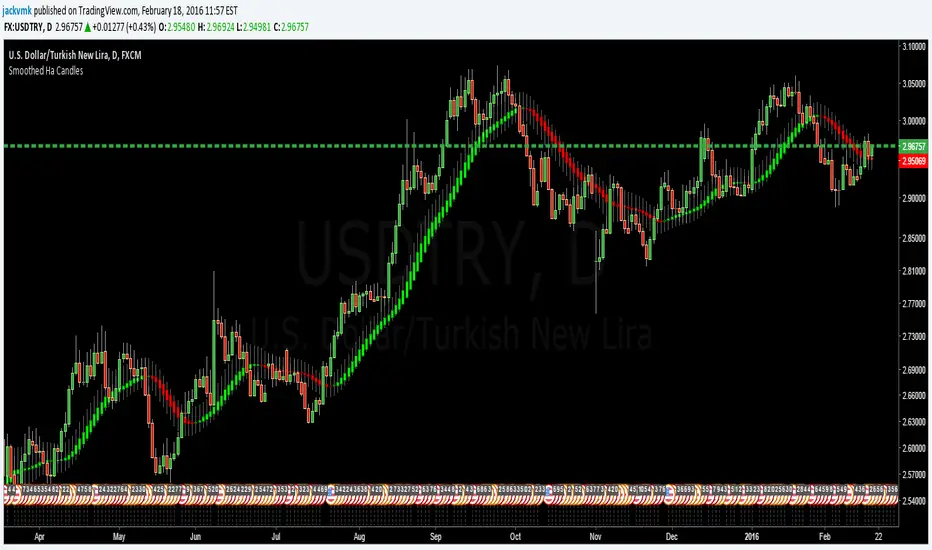
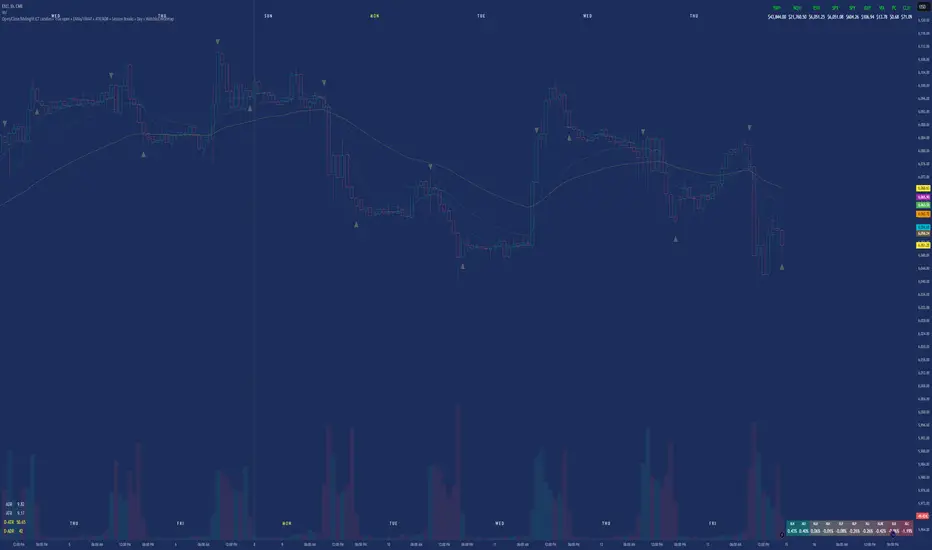
Aggregate CandlesThis script creates candles based on an aggregated Index price from various exchange tickers. A lot of exchanges have specific flash crash wicks, missing data, erraticness compared to other exchanges particularly in their first few months, this is an attempt to clean up the price history, be it for TA ( trendlines , S/R etc.) or use in algos or other indicators, without reliance on one exchange. It uses the new Array functionality to generate median and averages, and is entirely original work. This particular version is a generic version of the BTC version. Please read the header before use, and if you do wish to use the code, please ask permission first.

Pin Bar CandlesPin Bar Candles can be used for identifying reversal points with the help of support and resistance

No Shadow Candles - Alertsalert script to detect candles with no wick, for testing.
scripted on request.

Live Candle Range Position SizerThis script displays a fixed execution HUD on the chart that continuously measures the current candle range (high–low) and automatically calculates position size based on a fixed Risk Unit (RU).


8 AM (UTC-5) 1-Hour Candle High/Low Box This indicator creates a box for the 8 am (UTC-5) 1-hour candle and will delete on the chart once both the high and low is swept. When one side is swept, the box will turn orange.


Harris Triple Impulse Candle Detector Triple impulse candle detector system. Indicator uses size multiplier, volume multiplier and body to mick ratio, to calculate the size of its impulse

First Historical Candle Date daily intervalIndicator that displays a first historical candle on daily interval as a table at a top-right corner

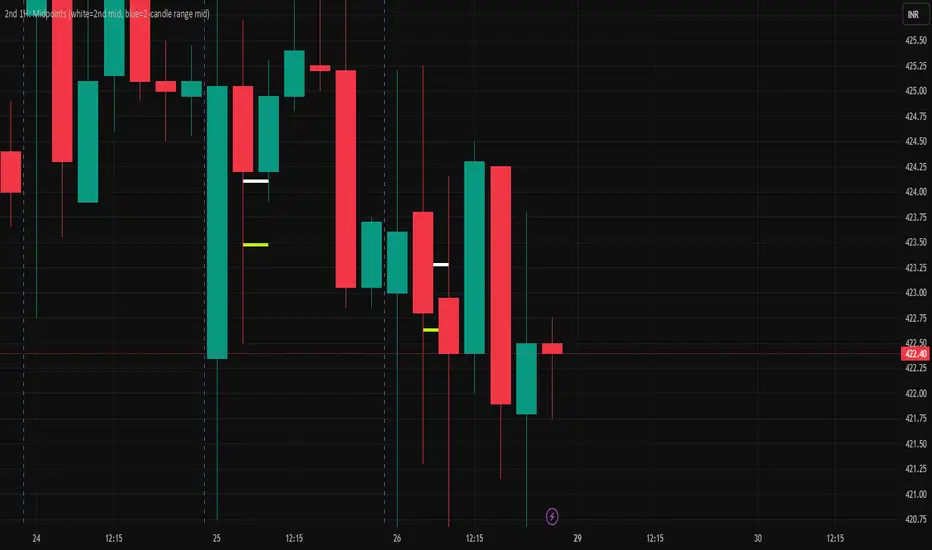
2nd 1H: Midpoints (white=2nd mid, blue=2-candle range mid)2nd 1H: Midpoints (white=2nd mid, blue=2-candle range mid)
5 AM NY 4H Candle High/LowThis indicator identifies the 4-hour candle that starts at 5:00 AM New York time (NYT) and automatically plots its high and low on intraday charts (e.g., 15m, 30m, 1H).
It helps traders:
Highlight a key session window often associated with increased market activity.
Use the 5AM–9AM NYT range for breakout, reversal, or liquidity zone strategies.
See clean horizontal levels that can act as support or resistance throughout the trading day.
🧠 Key Features:
Works on any timeframe below 4H.
Automatically detects and updates daily.
Optional labels to mark the range visually.

First and Last Candle HighlightSimple indicator that colors the 8:30 am Morning open candle, 3pm close candle and overnight 12:00am candle for ES as a quick reference for ICT strategies or any other strategies that provide added confluence to your style of trading. the time is set to UTC -5 for chicago time but im sure it will auto adjust for any other time zone if not message me and i will leave the script open for you to edit to your liking
Vertical Line at nth Previous CandleThis code is a Pine script for TradingView that plots a vertical line on the chart n bars away from the current candle on the current time frame. The number of bars and line color can be customized by the user using input fields. The script calculates the highest and lowest price on the chart for the past n bars, and then draws a vertical line at the target bar with the specified line color. The previous line is removed and the ID of the new line is stored so that the next time the script is run, it can be removed and replaced with a new line. This script can be useful for marking important points on a chart or for visually tracking patterns or trends over time.

Sagar sir - N Continuous candle green with +ve % changeThis script will plot labels based on N number of continuous green candle with +ve % change.

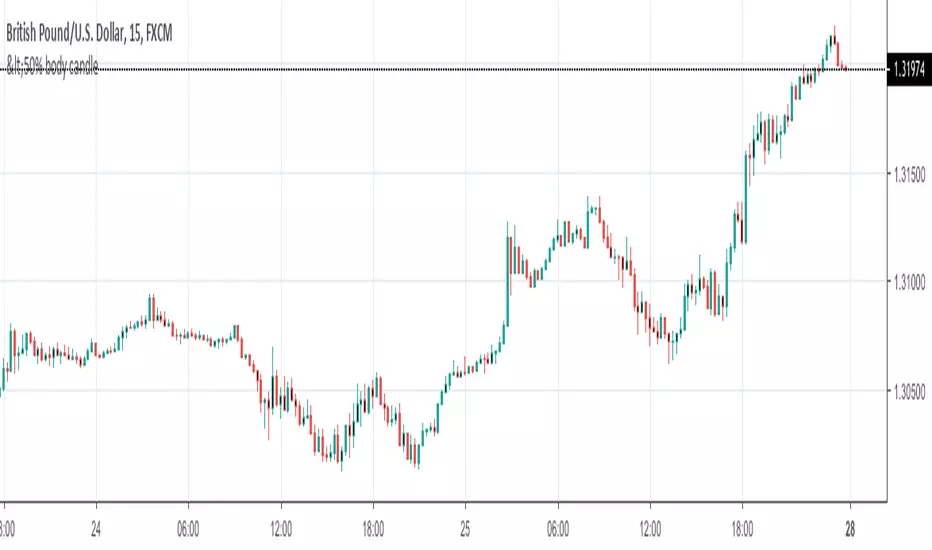
<50% body candleThis Script shows the candle whose body is less than the full candle and is shown in black color
Small candle/Stop Gap indicator MHThis script has a different setting for the stop gap vs the candle size
*All Candlestick Patterns* Tiny VersionThis is just the *All Candlestick Patterns* script with tiny labels. Also an excuse to test the script publication .. but you will find this version much less annoying
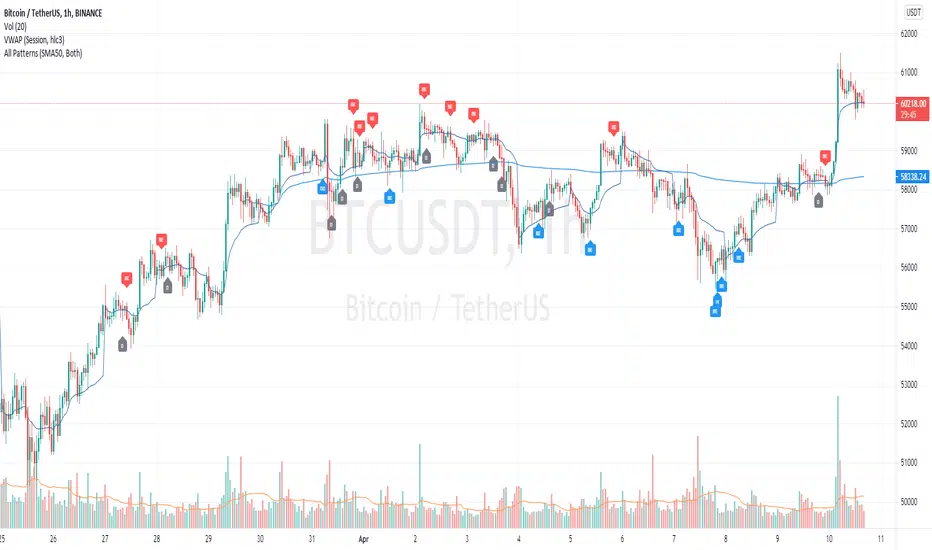
All Candlestick Patterns StrategyThis strategy uses the tradingview built in candlestick recognition.

Identificador de Candlestick PT-br (updated 27/05/19) -whande1Identificador de Candlestick PT-br (updated 27/05/19) -whande1