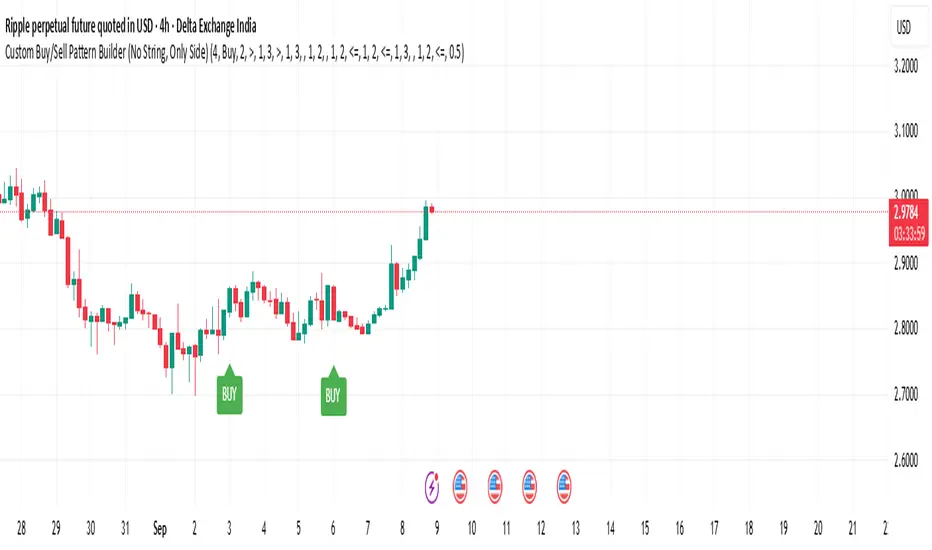
Custom Buy/Sell Pattern BuilderAre you tired of using trading indicators that only let you follow fixed, pre-designed rules? Do you wish you could build your own “Buy” or “Sell” signals, experiment with your own ideas, or see instantly if your unique pattern works—without learning coding or hiring a developer?
The Custom Buy/Sell Pattern Builder is designed for YOU.
This TradingView indicator lets ANY trader—even a complete beginner—define exactly what kind of price and volume conditions should create a BUY or SELL label on any chart, in any market, at any timeframe.
You don’t need to know programming. You don’t need to know the definition of a hammer, doji, volume spike, or Engulfing pattern.
With a few clicks and easy dropdown choices, you can:
Make your own rules for buying or selling
Choose how many candles your pattern should look at
Decide if you want the biggest body, the lowest volume, the biggest movement, or any combination you can imagine
The result?
You’ll see clear “BUY” or “SELL” labels automatically show up on your chart whenever the exact rule YOU built matches current price action.
No more guessing. No more forced strategies. Just pure control and visual feedback!
Why Is This Powerful?
Traditional indicators (like MACD, RSI, or even classic candlestick scanners) work the same for everyone—and only as their inventors defined.
But every trader, and every market, is unique.
What if you could say:
“Show me a ‘SELL’ every time the newest candle is bigger than the one before, but with LESS volume, while the bar before that had an even smaller body—but more volume than all others?”
With this tool, it’s EASY!
You simply pick which candle you want to compare (most recent, previous, etc), what to compare (body or volume—body means the candle’s “thickness”, from open to close), choose “greater than”, “less than”, or “equal to”, and set a multiplier if you want (like “half as much”, “twice as big”, etc).
After this, if any bar on the chart fits all your rules, it will mark it as a BUY or SELL, depending on your selection.
This means—
Beginners can start experimenting with their intuition or small ideas, without tech hurdles
Experienced traders can visualize and fine-tune any possible logic, before they commit to backtesting or automating a real strategy
Every “what if” or “I wonder” setup is just 2–3 clicks away
How Does It Work? Simple Steps
1. Choose Your Signal Type
“Buy” or “Sell”
This tells the indicator whether to mark the qualifying bars with a green “BUY” or red “SELL” label
2. Pick How Many Candles To Use
“Pattern Candle Count” input (2, 3, or 4)
Example: If you use 4, the pattern will be applied to the most recent 4 candles at every step
3. Define Your Pattern With Inputs
For each candle (from newest “0” to oldest “3”), you can set:
Body Condition (example: “is this candle’s body bigger/smaller/equal to another?”)
Pick which candle to compare against
Pick “>”, “<”, “>=”, “<=”, or “=”
Set a multiplier if needed (like “0.5” to mean “half as big as” or “2” for “twice as big as”)
Volume Condition (exact same choices, but based on trading volume—not the candle’s price body)
For example:
“Candle0 Body > Candle2 Body”
means “the latest candle’s real-body (open–close) is bigger than the one two bars ago.”
“Candle1 Volume <= Candle2 Volume”
means “the previous candle’s volume is less than or equal to the volume of the bar two periods ago.”
You can leave a comparison blank if you don’t want to use it for a particular candle.
What Happens After You Set Your Rules?
Every bar on your chart is checked for your logic:
If ALL body AND volume conditions are true (for each candle you specified),
AND
The signal side (“Buy” or “Sell”) matches your dropdown,
Then a green “BUY” or red “SELL” label will show right on the bar, so you can visually spot exactly where your logic works!
Practical Example:
Suppose you want an entry setup that is:
“Sell whenever the newest candle’s body is bigger than two bars ago, body before that is bigger than three bars ago, AND the newest candle’s volume is less than or equal to two bars ago, AND the candle three bars ago’s volume is less than or equal to half the candle two bars ago’s volume.”
You’d set:
Pattern Candle Count: 4
Side: Sell
Candle0 Body Ref#: 2, Op: >, Mult: 1
Candle1 Body Ref#: 3, Op: >, Mult: 1
Candle0 Vol Ref#: 2, Op: <=, Mult: 1
Candle3 Vol Ref#: 2, Op: <=, Mult: 0.5
And the script will find all “SELL” bars on your chart matching these conditions.
Inputs Section: What Does Each Setting Do?
Let’s break down each input in the indicator’s Settings one by one, so even if you’re new, you’ll understand exactly how to use it!
1. Pattern Candle Count (2–4)
What is it?
This sets how many candles in a row you want your rule to look at.
Example:
“4” means your rules are based on the most recent candle and the 3 before it.
“2” means you are only comparing the current and previous candles.
Tip:
Beginners often use 4 to spot stronger patterns, but you can experiment!
2. Signal Side
What is it?
Choose “Buy” or “Sell”. The word you pick here decides which colored label (green for Buy, red for Sell) appears if your pattern matches.
Example:
Want to spot where “Sell” is likely? Pick “Sell”.
Change to “Buy” if you want bullish signals instead.
3. Body & Volume Comparison Settings (per Candle)
For each candle (#0 is newest/current, #3 is oldest in your pattern window):
Body Comparison
Candle# Body Ref#
Choose which other candle you want to compare this one’s body to.
“0” = newest, “1” = previous, “2” = two bars ago, “3” = three bars ago
Candle# Body Op (Operator; >, <, >=, <=, =)
How do you want to compare?
“>” means “greater than” (is bigger than)
“<” means “less than” (is smaller than)
“=” means “equal to”
Candle# Body Mult (Multiplier)
If you want relative comparisons. For example, with Mult=1:
“Candle0 body > Candle2 body x 1” means just “0 is larger than 2.”
“Candle0 body > Candle2 body x 2” means “0 is more than double 2.”
Volume Comparison
Candle# Vol Ref# / Op / Mult
Exact same logic as body, but works on the “Volume” of each candle (how much was traded during that bar).
How to Set Up a Rule (Step by Step Example)
Say you want to mark a Sell every time:
The most recent candle’s real body is BIGGER than the candle 2 bars ago;
The previous candle’s body is also BIGGER than the candle 3 bars ago;
The current candle’s volume is LESS than or equal to the volume of candle 2;
The previous candle’s volume is LESS than or equal to candle 2’s volume;
The candle 3 bars ago’s volume is LESS than or equal to HALF candle 2’s volume.
You’d set:
Pattern Candle Count: 4
Side: "Sell"
Candle0 Body Ref#: 2, Op: “>”, Mult: 1
Candle1 Body Ref#: 3, Op: “>”, Mult: 1
Candle0 Vol Ref#: 2, Op: “<=”, Mult: 1
Candle1 Vol Ref#: 2, Op: “<=”, Mult: 1
Candle3 Vol Ref#: 2, Op: “<=”, Mult: 0.5
All other comparisons (operators) can be left blank if you don’t want to use them!
When these rules are met, a bright red “SELL” label will appear right above the bar matching all your conditions.
Practical Tips & FAQ for Beginners
What does “body” mean?
It’s the “true range” of the candle: the difference between open and close. This ignores wicks for simple setups.
What does “volume” mean?
This is the total trading activity during that candle/bar. Many traders believe that patterns with different volume “meaning” (such as low-volume up bars, or high-volume down bars) signal a meaningful change.
What if nothing shows on chart?
It just means your current rules are rarely or never matched! Try making your comparisons simpler (maybe just 2-body and 2-volume conditions to start).
You can always hit “Reset Settings” to go back to default.
Can I use this for both buying and selling?
YES! You can detect both bullish (Buy) and bearish (Sell) custom conditions; just switch “Signal Side.”
Do I need to know coding?
Not at all! Everything is in simple input panels.
Creative Use Cases, Example Recipes & Troubleshooting
Creative Ways to Use
Spotting Reversals
Example:
Buy when: the newest candle body is LARGER than the previous 3 bars, but ALL volumes are lower than their neighbors.
Why? Sometimes, a big candle with surprisingly low volume after a sequence of small bars can signal a reversal.
Finding Exhaustion Moves
Example:
Sell when: the current bar body is twice as big as two bars ago, but volume is half.
Why? A very big candle with very little volume compared to similar bars may show the move is “running out of steam.”
Custom “Breakout + Confirmation” Patterns
Example:
Buy when:
Candle 0’s body is greater than Candle 2’s by at least 1.5x,
Candle 0’s volume is greater than Candle 1 and Candle 2,
Candle 1’s volume is less than Candle 0.
Why? This could catch strong breakouts but filter out noisy moves.
Multi-bar Bias/Squeeze Filter
Use “Pattern Candle Count: 4”
Set all 4 volume conditions to “<” and each reference to the previous candle.
Now, a BUY or SELL only marks when each bar is “dryer”/less active than the last — a classic squeeze or low-volatility buildup.
Troubleshooting Guide
“I don’t see any Buy/Sell label; is something broken?”
Most likely, your rules are too strict or rare! Try using only two comparisons and leave other “Op” inputs blank as a test.
Double-check you have enough candles on the chart: you need at least as many bars as your pattern count.
“Why does a label appear but not where I expect?”
Remember, the script checks your rules for every NEW candle. The candle “0” is always the most recent, then “1” is one bar back, etc.
Check the color and type chosen: “Signal Side” must be “Buy” for green, “Sell” for red.
“What if I want a more complex pattern?”
Stack conditions! You can demand the body/volume of each candle in your window meet a different rule or all follow the same rule in sequence.
Mini Glossary — For Newcomers
Candle/Bar: Each bar on the chart, shows price movement during a fixed time (e.g., one minute, one hour, one day).
Body: The colored (or filled) part of the candle — the open-to-close price range.
Volume: How much of the asset was actually traded that candle/bar.
Reference Index: When you pick “2” as a reference, it means “the candle two bars ago in the pattern window.”
Operator (“Op”): The math symbol used to compare (>, <, =, etc).
Signal Side: Whether you want to highlight bullish (“Buy”) or bearish (“Sell”) bars.
Tips for Getting More Value
Start Simple—try just one or two conditions at first. See what lights up. Slowly add more logic as you get comfortable.
Watch the chart live as you change settings. The labels update instantly—this makes strategy design fast and visual!
Try flipping your ideas: If a certain pattern doesn’t work for buys, try reversing the direction for possible “sell” setups.
Remember: There is NO wrong idea. This indicator is only limited by your creativity—it’s a “strategy playground.”
Example Quick-Start Recipes
Classic Sell:
4 candles, side = Sell
Candle0 Body > Candle2; Candle1 Body > Candle3
Candle0 Vol <= Candle2; Candle1 Vol <= Candle2; Candle3 Vol <= Candle2 × 0.5
Simple Buy After Pause:
3 candles, side = Buy
Candle0 Body > Candle1; Candle0 Vol > Candle1
All other Ops blank
Low-Volume Pullback for Entry:
4 candles, side = Buy
Candle0 Body > Candle2
Candle0 Vol < Candle1; Candle1 Vol < Candle2; Candle2 Vol < Candle3
Final Words
Think of this as your “pattern lab.” No code, no guesswork—just experiment, see what the market actually gives, and design your own visual rulebook.
If you’re stuck, reset the script to defaults—it’s always safe to start again!
If you want more ready-made “recipes” for different strategies/styles, just ask and I’ll send some more setups for you.
Happy building—and may your edge always be YOUR edge!
Wyszukaj w skryptach "buy sell"
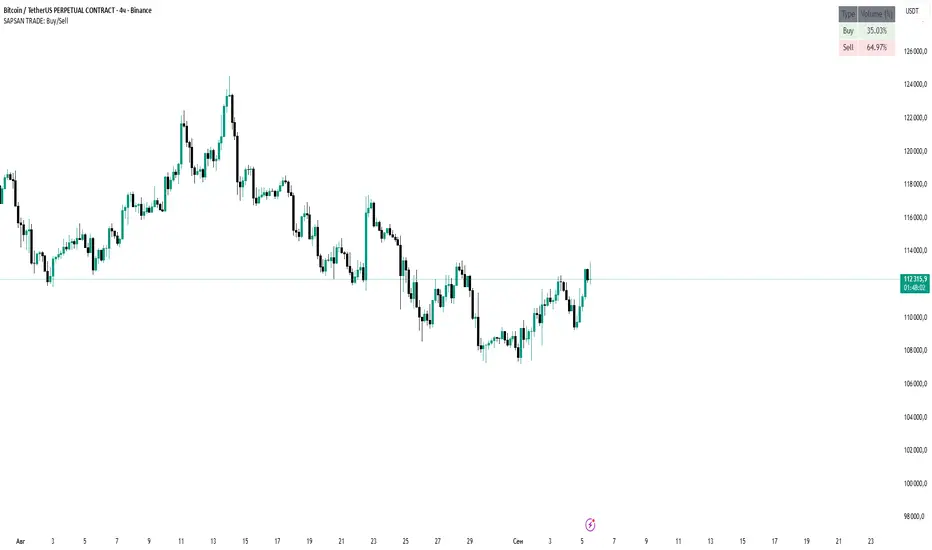
SAPSAN TRADE: Buy/SellSAPSAN TRADE: Buy/Sell Volume Indicator
Description:
The SAPSAN TRADE Buy/Sell indicator helps traders analyze buying and selling activity within a selected time range. It calculates cumulative buy and sell volumes based on candlestick direction and displays the results as percentages in a clear, easy-to-read table.
Features:
Time Range Selection: Specify the start and end time for volume analysis.
Buy/Sell Volume Calculation: Automatically sums buy (bullish) and sell (bearish) volumes.
Percentage Display: Shows the proportion of buy vs. sell volume in a table on the chart.
Visual Clarity: Color-coded cells—green for buys, red for sells—for quick assessment.
Use Case:
Ideal for crypto traders and intraday traders who want to track market sentiment and identify periods of dominant buying or selling pressure.
Instructions:
Add the indicator to your chart.
Set the desired time range using the inputs.
Monitor the table to see the percentage of buy and sell volumes within the specified range.
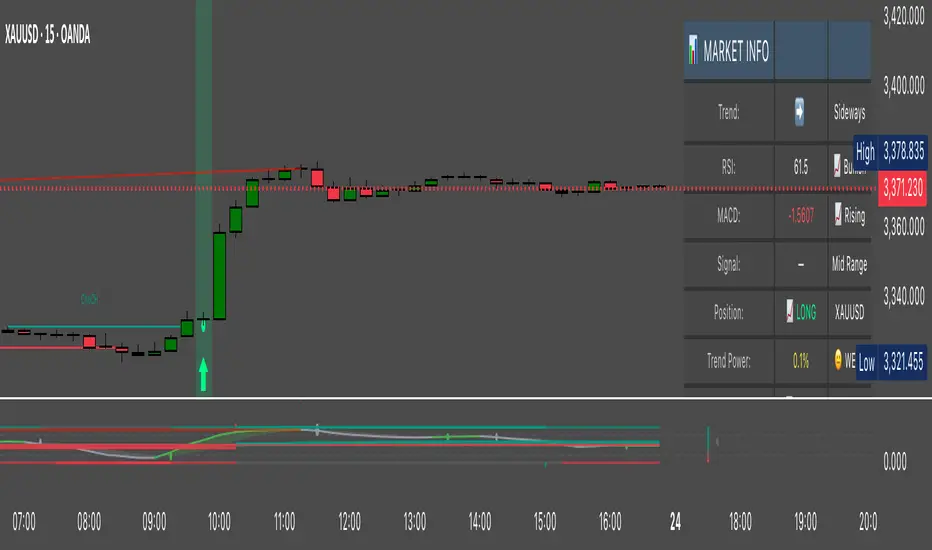
Hassi XAUUSD 15TF BUY/SELL (Anchored, Non-Repainting)What this does
Hassi XAUUSD 15TF BUY/SELL is a non-repainting signal indicator designed for XAUUSD (Gold) on the 15-minute timeframe (also works on BTCUSD). It blends EMA crossover + RSI + MACD with optional volume & volatility filters, and prints anchored BUY/SELL arrows that stay glued to their candle (no visual drifting on zoom/scale/replay). Optional confidence% labels help you judge signal quality at a glance.
Why it’s stable (no repaint)
Signals confirm only on bar close (barstate.isconfirmed).
Arrows/X marks are placed with label.new(x=bar_index, y=high/low, xloc.bar_index, yloc.abovebar/belowbar) so they remain exactly above/below the triggering candle.
No request.security for higher-TF lookaheads; no negative offsets.
How signals are generated
Core trigger: EMA(9) crosses EMA(21)
RSI filter (opt): RSI ≥ RSI Buy Min (default 50) for buys; ≤ RSI Sell Max (default 50) for sells
MACD filter (opt): MACD line crosses its signal or histogram sign matches direction
Volume/ATR filters (opt): require a basic volume spike and above-average ATR volatility (toggleable)
Divergence (opt): lightweight RSI divergence hints (diamond marks)
Anchored markers
BUY: triangle below the signal candle
SELL: triangle above the signal candle
EXIT (❌): small x above (long exit) / below (short exit) when the opposite signal confirms
Nudges: fine-tune vertical placement with tick offsets (inputs) without breaking anchoring
Inputs (defaults)
Fast EMA: 9
Slow EMA: 21
RSI Length: 14
MACD Fast/Slow/Signal: 12 / 26 / 9
Require RSI filter (50 line): ✅
Require MACD cross filter: ✅
RSI Buy Min / RSI Sell Max: 50 / 50
Buy/Sell/Exit Offset (ticks): 0 / 0 / 0
Advanced toggles: Trend Strength ✅, Dynamic Sizing (visual) ✅, Volume Filter ⛔, Volatility Filter ⛔, RSI Divergence ⛔, Show Confidence ✅
Status line/table: ✅
Alerts
Add any of these in Add Alert → Condition: this indicator
Buy Signal → {{ticker}} BUY @ {{close}} - ANCHORED SIGNAL
Sell Signal → {{ticker}} SELL @ {{close}} - ANCHORED SIGNAL
Exit Mark → {{ticker}} EXIT @ {{close}} - ANCHORED EXIT
Recommended use (15-minute XAUUSD)
Use during active sessions (London/NY overlaps).
Keep defaults; enable Volume & Volatility filters in high-noise conditions.
Add confluence (S/R, structure/BOS, session highs/lows, FVG or HTF bias).
Manage risk with structure-based SL or ATR x 1.0–1.5, and partial TP at 1:1–1.5R.
Note: You mentioned it has ~80% win rate on 15TF in your testing. Performance varies by broker feed, session, spread, and risk management. Treat results as educational, not a guarantee.
Non-repainting notes
Signals lock on close; historical arrows are final.
Labels are bar/price anchored (no drift when you zoom or change scale).
Arrays trim old labels automatically to avoid drawing limits.
FAQ
Q: Why don’t past arrows move when I resize the chart?
A: They’re label.new() anchored to bar_index and bar high/low with xloc/yloc, so they stay with the candle.
Q: Can I turn it into a strategy/backtest?
A: Yes—wrap the same signals into strategy.entry/exit, but this release is an indicator by design.
Q: Will it work on BTC or other pairs/timeframes?
A: Yes, but it’s tuned for XAUUSD M15. Adapt filters for other markets.
Changelog
v1.0 — Initial public release: anchored non-repainting arrows, optional RSI/MACD filters, volume/ATR filter, divergence hints, confidence labels, status panel, alerts.
Disclaimer
This tool is for education and analysis only. It is not financial advice. Trading involves risk; do your own research and manage risk responsibly.
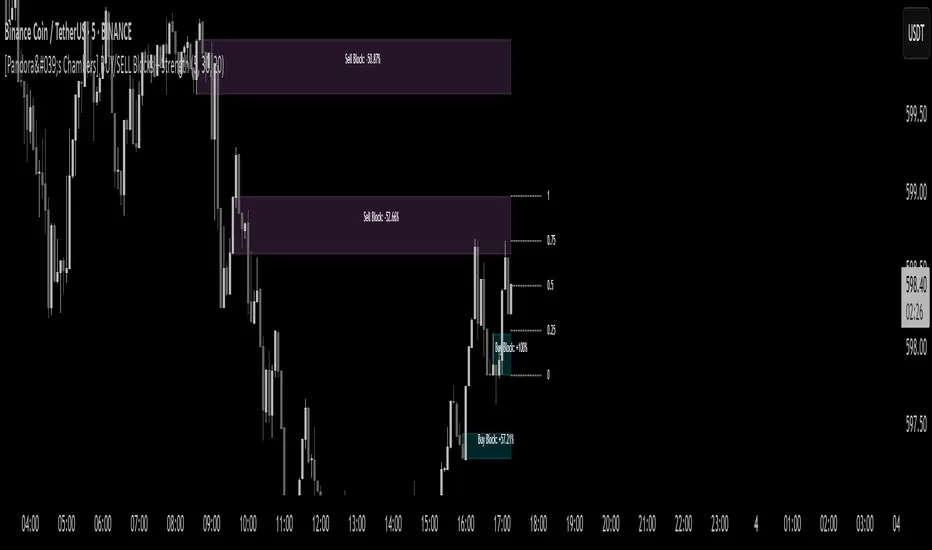
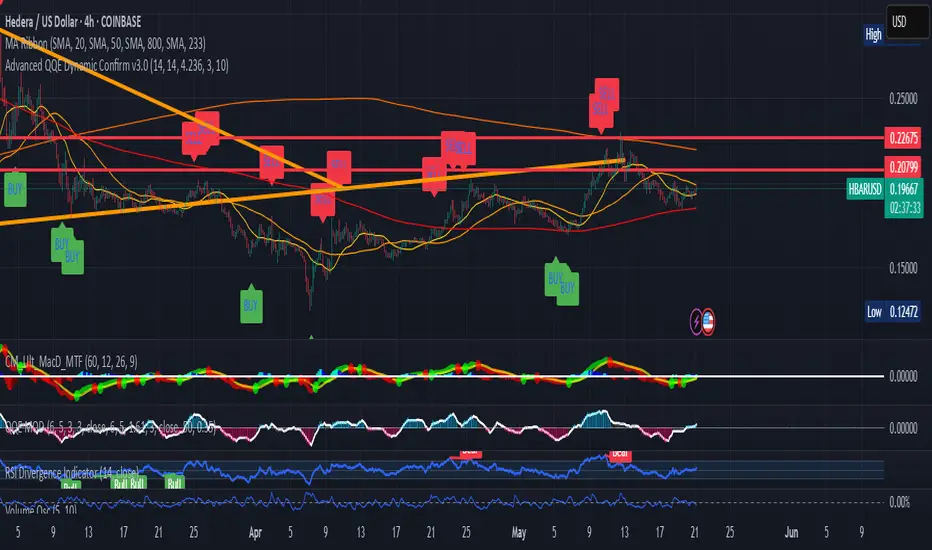
[Pandora's Chambers] BUY/SELL Blocks + Strength FCBased on the secret technique of ATTA,
Traditional price action analysis techniques, such as ICT (Inner Circle Trader), are often based on subjective interpretations and frequently miss the true structure of the market according to the Wyckoff method. The " BUY/SELL Blocks + Strength FC" indicator aims to correct this problem by automatically and accurately identifying buy/sell "blocks" according to Wyckoff principles, calculating volume strength, filtering breached blocks, and displaying precise support and resistance levels.
Indicator Highlights
Buy/Sell Blocks Identification
Uses the ta.pivothigh and ta.pivotlow functions to locate upper and lower pivot points, and draws a "box" between the two points to represent the block.
Each block is automatically extended to the right of the chart (can be disabled in settings) for a fixed number of bars or until the end of the chart.
Colors are configurable: turquoise shades for buy blocks, and purple for sell blocks.
Volume Strength Calculation and Update
In each candle, positive volume (in a rising market) or negative volume (in a falling market) is added to the relevant block.
Displays in percentages which side (buyers/sellers) controls the block: a label on the block shows +XX% or -XX%.
Changes the background color of the box to gray when the net volume flips (e.g., a strong sell block receives a net positive).
Filtering Breached Blocks
Option to automatically filter and remove blocks where the price has closed above the top of the sell block or below the bottom of the buy block, in order to maintain a clean and focused chart.
"Adjusted" Fibonacci Grid
In the last calculated bars, the indicator identifies the nearest high support level (sup) and the nearest low resistance level (res) among all existing blocks.
Based on sup and res, a Fibonacci grid of 0%, 25%, 50%, 75%, and 100% is constructed, automatically updating as the chart progresses.
What is so new here?
Accuracy according to Wyckoff and not personal interpretation: In the Wyckoff method, market oscillations are built on supply and demand balances in precise price gaps. Here, each block is built directly on pivots from a number of bars back, and not on feelings of an "area" as is sometimes done in ICT techniques.
Quantitative measurement of control: The indicator does not settle for a visual identification of a block but calculates for each block the buy volume versus the sell volume, and clearly displays who is in control.
Automatic filtering to maintain relevance: Breached blocks are removed, so only the strong areas that have not yet been closed remain.
Full integration with modern price action: Understanding price movement is measured here objectively, leaving no room for subjective interpretations of "structure breaks" or "diagonal waves" that standard tools do not support.
Why is the existing price action not enough?
Inconsistency in defining supply and demand zones: Many techniques rely on manual marking of "buy zones" only, without fixed criteria (number of bars back, low highs, volume, etc.).
Scarcity of quantitative indicators: Without calculating net volume, it is difficult to know if a particular block is truly supported by the power of buyers or sellers.
Net invalidation of blocks that have been violated: Repeated breaches of support and resistance areas below/above their boundaries confuse the trader, while here they are automatically removed.
The " BUY/SELL Blocks + Strength FC" indicator comes to correct all these shortcomings, and provides the user with an objective, accurate, and quantitative framework for understanding the dynamics of the market and identifying volume-based support and resistance areas, according to the principles of the Wyckoff method.
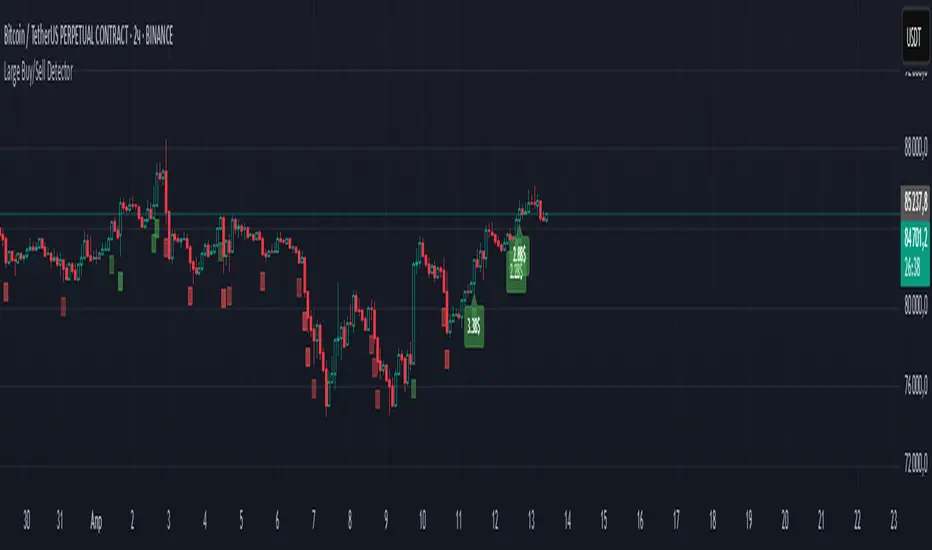
Large Buy/Sell DetectorLarge Buy/Sell Detector
Overview
The Large Buy/Sell Detector is an indicator that uncovers significant buying and selling activity in the markets. Designed to spot unusually large volume spikes, it highlights potential opportunities with customizable filters and visual cues. While not a magic solution, this tool can be a valuable assistant for traders seeking to identify key market moves.
Key Features
- Detects large volume spikes over a user-defined lookback period.
- Displays buy/sell signals with colored dots and optional volume labels.
- Includes filters for trend, candle size, and volume to refine signals.
- Fully customizable settings for colors, dot sizes, and more.
Settings
- *Lookback Period (days):* Set the analysis window (default: 7).
- *Volume Threshold Multiplier:* Adjust sensitivity to volume spikes (default: 2.0).
- *Min Transparency:* Control dot visibility (default: 20).
- *Min Candle Size (% of ATR):* Filter by candle size (default: 0.5).
- *Min Volume in $:* Set a volume threshold in dollars (default: 100,000).
- *Buy/Sell Dot Color:* Choose colors for signals (default: green/red).
- *Dot Size:* Select dot size (default: tiny).
- *Show Volume Labels:* Toggle volume labels (default: enabled).
- *Trend MA Period:* Filter signals by trend (default: 50).
- *Show Large Sell:* Enable sell signals (default: enabled).
Usage
Add the indicator to your chart and tweak the settings to match your trading style. Use it to spot potential large buy/sell activity, but always combine it with your own analysis—this is a helpful tool, not a guaranteed predictor.
CryptoSignalScanner - Advanced BUY/SELL indicatorDESCRIPTION:
This script has been designed to do some swing trading on 4 hour and daily candles.
After some adjustments it also gives a good result on the lower timeframes 5m, 15m and 1h.
• This scripts is based on RSI, Stoch RSI and some other indicator(s).
• It provides BUY, SELL, STRONG BUY and STRONG SELL labels when loading the script.
• It is also possibility to set a BUY, STRONG BUY, SELL, STRONG SELL, BUY/SELL or STRONG BUY/STRONG SELL alert.
HOW TO USE:
• When a BUY signal appears it means that the trading pair is oversold. Wait for the reversal to buy. Use the Fibonacci tool together with the Eliot Waves Theory to BUY or SELL or wait for the SELL signal.
• When a SELL signal appears it means that the trading pair is overbought. SELL immediately or use the Fibonacci tool together with the Eliot Waves Theory to SELL.
FEATURES:
• You can show/hide the labels based on RSI, Stoch RSI input values.
• You can show/hide the labels based on Stoch RSI K and R input values.
• You can show/hide the labels based on Stoch RSI K and R crossing.
• You can show only STRONG BUY or STRONG SELL labels.
• Etc...
HOW TO GET ACCESS TO THE SCRIPT:
• Use the link below to subscribe to our indicators.
• Based on this script we provide telegram channels that provides signals for all Binance BTC, ETH, USDT and BNB pairs.
REMARKS:
• This advice is NOT financial advice.
• We do not provide personal investment advice and we are not a qualified licensed investment advisor.
• All information found here, including any ideas, opinions, views, predictions, forecasts, commentaries, suggestions, or stock picks, expressed or implied herein, are for informational, entertainment or educational purposes only and should not be construed as personal investment advice.
• We will not and cannot be held liable for any actions you take as a result of anything you read here.
• We only provide this information to help you make a better decision.
• While the information provided is believed to be accurate, it may include errors or inaccuracies.
Good Luck,
The CryptoSignalScanner Team

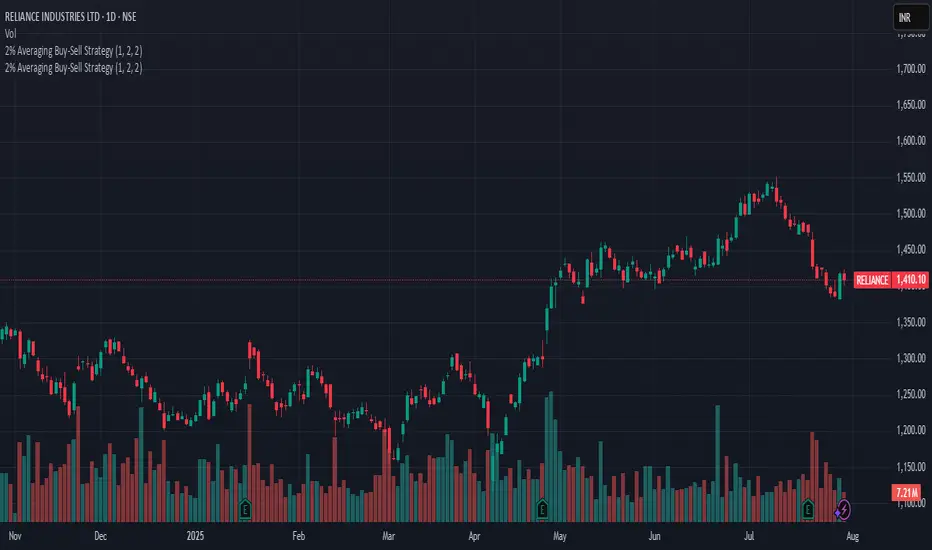
2% Averaging Buy-Sell Strategy📘 Strategy Description: 2% Averaging Buy-Sell Strategy
This strategy is designed to simulate an averaging-down and scaling-out approach based on percentage-based price movements.
Entry Logic (Buy):
Initial buy of 1 lot is triggered at the start of the strategy.
Every time the price drops by 2% from the last executed buy level, the strategy adds 2 more lots.
Exit Logic (Sell):
When the price rises 2% from the last buy level, the strategy sells 2 lots.
Selling continues in batches of 2 lots as long as the upward movement continues and lots are available.
Core Idea:
This is a dynamic averaging system that increases exposure during drawdowns and reduces it during rallies, aiming to capture mean reversion or trend reversals.
Customizable Inputs:
Initial lot size
Additional lot size
Percentage threshold (default 2%)
⚠️ Note: This strategy is for simulation/backtesting purposes. It does not account for slippage, fees, or real-world order execution conditions.
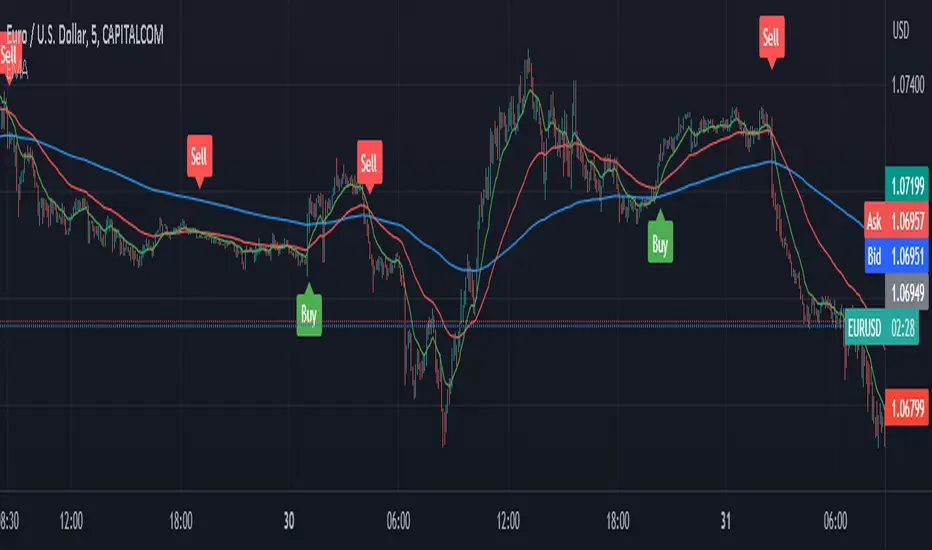
Simplest Strategy Crossover with Labels Buy/Sell to $1000This Pine Script code, titled Custom Moving Average Crossover with Labels, is a trading indicator developed for the TradingView platform. It enables traders to visualize potential buy and sell signals based on the crossover of two moving averages, offering customizable settings for enhanced flexibility. Here’s a breakdown of its key features:
Key Features
User-Defined Moving Averages:
The script includes two moving averages: a fast and a slow one. Users can adjust the periods of each average (default values are 10 for the fast MA and 100 for the slow MA), allowing them to adapt the indicator to various market conditions and trading styles.
Time-Restricted Signal Validity:
The indicator includes settings for active trading hours, defined in UTC time. Users specify a start and end hour, making it possible to limit buy and sell signals to certain times of the day. This is especially useful for traders who wish to avoid signals outside their preferred trading hours or during periods of high volatility.
Crossover-Based Buy and Sell Signals:
Buy Signal: A "Buy" label is triggered and displayed when the fast moving average crosses above the slow moving average within the user-defined trading hours, signifying a potential upward trend.
Sell Signal: A "Sell" label is generated when the fast moving average crosses below the slow moving average, indicating a possible downtrend. Labels are displayed on the chart, color-coded for easy identification: green for buys and red for sells.
Profit Target Labels (+100 Points):
After each buy or sell entry, the indicator tracks price movements. When the price increases by 100 points from a buy entry or decreases by 100 points from a sell entry, a +100 label appears to signify a 100-point movement.
These labels serve as checkpoints to help traders assess performance and decide on further actions, such as taking profits or adjusting stop losses.
Visual Customization:
The moving averages are color-coded (blue for fast MA, red for slow MA) for easy distinction, and label text appears in white to enhance visibility against various chart backgrounds.
Benefits for Traders
Efficient Trade Identification: The moving average crossover combined with time-based restrictions allows traders to capture key market trends within chosen hours.
Clear Profit Checkpoints: The +100 point label alerts traders to significant price movement, useful for those looking for set profit targets.
Flexibility: Customizable inputs give users control over the indicator’s behavior, making it suitable for both day trading and swing trading.
This indicator is designed for traders looking to enhance their technical analysis with reliable, user-defined buy/sell signals, helping to increase confidence and improve trade timing based on objective data.

Net Buying/Selling Flows Toolkit [AlgoAlpha]🌟📊 Introducing the Net Buying/Selling Flows Toolkit by AlgoAlpha 📈🚀
🔍 Explore the intricate dynamics of market movements with the Net Buying/Selling Flows Toolkit designed for precision and effectiveness in visualizing money inflows and outflows and their impact on asset prices.
🔀 Multiple Display Modes : Choose from "Flow Comparison", "Net Flow", or "Sum of Flows" to view the data in the most relevant way for your analysis.
📏 Adjustable Unit Display : Easily manage the magnitude of the values displayed with options like "1 Billion", "1 Million", "1 Thousand", or "None".
🔧 Lookback Period Customization : Tailor the sum calculation window with a configurable lookback period, applicable in "Sum of Flows" mode.
📊 Deviation Thresholds : Set up lower and upper deviation thresholds to identify significant changes in flow data.
🔄 Reversal Signals and Deviation Bands : Enable signals for potential reversals and visualize deviation bands for comparative analysis.
🎨 Color-coded Visualization : Distinct colors for upward and downward movements make it easy to distinguish between buying and selling pressures.
🚀 Quick Guide to Using the Net Buying/Selling Flows Toolkit :
🔍 Add the Indicator : Add the indicator to you favorites. Customize the settings to fit your trading requirements.
👁️🗨️ Data Analysis : Compare the trend of Buying and Selling to help indicate whether bulls or bears are in control of the market. Utilize the different display modes to present the data in different form to suite your analysis style.
🔔 Set Alerts : Activate alerts for reversal conditions to keep abreast of significant market movements without having to monitor the charts constantly.
🌐 How It Works :
The toolkit processes volume data on a lower timeframe to distinguish between buying and selling pressures based on intra-bar price closing higher or lower than it opened. It aggregates these transactions and finds the net selling and buying that took place during that bar, offering a clearer view of market fundamentals. The indicator then plots this data visually with multiple modes including comparisons between buying/selling and the net flow of the asset. Deviation thresholds help in identifying significant changes, allowing traders to spot potential buying or selling opportunities based on the money flow dynamics. The "Sum of Flows" mode is unique from other trend following indicators as it does not determine trend based on price action, but rather based on the net buying/selling. Therefore in some cases the "Sum of Flows" mode can be a leading indicator showing bullish/bearish net flows even before the prices move significantly.
Embark on a more informed trading journey with this dynamic and insightful tool, tailor-made for those who demand precision and clarity in their trading strategies. 🌟📉📈

Price Strength Index + RSI Buy/Sell ZonesThe Price Strength Index + RSI Buy/Sell Zones indicator is a technical analysis tool designed to evaluate the strength of a financial asset's price movement by comparing it with a series of Volume Weighted Moving Averages (VWMAs) of different lengths calculated from historical data.
Hypothesis :
The core hypothesis behind this indicator is that assessing the relationship between the current price and a range of VWMAs with varying lengths can provide valuable insights into the strength and direction of a price trend. Additionally, it incorporates Relative Strength Index (RSI) conditions to further refine potential buy and sell signals.
How It Works :
Multiple VWMA Calculation: The indicator calculates multiple VWMAs, each with a different length, using historical price data and volume. These VWMAs represent weighted moving averages over various periods, helping to capture different aspects of the price trend.
Comparison with Current Price : For each of these VWMAs, the indicator compares the current bar's price with the VWMA value. This comparison is crucial in understanding how the current price relates to historical averages, shedding light on the strength and direction of the prevailing trend.
SMA of Percentage Above VWMA : The indicator calculates the Simple Moving Average (SMA) of the percentage of prices above the various VWMAs over a specified period. This moving average smoothens out the percentage data, providing a clearer trend signal.
Buy and Sell Zones : User-defined upper and lower thresholds for the percentage of prices above the VWMAs are used to define buy and sell zones. When the percentage falls below the lower threshold, it signals a potential buy zone, suggesting a weakening trend. Conversely, when it exceeds the upper threshold, it signifies a potential sell zone, indicating a strengthening trend.
RSI Integration : The RSI is calculated for the selected price source with a specified length. When the SMA of the percentage above VWMAs falls within the buy zone and the RSI is below the lower RSI threshold, it indicates an oversold condition, potentially signaling a buy opportunity. Conversely, when the SMA falls within the sell zone and the RSI is above the upper RSI threshold, it suggests an overbought condition, possibly signaling a sell opportunity.
Color Coding : The indicator employs color-coding to visually represent the buy and sell zones, as well as extreme RSI conditions. Green color denotes the buy zone, red represents the sell zone, and orange lines indicate the median and potential reversal points.
In summary, the Price Strength Index + RSI Buy/Sell Zones indicator leverages multiple VWMAs of different lengths to assess the relationship between current prices and historical moving averages. This comprehensive analysis, coupled with RSI conditions, aids traders in identifying potential buy and sell zones, as well as extreme RSI points within those zones, enhancing the evaluation of price strength and potential trend reversals.

EMA with Buy/Sell Signals by lbkindCertainly! Here's a description of the code:
This Pine Script code is designed to plot Exponential Moving Averages (EMAs) on a chart and generate buy/sell signals based on specific conditions. The code includes a filter to reduce false signals by considering the trend of the EMA 200.
The key components of the code are as follows:
1. Input Variables: The code starts by defining input variables such as the periods for the EMAs (ema200Period, ema50Period, ema13Period), the Average True Range period (atrPeriod), and the chopiness threshold (chopinessThreshold).
2. Calculating EMAs: The EMAs (ema200, ema50, ema13) are calculated using the `ema()` function based on the closing price.
3. Average True Range (ATR): The ATR is calculated using the `atr()` function with the specified period (atrPeriod).
4. Normalized ATR: The normalized ATR is computed by dividing the ATR by the closing price and multiplying by 100. This allows for better comparison across different price levels.
5. EMA 200 Trend Direction: The code determines the trend direction of the EMA 200 by comparing the current value with the previous value. The variables `ema200TrendUp` and `ema200TrendDown` are assigned `true` or `false` values based on the trend direction.
6. Generate Buy/Sell Signals: The buySignal is generated when the following conditions are met:
- There is a crossover of the shorter EMAs (ema13, ema50).
- The EMA 200 is in an uptrend (`ema200TrendUp` is true).
- The current close is above the EMA 200.
- The normalized ATR is below the specified chopiness threshold.
The sellSignal is generated when the opposite conditions are met.
7. Plotting: The EMAs (ema200, ema50, ema13) are plotted on the chart using the `plot()` function. The buy and sell signals are plotted as labels using the `plotshape()` function. The buySignal is displayed below the candle (`location=location.belowbar`), and the sellSignal is displayed above the candle (`location=location.abovebar`).
By incorporating these features, the code provides a visual representation of the EMAs, along with buy and sell signals that consider the EMA 200 trend, crossover of shorter EMAs, and the normalized ATR condition. This helps in identifying potential entry and exit points in the market while attempting to reduce false signals.
Buying and Selling Pressure Raw Multi (TG Fork)Visualize raw buying and selling pressure via 3 different calculation methods, all superimposed with dynamic rescaling.
Buying and selling pressure is the concept of quantifying the disproportion between buying and selling. In practice, there is no single definitive way to calculate it.
This indicator is a merge to display three different methods to calculate buying and selling pressure, with automatic visual rescaling to superimpose the three simultaneously, updated to PineScript v5, and with some additional improvements for speed and calculation precisions, and instead of the EMA, other types of moving averages can be used.
I primarily made it for my own needs, but as always, I like sharing with the community, as maybe others may find this useful too.
How to use:
* As often, the goal is to get as many of the 3 signals concur together to get a stronger aggregated signal.
* First signal: If the green bars on the histogram are bigger than the red ones, then there is more buying pressure, and vice versa.
* Second signal: If the background is green, there is more buying pressure, and vice versa if the background is orange. The yellow and green lines define the background color, but they are by default hidden for a less cluttered visual experience.
* Third signal: If the cloud is blue, there is more buying pressure, and the bigger the cloud, the more momentum there is for it to stay (and more difficult it is to reverse to selling pressure). If the cloud is red, there is more selling pressure.
If you like this indicator, please don't give me any credit, instead please show some love to the original authors (in no particular order):
ceyhun:
daytraderph (I could not find the link to the original script, the page is inaccessible?):
www.tradingview.com
fract:

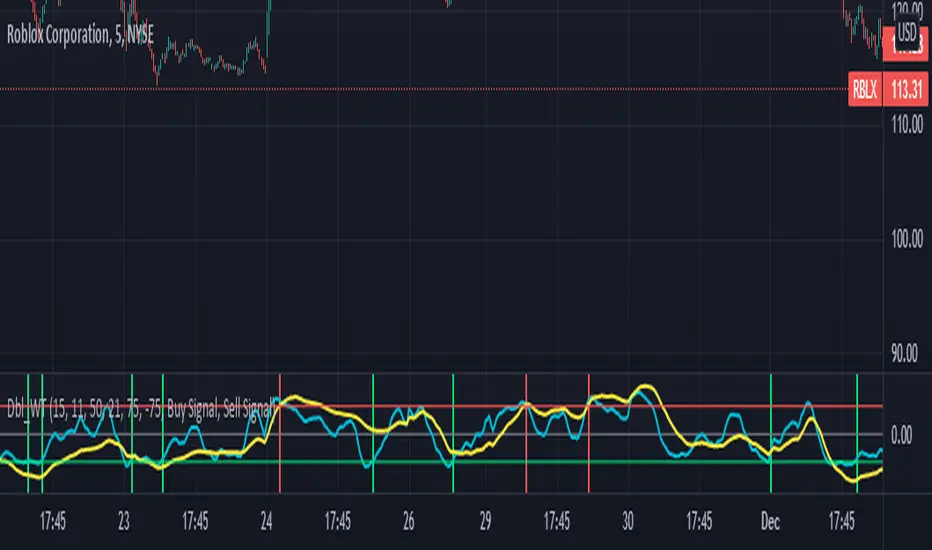
Double wave-trend Oscillator Buy/Sell signalsBINANCE:ROSEUSDT
This script attempts to use Wave Trend Oscillator's of different lengths in order to identify trade entries and exits for bullish trades. This indicator is strongly recommended to be used with volatile assets or on large time interval charts. You use this script by entering a trade when it signals a green block and exiting when it signals red although these signals could potentially be used as trend reversal signals instead. The script uses two wave trend oscillator's the lengths of which can be edited in the settings, but the general idea is that one is fast and one is slow and these indicate when to buy/sell when they crossover the overbought/sold lines. In the setting you can choose whether the fast or the slow line will be used for buy signal and the other is then used to signal selling. By default this will be ticked on indicating that the fast line crossing over the oversold level will be used for buy signals, if it is ticked off the slow line will be used. The other tickbox is for whether the line used for selling will signal when it first crosses over the overbought line or whether it should signal then it crosses back under the overbought line after having crossed over it, the default value is off indicating that it will signal when it crosses back under the overbought level. The overbought/sold levels should be tweaked on a per asset basis to get the best quality signals.
The original code for the Wave Trend Oscillator comes from LazyBear and was modified and built on to create this indicator.
Vol Buy/Sell %s, CMF, and Stocahstic Osc & UOPlots % Buy / Sell Volume , Chaikin Money Flow , Stochastic Oscillator, and Ultimate Oscillator on same axis, bound -1 to 1.
Show Volume Percentage, displaying buying as green and positive, selling as red and negative.
Showing the CMF, with green / red fill for positive / negative values.
Modified Stochastic Oscillator, converting bounds to -1 and 1, moving overbought/sold to -0.6 and 0.6, accordingly. Green fill (buy signal) with %D below -0.6 and %K lower than %D. Red fill (sell signal) with %D above 0.6 and %K higher than %D. Fill is between %D and bound, to be more visible.
Modified Ultimate Oscillator, converting bounds to -1 and 1, moving overbought/sold to -0.6 and 0.6, accordingly.

KINSKI Buy-Sell Signal"KINSKI Buy-Sell Signal" is an Average True Range (ATR) based trailing stop indicator.
In this version, you can change the ATR calculation method using the settings. The default method is hlc3. The HLC stands for High, Low, Close and the /3 divides the result by 3 to give you the average.
The indicator calculates the buy and sell signals using HLC3, Simple Moving Average ( SMA ) and the Exponential Moving Average ( EMA ) as soon as they cross. This indicator is useful with time intervals starting at 15m.
Have fun with it and be careful when buying and selling!
Example Chart:

SuperTrend V · AI Buy/Sell超级趋势 V · AI 买卖 + 止盈提示简介 / Overview
中文:
本指标在经典 SuperTrend 上加入了体量价差(VPT)平滑与“参考均线”过滤,给出 AI 买入/卖出 信号(规则化的过滤逻辑,非机器学习),并在价格触及动态止盈通道时打出 “止盈” 圆点。每笔信号之间自动跟踪并标注 峰值收益(可显示杠杆倍数),用于回顾交易潜在的最大浮盈。适合趋势/波段交易与告警联动。
English:
This indicator enhances classic SuperTrend with VPT-style smoothing and a reference EMA filter to emit AI Buy/Sell signals (rule-based, not ML). It plots TP dots when price hits a dynamic take-profit channel and labels the Peak Profit reached between opposite signals (with optional leverage display). Designed for trend/swing trading and alerts.
使用方法 / How to Use
中文:
将指标加到任意品种图表(默认 15 分钟~4 小时均可)。
观察两条“参考均线”:红线=参考均线、蓝线=开盘均线。当红线在蓝线上方时偏多,反之偏空(图中填充区也会切色)。
AI 买入:价格向上穿越 SuperTrend 线,且收盘价位于蓝线之上;AI 卖出:价格向下穿越 SuperTrend 线,且收盘价位于蓝线之下。
出现 “止盈” 圆点(TP)代表价格触达动态带(基于线性回归+σ通道)。可作为分批止盈/加减仓的参考。
当下一次出现相反方向的 AI 信号时,会在本轮交易的峰值位置打出 “峰值收益 xx% (100x)” 标签,用于复盘。
需要自动提醒:在图表右键 → “添加告警”,选择本指标并挑选相应条件(见“告警条件”)。
English:
Add the indicator to any symbol/timeframe (15m–4h recommended).
Use the two reference EMAs (red = reference, blue = open EMA). Red above blue favors long bias and vice versa.
AI Buy: price crosses above the SuperTrend line and closes above the blue EMA. AI Sell: crosses below and closes below the blue EMA.
TP dots appear when price touches the dynamic channel (linear-regression VWAP ± σ). Use them for partial take-profit or scaling.
On the next opposite AI signal, a Peak Profit xx% (100x) label is placed at the highest/lowest excursion for review.
For alerts: Right-click chart → “Add Alert” → choose this script and a condition (see “Alert conditions”).
主要参数 / Key Inputs
中文:
参考时间框架(分钟):用于参考均线与平滑的更高周期(默认 720 分=12H)。
SuperTrend 乘数 / 周期:决定 ST 线的灵敏度与带宽;乘数越小越敏感。
止盈倍数(σ)、止盈窗口长度:决定 TP 圆点通道的宽度与回溯长度。
显示峰值收益标签、杠杆(仅用于文本显示):是否显示“峰值收益”,以及标签内显示的 x 倍数。
English:
Reference timeframe (minutes) for smoothing/EMAs (default 720 = 12H).
SuperTrend Multiplier / Period control sensitivity and band width.
TP Sigma, TP Window Length define the dynamic channel.
Show Peak Profit, Leverage (text only) toggle the label and x-multiplier text.
告警条件 / Alert Conditions
中文:买入、卖出、卖出止盈触发(低位 TP)、买入止盈触发(高位 TP)。
English: Buy, Sell, TP on Short (low band cross up), TP on Long (upper band cross down).
参数建议 / Tuning Tips
中文:
加密 15m:ST 乘数 1.0~1.5、周期 10~14;TP σ=2、窗口 100~200。
趋势强:可增大乘数/窗口,减少噪音;震荡多:减小乘数/窗口,提高敏感度但留意假信号。
English:
Crypto 15m: ST mult 1.0–1.5, period 10–14; TP σ=2, window 100–200.
Strong trend: increase mult/window to cut noise. Choppy: decrease for responsiveness (watch for whipsaw).
交易提示 / Trading Notes
中文:AI 标签仅为规则化过滤,不代表模型预测;建议结合更大周期方向与量能确认。止盈圆点可做分批减仓,切勿仅依赖单一信号。
English: “AI” labels are rule-based filters, not ML predictions. Combine with higher-TF bias/volume. Use TP dots for scaling; avoid single-signal decisions.

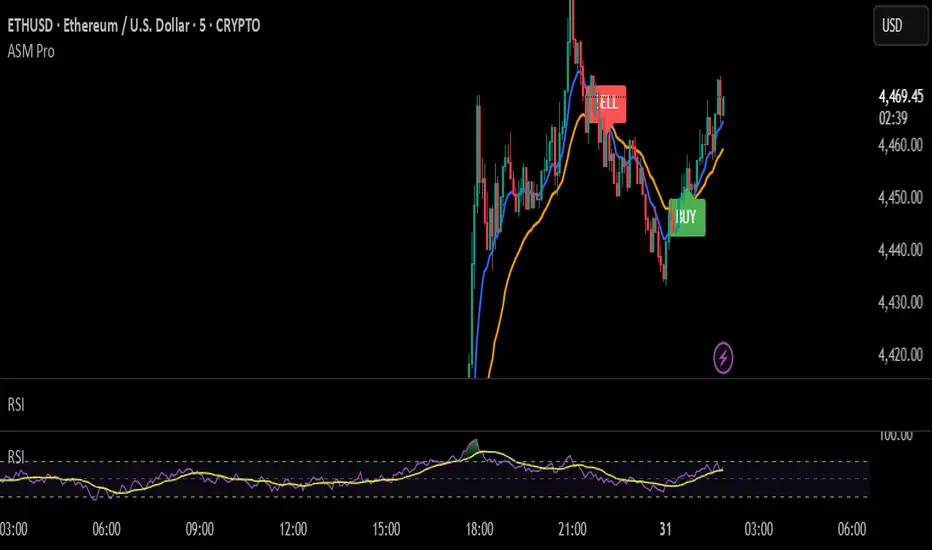
ASM Pro EMA Indicator – Smart Buy/Sell SignalsAdvanced EMA crossover indicator with auto Buy/Sell signals, real-time alerts, and multi-market support. Perfect for Indian Market, Crypto, Forex & Stocks traders.
🔹ASM Pro EMA Indicator – Key Features:
1.Dual EMA Crossover Strategy – Detects market trend shifts using Fast & Slow EMA crossover.
2.Auto Buy/Sell Labels – Instantly shows clear green BUY and red SELL signals on chart.
3.Multi-Timeframe Support – Works smoothly from 1-minute to daily charts.
4.Real-Time Alerts – Receive instant alerts on TradingView app, email, or pop-up.
5.Beginner Friendly – Simple, easy-to-use with no complex setup.
6.Professional Look – Premium design with Blue & Orange EMAs + smart labels.
7.Universal Market Fit – Optimized for Crypto, Forex, Stocks, and Gold.
8.Low Lag Signals – Faster and more reliable than standard EMA crossovers.
9.Risk-Reward Friendly – Helps traders find clear entries, stop-loss, and exit zones.
10.Premium Access Model – Available via monthly & yearly subscription.
🔹How to Make Profit with ASM Pro EMA Indicator:
1.Follow Buy/Sell Signals with Discipline – Enter on Green BUY, exit/short on Red SELL.
2.Use Multi-Timeframe Confirmation – Small timeframe entry, big timeframe trend confirmation.
3.Set Stop-Loss at EMA Levels – Below EMA for BUY, above EMA for SELL.
4.Book Partial Profits – Secure 50% at key levels, trail the rest with EMA.
5.Trade Only Trending Markets – Works best in strong uptrend or downtrend.
Volume with Buying/Selling PowerUnlock deeper market insights with this volume indicator that goes beyond basic volume analysis:
- Buying & Selling Volume Breakdown: Distinguishes between buying and selling pressure so you can spot real shifts in market sentiment.
- Adaptive Volume Coloring: Bars colored by previous close or buy/sell balance for instant clarity.
- Volume Power Signals: Visualizes buying and selling volume power using both raw and normalized calculations.
- Buy/Sell Ratio Coloring: Optionally color bars based on relative buy/sell strength for quick visual cues.

SeikaAlgo–Long/Short Buy/Sell SignalSeikaAlgo–Long/Short Buy/Sell Signal — Simple, Visual, Reliable Signals
SeikaAlgo makes high-probability trading simple and actionable for everyone—no complex rules, no guesswork. Just follow these 3 steps:
How It Works
1. Watch for Buy/Sell Signals
Buy and Sell signals are printed right on your chart, only after the candle closes—never repaints, never lags. Trade with confidence.
2. Enter at Candle Close
Buy: Enter at the close of a candle when a green “B” label appears and price crosses above the green EMA 9.
Sell: Enter at the close of a candle when a red “S” label appears and price crosses below the red EMA 9.
3. Take Profit
Move your stop loss with each new candle (trailing stop), or use the EMA 9 line to trail stops.
Take profit when price reaches a Daily Fibonacci Level.
Example — 5min SPY
Buy Signal: Green label prints above green EMA 9 after candle closes. Enter at close, stop just below the signal candle’s low.
Sell Signal: Red label prints below red EMA 9 after candle closes. Enter at close, stop just above the signal candle’s high.
Key Features
No Lag, No Repainting: Signals only appear after a candle is complete—so you’re never chasing ghosts.
Clear Visual Cues: Instantly know when to buy, sell, or step aside.
Built-in Trailing Stop Logic: Protect your trades easily.
Works On Any Market/Timeframe: Perfect for stocks, futures, crypto, or forex.
SeikaAlgo is an invite-only indicator.
Add it to your chart, follow the labels and EMA, and trade with confidence—no clutter, no confusion. Simple, visual, reliable.

PKSE Buy/Sell Signals Table - Two Columns with VWAPndicator Description: PKSE Buy/Sell Signals Table - Two Columns with VWAP
Overview
The PKSE Buy/Sell Signals Table - Two Columns with VWAP is a robust Pine Script indicator for Pakistan Stock Exchange (PSX) traders. It generates buy and sell signals for 19 PSX stocks based on Simple Moving Average (SMA) crossovers, KSE100 Index trends, and daily Volume Weighted Average Price (VWAP) conditions, displayed in two compact, side-by-side tables optimized for monitor viewing.
Purpose
This indicator helps traders identify high-probability trading opportunities by filtering signals with VWAP to reduce noise, ideal for swing traders, day traders, and investors monitoring PSX stocks.
Key Features
Dual-Table Layout: Displays 19 stocks in two side-by-side tables (10 and 9 stocks) for a monitor-friendly view.
Enhanced Signal Logic: Combines three conditions:
KSE100 Trend: Signals depend on the KSE100 Index being above/below its SMA.
Stock SMA: Signals based on stock price crossing or being above/below its SMA.
Daily VWAP Filter: Buy signals require the stock to be above its daily VWAP; sell signals require it to be below.
Signal Types:
Buy NOW: Stock crosses above SMA, KSE100 is bullish, stock above VWAP.
Buy: Stock above SMA, KSE100 bullish, stock above VWAP.
Sell NOW: Stock crosses below SMA, KSE100 bearish, stock below VWAP.
Sell: Stock below SMA, KSE100 bearish, stock below VWAP.
Neutral: Conditions not fully met.
No Data: Invalid or missing data.
Customizable Inputs:
SMA length (default: 5).
Timeframe (5, 15, 30, 60 minutes, daily; default: 30 minutes).
KSE100 symbol (default: "PSX:KSE100").
Color-Coded Signals: Green (Buy), lime (Buy NOW), red (Sell), orange (Sell NOW), gray (No Data), white (Neutral).
Stock Coverage: Tracks 19 PSX stocks (e.g., FFC, OGDC, HUBC, UBL, MCB, LUCK).
Error Handling: Handles invalid symbols or missing data with "No Data" signals.
How It Works
Fetches KSE100 and stock prices in the selected timeframe (default: 30 minutes) and daily VWAP.
Calculates SMA for KSE100 and stocks; evaluates VWAP position.
Generates signals when all conditions align, based on the 30-minute candle close.
Displays results in two tables (Stock, Signal, Timeframe) at top-right and top-center.
Usage Instructions
Add the indicator to your TradingView chart.
Configure inputs: SMA length, timeframe, KSE100 symbol.
View tables showing signals for 19 PSX stocks.
Use signals to guide trading, combining with other analysis.
Adjust table positions if needed (modify position.top_right/top_center).
Ideal For
PSX traders using SMA and VWAP strategies.
Swing/day traders seeking filtered signals.
Investors tracking KSE100 and stock trends.
Limitations
Limited to 19 stocks due to TradingView’s 40-security-call limit.
Signals rely on SMA, VWAP, and KSE100; combine with other analysis.
Hardcoded stock list; contact the author for customizations.
Notes
Verify stock symbols are valid on your TradingView platform.
Best on 1920x1080+ resolution. Adjust chart scaling if tables overlap.
Published on June 12, 2025, at 11:50 AM PKT.
Disclaimer
Trading carries risk. This indicator is for informational purposes only and not financial advice. Conduct your own research before trading.

Heikinisi Candle (With MA + Smoothing + Buy/Sell with Cooldown)This custom Heikinisi Candle (With MA + Smoothing + Buy/Sell with Cooldown) indicator combines the advantages of Heikin-Ashi candles with the flexibility of multiple moving averages and smoothing options. The built-in buy/sell signals with cooldown functionality help traders avoid overtrading while capturing trend reversals and momentum shifts. Whether you're a day trader, swing trader, or long-term investor, this indicator offers powerful tools for analyzing price action and making informed trading decisions.
Note: Disable the regular candle to get better visualization.
Key Features:
Custom Heikin-Ashi Candles:
The core feature of this script is the Heikin-Ashi candles, which are known for smoothing price action and helping traders identify market trends more clearly.
Unlike traditional Heikin-Ashi, this version adjusts the Heikin-Ashi close based on specific price action patterns, including rejection signals and engulfing patterns.
The custom Heikin-Ashi open also incorporates momentum, adjusting dynamically based on recent price changes.
Price Action Measurements:
The indicator measures key price action components, including:
Body: The absolute difference between the open and close.
Candle Range: The total range from high to low.
Upper Wick: The distance from the highest price to the maximum of open or close.
Lower Wick: The distance from the lowest price to the minimum of open or close.
These measurements help detect bullish and bearish conditions, as well as price rejection signals.
Buy/Sell Signal Logic:
Buy Signal: Triggered when the Heikin-Ashi close is above the chosen moving average (MA1), with a cooldown period to avoid too frequent signals.
Sell Signal: Triggered when the Heikin-Ashi close falls below the MA1 after a buy signal has already been issued.
The cooldown period ensures that buy and sell signals are spaced apart by a specific number of bars, preventing excessive signal generation during periods of price consolidation.
Multiple Moving Averages (MA):
This script supports up to three customizable moving averages (MA1, MA2, MA3), each of which can be set to different types and lengths, including:
Simple Moving Average (SMA)
Exponential Moving Average (EMA)
Weighted Moving Average (WMA)
Volume Weighted Moving Average (VWMA)
Volume Weighted Moving Price (VWMP)
Least Squares Moving Average (LSMA)
Hull Moving Average (HMA)
Double Exponential Moving Average (DEMA)
Triple Exponential Moving Average (TEMA)
Users can adjust the length and type of each MA for tailored analysis.
Smoothing Options for MAs:
Users can smooth the output of MAs using various types of smoothing algorithms (SMA, EMA, LSMA, WMA, Gaussian) and a customizable length. This helps to reduce noise in the moving average lines and provides clearer signals.
Gaussian Filter (Advanced Smoothing):
A Gaussian Filter is available as a smoothing option for MAs. This filter reduces noise and makes the moving averages smoother, which can be particularly helpful in volatile or choppy markets.
Alerts and Visualization:
The script allows users to plot buy and sell signals on the chart with distinctive markers. A Buy Signal is shown below the bar with a lime green marker and text "Buy," while a Sell Signal is shown above the bar with a red marker and text "Sell."
Traders can also set up alerts based on the buy/sell signals to get notified in real time.
Indicator Configuration:
Heikin-Ashi Candle Configuration:
Automatically adjusts Heikin-Ashi candles based on rejection signals, engulfing patterns, and momentum. It uses custom formulas for the Heikin-Ashi open and close, making it more sensitive to price action than standard Heikin-Ashi candles.
Moving Averages (MA) Configuration:
You can select from multiple moving average types and lengths (MA1, MA2, MA3) for trend-following analysis.
Choose between SMA, EMA, WMA, VWMA, VWMP, LSMA, HMA, DEMA, and TEMA.
Smoothing Options:
Enable or disable smoothing for the moving averages.
Select from different smoothing types, including SMA, EMA, RMA, WMA, LSMA, and Gaussian.
Cooldown Period:
Control the number of bars that must pass before a new buy/sell signal is triggered. This cooldown period helps prevent excessive trading signals in quick succession.
How to Use:
Analyze Price Action with Heikin-Ashi Candles:
The custom Heikin-Ashi candles are ideal for spotting market trends, reversals, and price rejection. Use the candle patterns to gauge the market sentiment.
Use MAs for Trend Confirmation:
The moving averages (MA1, MA2, MA3) can help identify the prevailing trend. A price above a rising MA indicates an uptrend, while a price below a falling MA suggests a downtrend.
Trigger Buy and Sell Signals:
When the Heikin-Ashi close crosses above MA1, a buy signal is triggered.
When the Heikin-Ashi close crosses below MA1 after a buy signal, a sell signal is triggered.
The cooldown period ensures that signals are spaced out, preventing overtrading.
Use Smoothing for Clearer Signals:
If you are trading in a volatile market, you can use the smoothing options to make the MAs smoother and reduce noise.

Advanced QQE Buy/Sell with Confirmation FiltersAdvanced QQE Buy/Sell with Confirmation Filters
This indicator provides high-probability Buy and Sell signals using an advanced Quantitative Qualitative Estimation (QQE) method, enhanced by optional powerful confirmation filters.
Core Strategy:
📈 QQE Signals: Based on smoothed RSI crossover of dynamic threshold bands.
🎯 Buy Signal: Triggered when RSI crosses above QQE Lower Band.
🎯 Sell Signal: Triggered when RSI crosses below QQE Upper Band.
Optional Confirmation Filters:
🔧 RSI Filter: Only accept buys when RSI > 55 or sells when RSI < 45.
🔧 MACD Histogram Filter: Confirms momentum direction.
🔧 VWAP Filter: Confirms if price is above (bullish) or below (bearish) VWAP.
Customization Options:
Adjust RSI Length, QQE Smoothing Length, and Threshold to match your trading style.
Independently toggle each confirmation filter ON/OFF from the settings.
VWAP line can also be plotted on chart for visual guidance.
Key Features:
Clean Buy (green up label) and Sell (red down label) signals plotted on chart.
Alerts available for Buy/Sell triggers.
Optimized for fast performance and low lag.
Recommended Timeframes:
15min, 1H, 4H, Daily.
Disclaimer:
This indicator is for educational purposes only. Trading involves risk. Always perform your own due diligence.
Developed and optimized by Keyvan 🚀
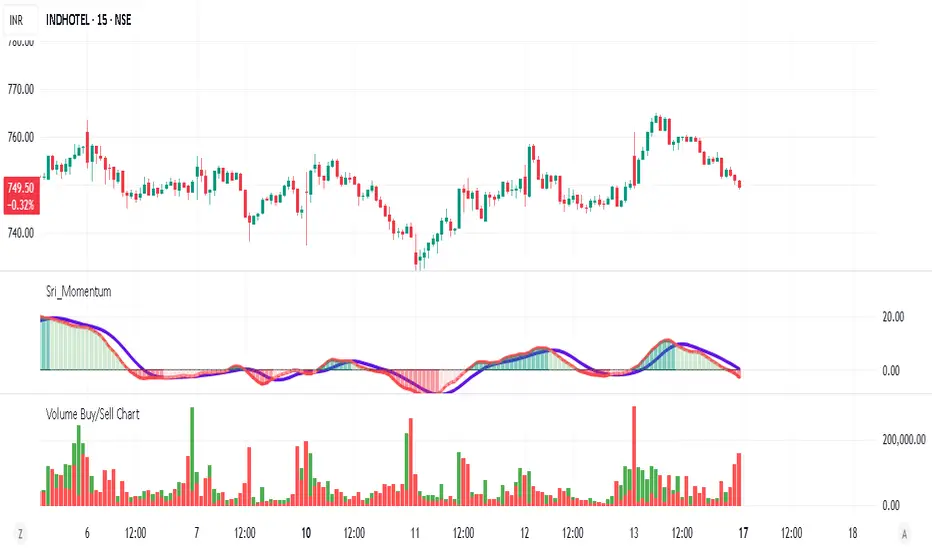
Volume Buy/Sell ChartVolume Buy/Sell Chart
This script visualizes the distribution of buying and selling volume within each candlestick, helping traders identify dominant market pressure at a glance. It separates volume into Buy Volume (Green) and Sell Volume (Red) using a unique calculation based on price movement within a candle.
Features:
✅ Customizable Bar Display: Choose to display 5, 10, or 100 bars using a simple dropdown selection.
✅ Buy & Sell Volume Calculation: The script determines buying and selling volume dynamically based on price action within the candle.
✅ Custom Volume Threshold for Alerts: Set a percentage threshold (0–100) to trigger alerts when buy or sell volume exceeds a predefined level.
✅ Color-Coded Histogram:
Green Bars: Represent the estimated buy volume.
Red Bars: Represent the estimated sell volume.
✅ Alerts Integration: Automatically detect strong buy or sell signals when the respective volume percentage exceeds your set threshold.
How It Works:
The script calculates total price movement within a candle.
It then estimates buying and selling volume ratios based on whether the price closes higher or lower than it opened.
Finally, it normalizes the buy/sell volume against the total volume and plots it as a column chart.
Usage Guide:
Add the script to your chart.
Select how many bars to display (5, 10, or 100).
Adjust the Custom Volume Percentage Threshold (default: 75%).
Watch for significant buy/sell volume imbalances that might indicate market turning points!
This tool is great for traders looking to analyze volume flow and market sentiment with a simple yet effective visualization. 🚀