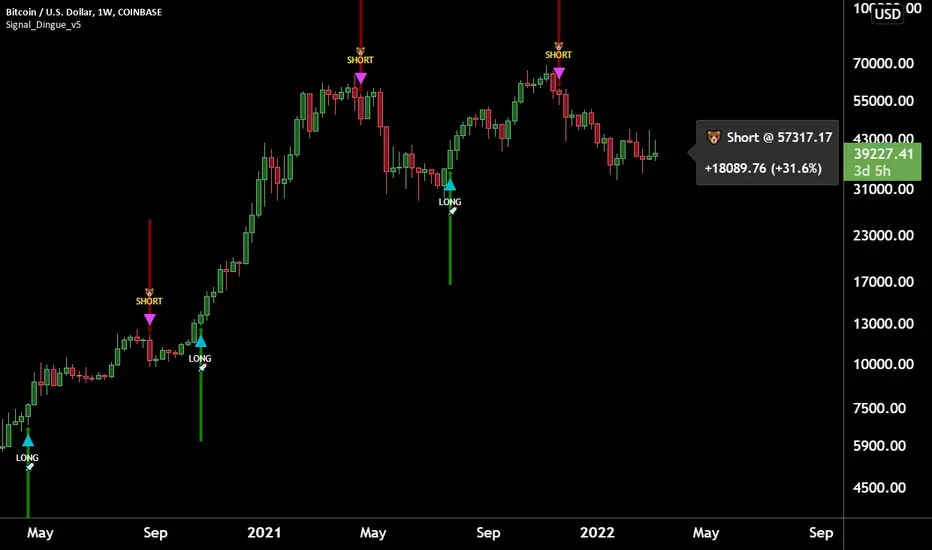
Trading Assistant DiNGUETrading Assistant DiNGUE This indicator is like a trading assistant for your charts.
It helps set your biases and emotions aside and lets you focus on managing trades in an easy visual way.
Get various types of signals to enter your trades (either Long or Short). Then use take profits, stops, or the opposite signal to exit trades.
The signals are created from various indicators and sensibility options you can customize any way you want. Works on every timeframe.
You can customize every setting or used the preset ones. Preset settings adjust automatically based on the timeframe you are using on the chart.
The 12 Indicators are Volume - RSI - Stochastic - MacD - Moving Averages (MA) - Rate of Change (ROC) - ADX DMI Directional Movement Index - On Balance Volume (OBV) - Bollinger Bands - VWAP - ATR - Parabolic SAR.
Every indicator can be turned On or Off.
You can adjust the way it creates signals by selecting either 'rise-fall', 'crosses' or by combining both.
You can select the sensitivity of the signal from Normal - Safe - Safer.
You can adjust lengths or use the preset ones.
There are also additional options for each indicator, you can filter weak levels for ADX, filter for tight bands, have ROC above 0…
You can also plot several of those indicators on the screen. 2x Moving Averages, 2x VWAP, 2x ATR, 2x SAR for even easier visualization of the trend.
You can also plot fractals to facilitate once again on trend visualization. Higher high, lower low, higher low, lower high.
Trade with the Trend and Safe Trades:
If you want to have a higher chance of success, you can trade with the trend. First, select the trend timeframe you would like to use. Let's say the “Weekly” trend. Meaning it will generate a signal on the weekly timeframe and based on the result (Long or Short) it will only take trades in that direction. So the trend is LONG on the Weekly and you get a “Long” signal, it will take it. “Short” signals on the other hand will be treated as “stops” and won’t want to go against the trend by going ‘short’.
Safe Trend works in the same manner, but instead of using the signal on a bigger timeframe, it uses an indicator as to the deciding factor. Let's say you select the 200SMA as the “Safe signal”. The indicator will only go “Long” when above the 200SMA and “Short” under the 200SMA. Otherwise, it will put a stop instead of going against the trend.
Stop Loss:
There are 4 different types of stop-loss that you can use at the same time.
- Indicator Stop
- Fib stop
- Fix % stop
- Trailing stop
You can plot the stops directly on the chart AND OR add them to the panel for an easy visualization once again.
With the ‘indicator stop’, you can select one of the two: MA ATR SAR VWAP as a stop.
Fib stop, it uses fib numbers to calculate a stopping point.
Fix %, you can select your max loss in percent. Could be 2%, 5%
A trailing stop is like a fixed stop but that will trail as the price moves in the right direction.
Take Profit:
There are 4 different types of take profit that you can use simultaneously.
- Fix % Take Profit
- ATR multiple Take Profit
- Fib multiple Take Profit
- Bollinger Band Take Profit
Fix % just let you set a fix take profit target in percent.
ATR multiple lets you select a target based on a multiple of the average true range.
Fib multiple lets you select a target based on a fib multiple
Bolling Band lets you take profit based on the Bollinger band settings you select.
Visual Panel:
The visual panel lets you see exactly how is the last trade progressing. It will give you the entry price, profit, stop, and target. You can turn it on or off, as is for the stop and target.
You can also decide to plot 1 position or more, you can even show all the possible signals, add backgrounds with colors. You can also plot the bigger Trend and Safe Signals explained above.
If you have any questions, suggestions, or comments, feel free to do so!
Wyszukaj w skryptach "bot"
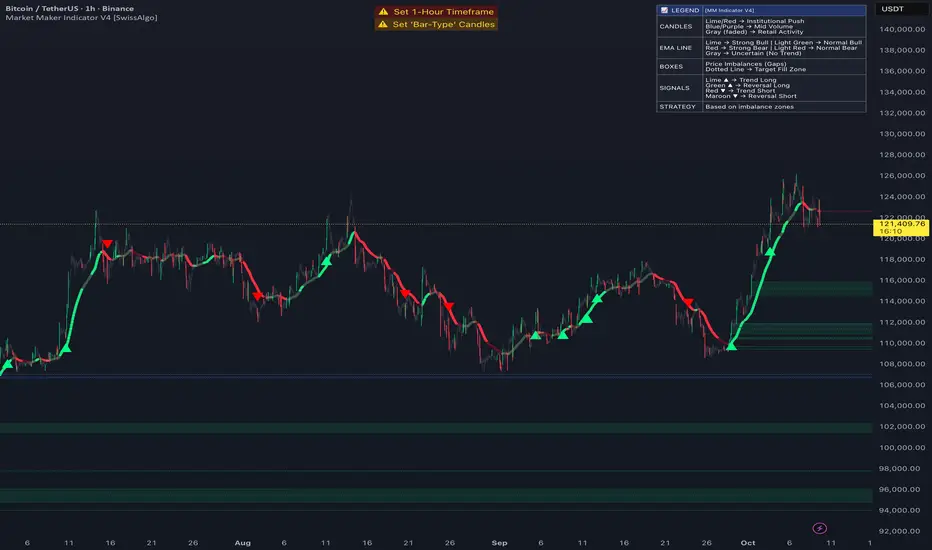
Market Maker Indicator V2 [tecnocrypto]This indicator is based on the idea that prices are generated by the interaction between a Market Maker on one side (sometimes also called the "Composite Man") and Retail Traders on the other side (Retail Traders include simple retail, professional traders, whales, institutions...as a single entity). These two opposite entities "play" the trading game on trading platforms/exchanges (crypto), which are neutral to the game.
Market makers are liquidity providers, and make profits either by charging a spread between buy and sell prices, and (also) by trapping retail traders into specific positions.
Trading is a "zero sum" game in the sense that it generates a transfer of resources between these two specific players, which are indeed the Market Maker and Retail Traders. If Retail Traders are in profit, Market Maker is (temporarily) in loss, and viceversa. Market Maker goal is to squeeze profits out of Retail Traders, by inducing them to take wrong positions.
The Market Maker Method Indicator executes the following:
1) Identifies and plots candles that are generated by the Market Maker's moves (called "Shift Candles"); shift candles are "artificial" price/volumes moves, generated to induce retail traders into specific zones which are, essentially, traps. They are called Shift Candles as they generate abnormal (and mostly unexpected) price movements in either direction. They move the price from one zone to the next to execute the Market Maker strategy. Observe how often sudden (apparent) prices increases are followed by price crashes (stop hunt rise, drop); and observe how often sudden (apparent) price collapses are followed by price uptrends (stop hunt low, rise); sometimes these movements are made in progressive steps (generally, 3).
2) Plots open long/open short alerts based on the assumption that when Market Maker plots upwards shift candles, vivid green color, they are preparing for an upcoming price reversal (down); same, but opposite sign, for downwards shift candles. This is a counterintuitive logic for Retail Traders, that generally open long when price is rising, and open shorts when price is falling - jumping into Market Makers traps.
3) Plots the areas where price is expected to return (upwards or downwards) based on previous shift candles (called "Recovery Zones")
You can use this indicator on any timeframe and for any asset.
The Market Maker indicator V2 provides long / short entry signals based upon the market maker manipulative moves described above.
Long alerts are triggered by manipulative price push-downs by the marker maker, which will be followed by price increases (while price was decreasing, market maker was purchasing from retail). Additional factors are taken into consideration to plot long entry signals, , mainly volume build up and mean reversion, around this basic concept.
Short alerts are triggered by manipulative price push-ups by the marker maker, which will be followed by price drops (while price was increasing, market maker was selling to retail). Additional factors are taken into consideration to plot short entry signals, mainly volume build up and mean reversion, around this basic concept.
The indicator is based on the Traders Reality indicator, but improved with alerts, that can be used with trading bots, and additional possibilities to customize the behavior of the indicator.
A strategy associated with this indicator is also available.
Best results on the 1H timeframe.
Contact me for further info.
MarketMaker Method [ShiftCandles]This indicator is based on the idea that prices are generated by the interaction between a Market Maker on one side (sometimes also called the "Composite Man") and Retail Traders on the other side (Retail Traders include simple retail, professional traders, whales, institutions...as a single entity).
These two opposite entities "play" the trading game on trading platforms/exchanges (crypto), which are neutral to the game.
Market makers are liquidity providers, and make profits either by charging a spread between buy and sell prices, and (also) by trapping retail traders into specific positions.
Trading is a "zero sum" game in the sense that it generates a transfer of resources between these two specific players, which are indeed the Market Maker and Retail Traders. If Retail Traders are in profit, Market Maker is (temporarily) in loss, and viceversa. Market Maker goal is to squeeze profits out of Retail Traders, by inducing them to take wrong positions.
The Market Maker Method Indicator executes the following:
1) Identifies and plots candles that are generated by the Market Maker's moves (called "Shift Candles"); shift candles are "artificial" price/volumes moves, generated to induce retail traders into specific zones which are, essentially, traps. They are called Shift Candles as they generate abnormal (and mostly unexpected) price movements in either direction. They move the price from one zone to the next to execute the Market Maker strategy. Observe how often sudden (apparent) prices increases are followed by price crashes (stop hunt rise, drop); and observe how often sudden (apparent) price collapses are followed by price uptrends (stop hunt low, rise); sometimes these movements are made in progressive steps (generally, 3).
2) Fires open long/open short alerts based on the assumption that when Market Maker plots upwards shift candles, vivid green color, they are preparing for an upcoming price reversal (down); same, but opposite sign, for downwards shift candles. This is a counterintuitive logic for Retail Traders, that generally open long when price is rising, and open shorts when price is falling - jumping into Market Makers traps.
3) Plots the areas where price is expected to return (upwards or downwards) based on previous shift candles (called "Recovery Zones")
The script will be further developed to prevent early open long/open short alerts, trying to catch the Market Makers cycles in a more detailed way (to account for situations where artificial price moves are executed in consecutive steps, instead of single candles).
You can use this indicator on any timeframe and for any asset.
You can connect the open long/open short alerts to trading bots to execute automatic trades.
Buy / Sell indicator light version [Crypto_BCT]The indicator is based on the search for the lowest bars in a given period (can be customized).
You can add a search for the highest bars to determine the closed order points.
You can add a filter by the value of the RSI (you can customized it separately for buying and selling).
Alerts for buying and selling are set.
It can be used to work with bots, for example 3COMMAS DCA bot.
--------------------------
Signal Condition Settings:
(Buy) Lowest Bar
The closing of the current bar is lower than the closing of the bars back in this range
(Buy) RSI value <
The RSI index is below this value
(Sell) Highest Bar
The closing of the current bar is higher than the closing of bars in this range
(Sell) RSI value >
The RSI index is higher than this value

MoonFlag AI Cloud (JWTainsh)This is a cloud that is based on a novel overshoot algo and also provides a 'central line' which represents to some degree an average moving in the direction of the trade (as indicated by the cloud).
Most indicators are based on moving averages which lag the price action.
This indicator uses a predictive overshoot algo that is different to a moving average. The algo overshoots the price action by following momentum. The cloud is made from multiple overshoot algo's all at different lengths (number of lookback bars).
In comparison to a moving average, the moving average will never give a reading greater than the price action in an up-trend. A moving average will lag the price action and eventually the price will come down and intersect with the moving average. In this overshoot algo (that forms the cloud), the parts of the algo with the shorter length will shoot way above the price action as the uptrend weakens.
The cloud is made from multiple overshoots algo's all with a different length. So when an uptrend weakens, the overshoot algo's with the longer length will still be below the price action and the price action will dip below the base of cloud - thus indicating an end to the uptrend - and possibly the start of a downwards momentum if the price action persists into the red.
So, when the price action dips below the cloud, it forms a line whereby below the line the cloud is colored red - indicating a possible downturn in the trend as the up momentum has receded. There is still a green part to the cloud above the lower line, as the up momentum could re-establish if the price action stays about the red.
Similarly, if in a down trend (price action in a red part of the cloud) and the price action breaks above the top of the cloud, the cloud will go green - until the price action falls below the cloud again.
There is also a half-way average line (although this is not entirely correct - it does describe what the mid-line does with some understanding). This mid-line only moves up when in an upward momentum. Similarly, the mid-line only moves down in a down momentum. Its interesting to see when the price action crosses the mid-line as this can indicate a change in momentum early on.
For example, if the price action remains above the mid-line, this can show a pump is still in progress.
If the price action just bounces above the cloud, then below, then above - it means the could length is not great enough - and the price action is probably governed more by RSI on a relatively fast timeframe.
When the cloud gets thin - this generally means the price action is in line with a steady momentum and has been for a while. This can be thought of as all the moving averages converging and this sometimes can indicate a biggish move is about to happen (and thus throw the cloud into a wider state - and get all the traders excited).
I started coding this cloud when trying to intersect with the start of shorts or to locate the end of a long trend cycle. Shorts generally happen on a faster timeframe than longs so I generally use separate cloud timeframes (or lengths) for longs or shorts.
I also find that market conditions change considerably every few weeks or months - so the cloud is best reliable on recent data.
Also use in conjunction with other indicators such as OCC, 1D ATR Trend or VRSI/MACD Confluence - as this is a predictive indicator based on price action overshoot from momentum information. This is not - a moving average - this cloud does not lag price action - it kind of predicts where the price action will go if the present momentum remains - and then detects when a change in this momentum occurs due to price action intersection.
Please get in touch for more information or, if you would like to see the webhooks bot strategy I linked to the code.
Sincerely,
Moonflag (Josef Tainsh PhD)

v1 Automatic Trading BotHello Friends.
We have been working on this script for a long time. Briefly, our scenario works as follows.
This test data includes results as of January 1, 2022 using a balance of $1000 and 10%.
WORKİNG LOGİC :
Relative Strength Index
Directional Movement Index
Relative Momentum Index
Indicators are Blended.
1 conditions are met in the overbought and oversold zone.
If the Directional Movement Index Signal is in the same direction, If all signals are in the same decision, it will be position.
We can set the take profit and stop loss levels on the algorithm as % over the entry price.
HOW TO ADJUST :
Formula a and formula b values are adjusted by increments or decrements of 1 each. these adjustments should be changed according to the time frame and chart layout.
You do not need to intervene in overbought and oversold zones. The Best Values were thus deemed appropriate.
If you still want to intervene, you need to know; When you change the overbought and oversold values, the entry time and risk will increase.
Together with the backtest script we are able to adjust the algorithm to all timeframes.
For example, while these settings are ideal for 5 minutes, it is necessary to change the strenght and formul values for a 15-minute period. This provides a user-specific adjustable strategy.
There are 6 different triggers in total on the alarm version.
Enter a long position.
Long position take profit
Long position stop loss
Enter a Short position.
Short position take profit
Short position stop loss
Currently, one platform is also connected to the binance exchange via an API .
The maximum leverage is set to 5 and a maximum of 5 trades are ordered to enter.
Good Luck Everyone !

BTC Price OverlayThis is not a crazy strategy like most of the code I write. It's a simple overlay so you can drop BTC on top of whatever chart you are watching. It will track BTC's price on Binance.us (though the exchange is changeable with a few lines of code, maybe I will make it a dropdown on the next iteration of this.)
It uses TradingView's scale function to show both assets on a relative chart. BTC's price is on the left and your asset is on the right.
I've made this available for free because it is quick and easy. I plan to write a bot based around this code and that one will be private.

Buy / Sell alert indicator [Crypto_BCT]Hello everyone!
I bring to your attention a indicator to determine the point of buy and sell purchase.
It is based on oscillators and a moving average.
It can be used to work with bots, for example 3COMMAS DCA bot.
Signal Condition Settings:
ATR
The current candle is larger than the ATR for this period
EMA
The signal is necessarily below (for buy) and above (for sell) the EMA of the specified period
(Buy) RSI low
The RSI index is below this value
(Sell) RSI High
The RSI index is higher than this value
(Buy) MFI low
The MFI index is below this value
(Sell) MFI High
The MFI index is higher than this value
(Buy) CCI low
CCI index is below this value
(Sell) CCI High
The CCI index is higher than this value
(Buy) Lowest bar from
The closing of the current bar is lower than the closing of the bars back in this range
(Sell) Highest bar from
The closing of the current bar is higher than the closing of bars in this range
(Buy) Lowest EMA bar ago
During a given distance back, the EMA value only decreased
(Sell) Highest EMA bar ago
At a given distance back, the EMA value only increased
I hope it will be useful!

Buy alert [Crypto_BCT]Hello everyone!
I bring to your attention a simple indicator to determine the point of purchase.
It is based on oscillators and a moving average.
It can be used to work with bots, for example 3COMMAS DCA bot.
Signal Condition Settings:
ATR
The current candle is larger than the ATR for this period
EMA
The signal is necessarily below the EMA of the specified period
MFI low
The MFI index is below this value
CCI low
CCI index is below this value
RSI low
The RSI index is below this value
Lowest bar from
The closing of the current bar is lower than the closing of the bars back in this range
Lowest EMA bar ago
During a given distance back, the EMA value only decreased
I hope it will be useful!

Nearest Percentile Moving Average BandsWhile coding some filters into another indicator for Long/Short I noticed that ta.nearest.percentile might be the most useful tool in pinescript I've ever encountered.
While percentile_nearest can be used for all kind of things I decided to code moving averages from it and made bands for bottom percentage and top percentage.
The indicator will calculate the top % price of the given bar length.
Example settings:
length: 150
percentile: 99
So when using 99% it will draw a green line when price is moving above the top 1% price of the last 150 candles. It then calculates if the price is below the bottom 1% of the last 150 candles.
Trading use:
Use this indicator to check if the market is leaving normal territory. This signals a breakout move for example the dogecoin pump or the top of the range. I use this indicator to catch bull/bear moves for botting purposes. An other use would be to countertrend trade after the move has ended. With price being in top 1% for a while it is very probable that we see a large correction.
Below example of dogecoin pumps:

DCA RSI Add funds exit simulatorThis script helps with planning on how to exit DCA deals that are in the negative.
The following deal information is required
- Current average position price
- Funds invested
- Required take profit
Additional indicator settings are
- The date/time on which to start the simulator
- Minimum deviation % to start adding funds
- Expected bounceback from when funds are added
The RSI trigger
Adding funds is triggered when the selected RSI settings yield a value that is at or beyond the selected threshold.
How it works
The amount of funds needed are calculated based on the supplied settings, such that the new average price matches the expected bounceback.
It will also show if the exit strategy has failed to hit the TP (this happens when the RSI threshold is hit again)

VanessaThis indicator transforms different oscillators to automated trade signals via alerts.
What is included:
Community Channel Index (CCI)
Money Flow Index (MFI)
Bollinger Bands (BB)
Select any or all sources
Change timeframe for the sources
Change threshold level for the sources
Add your Bot ID & Email Token
Select the volume to Add Funds
Backtest compatible
Alerts compatible
Description:
By combining multiple long timeframe Deal Start Conditions you increase the chance of recovering unsuccessful deals. Add this to your toolbox as a complement to the original Deal Start Conditions and Martingale-strategy for Dollar Cost Averaging your deals. The buy signals are accumulated and sent every time any of the chosen conditions are valid. This effectively dollar cost average your position every time the alerts are sent, lowering your average buy price. It is recommended to begin using this indicator with a low volume so you learn how this strategy affects your current deals. It can be useful on your red bags and put your reserve funds to use in an automated way, leaving your feelings on the sideline.
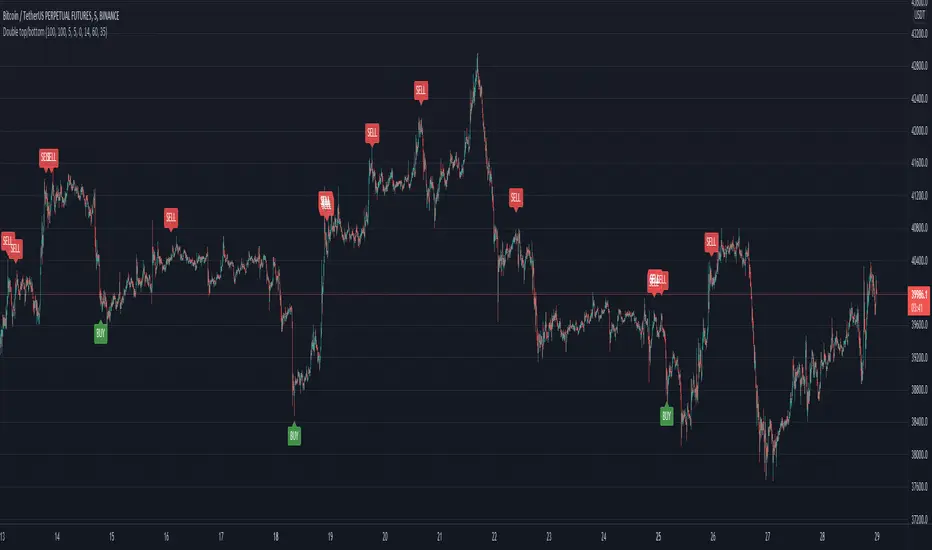
Double top/bottomHello!
This alerts is based on the double bottom pattern - for entering a long position / double top-short
A double bottom pattern is formed when two price bottoms are relatively at the same level and the top acts as resistance. This pattern appears at the end of a downtrend and signals a reversal.
A double top is a bearish reversal pattern that signals the end of an uptrend. It is formed by two price highs forming at the same level and a notch line that acts as local support.
As history and practice show, the double bottom pattern works better. Moreover, in a bull market.
// LOGIC ENTRY:
Period for short and long positions-to search for double bottom as well as double top . the more, the less false.
Change liong and short-channel width for pattern search separately for long and short.
General shift-the overall width of the channel, which changes equally at once for long and short
By default, quiet settings for 1 hour
You can choose the settings you like.
//FILTER SETTING
-RSI
If the checkbox is checked, the filter will be enabled.
The higher the upper bound, the less frequent short entries.
The lower the indicators of the lower border, the less frequent entries to the long
Heikin Ashi Trailing Stoploss ActivationThe Basics
This indicator should be used on regular candle sticks. It is possible to trigger an alert, when the block flips from red to green bar. Or vice versa.
Red block represents a red Heikin Ashi candle.
Green block for green Heikin Ashi candle.
It can be used as a trailing stoploss for (DCA/ TV) bots, when riding trends.
What Makes It Different
The user can preset the price (of the asset e.g. BTC), where it will start looking for Heikin Ashi flips. Every Heikin Ashi flip before this preset price will be ignored. Preset prices could be chosen tactically at resistance levels.
Different time frames of Heikin Ashi flips can be used together. E.g. 10 min, 3 hour or 2 Day time frames. If this is possible within your Tradingview subscription.
Example
The user has a long position (bought at the green arrow.) The user wants to start trailing at price 88 USDT (blue line).
The indicator will only trigger when the following conditions are met:
Cross of red block on the indicator (representing red Heikin Ashi candle)
Price has crossed 88 USDT
If the candlestick turns from a green to a red block, before crossing 88 USDT. It will NOT trigger the alert. Visible as the orange down arrows. In the indicator below it is displayed as a red block.The alert will go off at the red down arrow on 10th Nov (if chosen for Once per bar close). The price condition of 88 USDT was already met at 7th Nov.
Final Words
Disclaimer: Please use it with care and at own risk. The owner of this indicator is not liable for any financial losses.
Past performance is no guarantee of future returns.

Trailing Stoploss Bottom ActivationThe Basics
The indicator is visible on the chart as circles above and below the bar.
It will trigger an alert when the current price goes below, the low of the previous candle.
Or an alert when current price goes above, the high of the previous candle.
The indicator can be used as a trailing stoploss for (DCA/ TV) bots.
The distance between the circles and candlesticks can be adjusted. If the user prefers to set an alert e.g. a few ticks lower than the candle bottom.
What Makes It Different
The user can preset the price (of the asset e.g. BTC), where it will start looking for the condition: current price is below previous candle low (when in long position). Current price is above previous candle high (when short).
Example
In the chart above MATIC/BUSD the user has drawn a blue line at 1.70. Since there is where he expects resistance.
The user has a long position (bought at the green arrow.) The user wants to start trailing at price 1.70.
The alert will only trigger when the following conditions are met:
Condition 1 - Crossed 1.70
Condition 2 - Current candle price is below previous candle low.
In the chart above price crossed above 1.70 on 26th Oct. Current candle price (at that moment) went below previous candle low on 27th Oct, indicated with a red arrow. Here the alert will go off at 1.659 BUSD (indicated in pink).
It ignores the other two lows, indicated with orange arrows. Because condition 1 is not met.
It is possible to use multiple time frames at the same time. Some time frames might not be available depending on your Tradingview subscription.
Final Words
Disclaimer: Please use it with care and at own risk. The owner of this indicator is not liable for any financial losses.
Past performance is no guarantee of future returns.

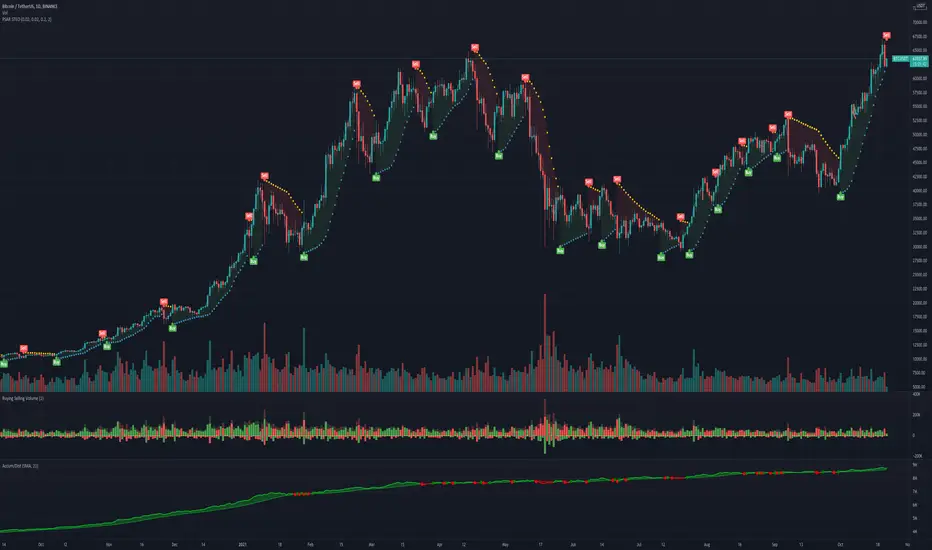
Supertrend NinjaSupertrend Ninja
The Basics
The Supertrend Ninja is a trend-following indicator. The indicator is optimised for daily, 2 days and 3 days candlesticks and can be used on varying trending markets.
Supertrend Ninja using 2 days candlesticks only gave 7 bullish signals in 2020 and 2 in 2021 for Bitcoin/USDT (based on Binance charts). Greatly reducing false signals. It can be used on lower time frames as well, although you will encounter more noise.
This indicator could be used as a compass for DCA or TV bots as well.
What To Look For
When the background of the candlestick closes green with an upwards pointing pink arrow. It indicates a possible bullish (up)trend. To enter a trade its best to place an order a few ticks above the candle high. This way we only enter a position, when there is trend continuation.
When the background of the candlestick closes red with a downwards pointing black arrow. It indicates a possible bearish (down)trend. To enter a trade its best to place an order a few ticks below the candle low.
Exits can be determined by Fibonacci extensions, orderblocks or other resistances to name a few. Or exit the trade when the opposite background color appears.
Final words
Disclaimer: Please use it with care and at own risk. The owner of this indicator is not liable for any financial losses.
Past performance is no guarantee of future returns.

RSI Levels, Multi-TimeframeThe relative strength index (RSI) is a momentum indicator that measures the magnitude of recent price changes to evaluate overbought or oversold conditions. RSI is normally displayed as an oscillator separately from price and can have a reading from 0 to 100. This indicator takes the RSI and plots the 30 & 70 levels onto the price chart so you can see when price is going to meet the 30 or 70 levels. The reason the 30 & 70 levels are important is because many traders (and bots) use those as signals to buy (at 30 RSI) or sell (at 70 RSI). Additionally, this indicator allows you to display not just the RSI levels of your currently viewed timeframe on the chart, but also shows the RSI levels of up to 6 different timeframes on the same chart. This allows you to quickly see if multiple RSI levels are aligning across different timelines, which is an even stronger indication that price is going to change direction when it meets those levels on the chart. There are a lot of nice configuration options, like:
Style customization (color, thickness, size)
Labels on the chart so you can tell which plots are the RSI levels
Optionally display the plot as a horizontal line if all you care about is the RSI level right now
Toggle overbought (RSI 70) or oversold (RSI 30) on/off completely

WaveTrend 4h/24mWaveTrend 4h/24m is a trading tool based on two WaveTrend timeframes.
For this script the WaveTrend calculations made by LazyBear were used. WaveTrend is a widely used indicator for finding direction of an asset.
The strategy is developed by Youtuber Jayson Casper. The main strategy on the 4 hour and 24 minute timeframes, this will be the default timeframes. Timeframes can be adjusted in the indicator interface.
With Jaysons' we wait for both timeframes to have last printed a green dot for longs, and both timeframes to have last printed a red dot for shorts. When this occurs a green diamond will be printed for longs, a red diamond for shorts.
Make sure to always use the chart from the smallest timeframe you're using, so by defaults use the 24 minute chart.
Features of the indicator:
- WaveTrend Timeframe 1 (Blue/Lightblue wave).
- WaveTrend Timeframe 2 (Blue/Purple line with filled background between the lines).
- VWAP (Yellow wave which is turned off by default)
- Green/Red Diamonds
What to look for?
This script is all about the Green and Red Diamonds.
A Green diamond will be printed when on both the 4 hour and 24 minute timeframe the last printed dot was a green dot.
A Red diamond will be printed when on both the 4 hour and 24 minute timeframe the last printed dot was a red dot.
What are the Green and Red Diamonds based on?
When both VWAP timeframes are ABOVE 0, a green diamond will be printed. This is equivalent to the last dot on both WaveTrend timeframes being a green dot.
When both VWAP timeframes are BELOW 0, a red diamond will be printed. This is equivalent to the last dot on both WaveTrend timeframes being a red dot.
Happy Trading!

RSI Rising Crypto Trending AlertAlert version of the strategy with the same name
This is crypto and stock market trending strategy designed for long timeframes such as 4h+
From my tests it looks like it works better to trade crypto against crypto than trading against fiat.
Indicators used:
RSI for rising/falling of the trend
BB sidemarket
ROC sidemarket
Rules for entry
For long: RSI values are rising, and bb and roc tells us we are not in a sidemarket
For long: RSI values are falling, and bb and roc tells us we are not in a sidemarket
Rules for exit
We exit when we receive an opposite direction.
Cuation: Because this strategy uses no risk management, I recommend you takje care with it.
If you have any questions, let me know !

ProProfits LongStrategy made ready for automated trading based on Wavetrend/VWAP/RSI.
Whenever a 18 minute timeframe wave reaches below -60 is followed by a 3 minute timeframe VWAP cross up, a long signal will be given.
Once an RSI cross on the 10 minute timeframe above 60 is followed by a red dot on the momentum waves on the 1 minute timeframe, a Take Profit signal will be given.
The timeframes are adjustable in the settings interface, so this automated strategy can be used with any timeframe combination for the Wavetrend/VWAP/RSI.
Always make sure to view the chart from the lowest timeframe you're using.

SteO: PSAR with AlertSteO: PSAR with Alert, based on the existing PSAR but with constant long alerts for trading bots
Manuel Trading Starter Script For WunderbitTHIS CODE IS WRITTEN FOR WUNDERBIT TRADING
This script can be used for starting a position entry either it is long or short at any time by using alerts.
You need to setup your long and short alerts than pause them. When you decide to enter a position,
simply run the alert you are willing to open a trade either long or short from the alarms control panel.
The script immediately send the alert message to bot via webhook.
The close price must be greather than 0.0000000000001 to open a position.
Dont forget to turn off the alarm after entering the position. Or it will keep sending the alert message each candle.

Rolling VWAP - Vhunt Scalper botBINANCE:ADAUSDTPERP
Modified VWAP to use scalping in lower timeframe.
Use 1minute TF for best results but can also use up to 30min.
This indicator is made for crypto but may also work for other assets.
The bands serve as support and resistance and used for opening quick profit position if conditions below are met:
Indicators:
Blue - modified rolling vwap
Orange - Band1
Green - Band2
Opening position Conditions:
Long:
Band2 < Band1
Price < Band2
Short:
Band2 > Band1
Price > Band2
