EMA ATR Engulfing CandlesThis is good old EMA (Exponential Moving Average) with a twist. The EMA line is surrounded by ATR on either side giving you visibility on how market breadth is working out.
The icing on this cake is in the form of engulfing candle indications. Whenever the engulfing candle happens to be inside the size (that's upper and low ATR area limits around EMA) and the engulfing candle has closed in the appropriate direction, the signal triangle comes up. To understand this...
The signal appears only if one of OHLC price point of engulfed and/or engulfing candles are within upper and lower ATR areas around EMA
When there is a bullish engulfing candle, and the close of the candle is above EMA, a green triangle comes up below the candle
When there is a bearish engulfing candle and the close of the candle is below EMA, a red triangle comes up above the candle
The settings enable you to set the following
Length of EMA (default is 200)
Length of ATR (default is 12)
Resolution of EMA independent of the chart timeframe (default is Daily)
Price type (default is hlc3)
Trade zone width in number of ATRs on either side of EMA (default is 1)
Other settings to adjust display
I have been using this in different timeframes to generate signals and found that it generates pretty good alpha.
Feel free to write to me if you have any ideas that can improve this further or if you wish to discuss how to properly use this.
Wyszukaj w skryptach "bear"

Probability Bands [Anan]Hello Friends,,,
===================================
This indicator is based on Bayes' Theorem and is fully based on probabilities.
===================================
Formula For Bayes' Theorem:
P(Bull|Bear) = P(Bear∣Bull) * P(Bull) / P(Bear)
where:
Bull and Bear are events and P is probability
P(Bull|Bear) is the posterior probability, the probability of Bull after taking into account Bear
P(Bear∣Bull) is the conditional probability or likelihood, the degree of belief in Bear given that proposition of Bull belief (Bull true)
P(Bull) is the prior probability, the probability of Bull belief
P(Bear) is the prior probability, the probability of Bear belief
===================================
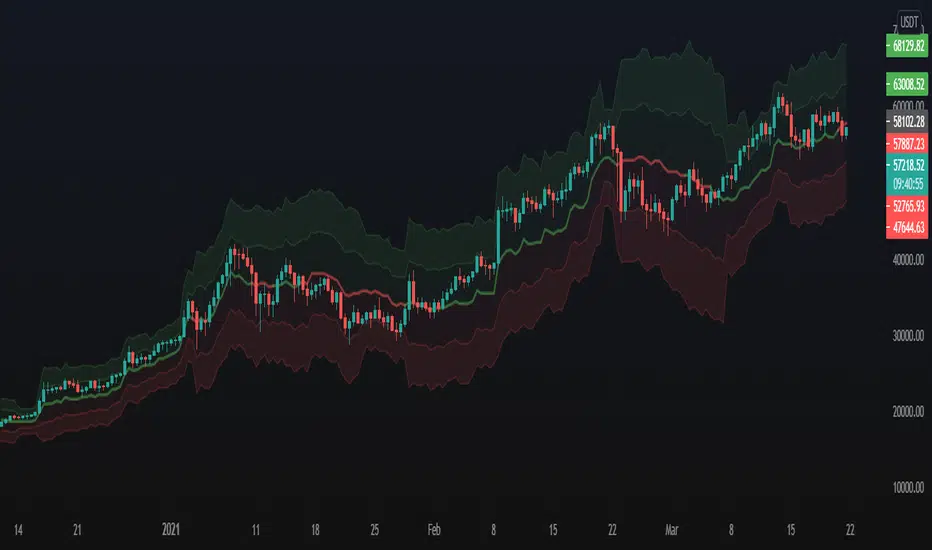
The indicator output one trend lines and (Bull/Bear) Signal :
Bull/Bear Probability Trend :
when the price is above mid line ==> Up Trend
when the price is below mid line ==> Down Trend
And by using ATR deviation multipliers, we can get (Bullish/Bearish) zones
===================================
Disclaimer:
This script is for informational and educational purposes only.
Use of the script does not constitutes professional and/or financial advice.
You alone the sole responsibility of evaluating the script output and risks associated with the use of the script.
===================================
RogTrader Bull Bear StrengthsSimplified Bull/Bear Strengths Indicator uses price action, volume flow, and candlesticks to calculate bull and bear strengths, also known as buying and selling pressures.
Green/Red Volume Bars can be misleading at times
This indicator shows the net bull/bear power
Recommended to be used in combination with indicators to find reversal signals.
For example, during an uptrend, a long red bar indicates that strong selloff has started, and bears begin to control the bargains.

[blackcat] L2 Bull Bear Convergence Divergence (BBCD)Level: 2
Background
A bull market is gaining ground and is economically sound, while a bear market is declining and most stocks are depreciating. The actual origins of these terms are unclear, but one reason could be that bulls attack by pulling their horns up while bears attack by brushing their paws down.
Function
L2 Bull Bear Convergence Divergence (BBCD) disclose the convergence divergence of the bull bear as a market opinion indicator. It tells you the opinion of those who are directly involved with the markets. As a trader, understanding how the convergence divergence of the bull bear works can be of great help. I inherited the traditional MACD expression method, and added golden cross (yellow cross) and dead cross (fuchsia cross) prompts, as well as bottom divergence (lime cross) and top divergence (red cross) prompts.
Key Signal
bbd --> bull bear fast line
bbdsupport --> bull bear slow line and support level
bbdgx --> bull bear gold cross in yellow
bbddx --> bull bear dead cross in fuchsia
bbotdiverg --> bull bear bottom divergence alert in lime cross
btopdiverg --> bull bear top divergence alert in red cross
Pros and Cons
Pros:
1. it can help to see the strength change of a trend in time
2. visual bottom and top divergence alerts are provided
Cons:
1. it disclose the strength change better than price change
Remarks
Bull Bear Convergence Divergence (BBCD) is new.
Readme
In real life, I am a prolific inventor. I have successfully applied for more than 60 international and regional patents in the past 12 years. But in the past two years or so, I have tried to transfer my creativity to the development of trading strategies. Tradingview is the ideal platform for me. I am selecting and contributing some of the hundreds of scripts to publish in Tradingview community. Welcome everyone to interact with me to discuss these interesting pine scripts.
The scripts posted are categorized into 5 levels according to my efforts or manhours put into these works.
Level 1 : interesting script snippets or distinctive improvement from classic indicators or strategy. Level 1 scripts can usually appear in more complex indicators as a function module or element.
Level 2 : composite indicator/strategy. By selecting or combining several independent or dependent functions or sub indicators in proper way, the composite script exhibits a resonance phenomenon which can filter out noise or fake trading signal to enhance trading confidence level.
Level 3 : comprehensive indicator/strategy. They are simple trading systems based on my strategies. They are commonly containing several or all of entry signal, close signal, stop loss, take profit, re-entry, risk management, and position sizing techniques. Even some interesting fundamental and mass psychological aspects are incorporated.
Level 4 : script snippets or functions that do not disclose source code. Interesting element that can reveal market laws and work as raw material for indicators and strategies. If you find Level 1~2 scripts are helpful, Level 4 is a private version that took me far more efforts to develop.
Level 5 : indicator/strategy that do not disclose source code. private version of Level 3 script with my accumulated script processing skills or a large number of custom functions. I had a private function library built in past two years. Level 5 scripts use many of them to achieve private trading strategy.

Divergence+ [MS]Divergence indicator for any asset and any time frame that shows bullish and bearish regular (dotted) and hidden (dashed) divergences.
Simple to use, just add to your chart and select the size of divergences you want to see.
Scalping? Use a lower number.
Swing trading? Use a higher number.
Set alerts on when divergences appear.
Settings
• Set the divergence size
• Show hidden divergences
• Show signals with divergences
Use the link below or PM us to obtain access to this indicator.

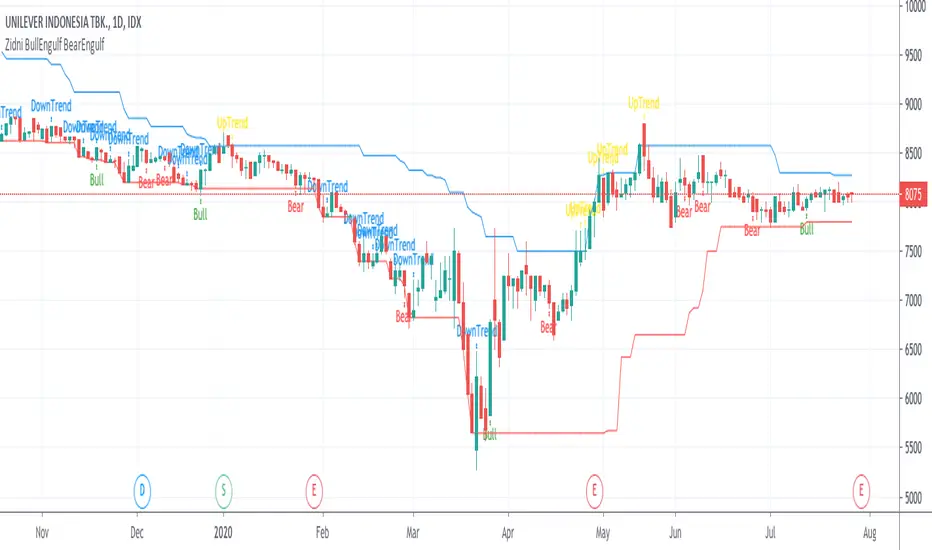
Zidni BullEngulf BearEngulfBullish Engulfing candle that considers the length of the candle and the position of the candle in a downtrend.
Bearish Engulfing candle that considers the length of the candle and the position of the candle in an uptrend.
Probability: Bull/Bear Dominance | Ratio | Bar CountIntro
What's the probability of the next bar being red? How about green? Well, there are many ways to quantify the probability but I am presenting just one stupidly simple (but generally accurate) way to measure it.
Strangely... no one has done this before that I can find. I try to check if someone else has done it first (Pro Tip: Plz do this. We honestly don't need the 5 trillionth "MTF MAs" script.)
Indicator
Its a basic counting script, but the nice thing about this script is you choose the time range. It starts counting from a specified point of your choosing. It counts up the bull bars and bear bars separately.
Bull Bar = Close > Open
Bear Bar = Open > Close
You can look at them in sum or as a ratio of Green Bars : Red Bars
I know, it's almost too simple. But, here's some interesting food for thought from a layman to fellow laymen.
Analysis/Edge
Between the time of candle open and candle close, the price can do one of three things, close higher, close lower, or close equal to.
'Equal to' is rare on higher timeframes in liquid markets and it provides no useful information. Thus, we'll nix it for purposes of this conversation.
So boil it down. The next candle is going to be a red candle or a green candle.
It is popular to refer to the general probability of most candles as 50/50, with trader's mission in life being to seek an edge that tilts the probabilities slightly in their favor.
The truth is the odds are probably never actually 50/50, but knowing the precisely correct probability is unknowable, just like the accuracy of a weather forecast is inherently unknowable. What we're trying to do as traders is develop systems that give us predictive probabilistic outcomes that correspond with future realities based on various ways of measuring the market (most often heavily dependent on the past).
The reality is that the market can be measured in many, many different ways. The important thing is that you measure it in a way that is accurate, relevant, and universally applicable.
So look at this indicator here:
You start from a point in time on a chosen timeframe and you put red bars in the red column, green in the green column, and count them all up.
Then you make a ratio, in this case, Green : Red.
What the ratio shows you is the percentage of green bars compared to red bars . At the time of this screenshot, the 4h on the SPX starting from the 2020 bottom is showing a ratio of 1.2.
This means there have been 20% more green bars than there have been red bars.
Now there are 1,000 directions you can take this discussion. What is the overall volatility picture, the size of the red bars vs the green bars, what happens if you miss out on the 5 biggest green bars... so many more variables that you would need to take into account to develop a true edge from this idea. But, the bottom line fact (which is what I like about this) is that we can take this data and say with a certain level of confidence that on the SPX you have a 20% better shot at making money (otherwise stated there's a 60/40 chance) if you open a LONG trade at the beginning of a 4h candle than if you open a short.
That's useful information. One could argue that it's not a complete strategy in and of itself (although I bet it could be with a couple of additional parameters). But I can tell you, based on the 4h candles in the 2020 rally if you open a short, the deck is stacked against you from this perspective. And we can actually somewhat demonstrate this to be true for our dataset because we can look at the price history and see who likely made more money. The SPX is up 1000pts off the bottom. So, thus far, for this dataset, it rings true; Bulls have been doing way better in the latter part of 2020 than the bears.
Conclusion
Predictive systems with a small number of variables tend to be more robust than a system with many variables when applied to a complex system. I may keep updating this script if people like it and determine aspects like population vs sample size, confidence intervals, volatility, and exclusion of outliers. For now, this is just an opening foray into the basic idea of how we can establish an edge in the markets. It really can be this simple.
Thanks for Reading.

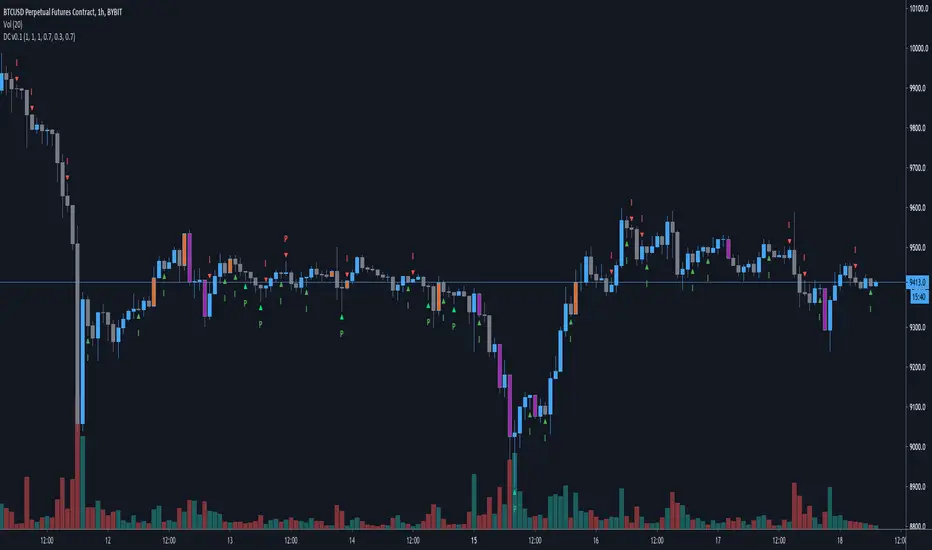
DC v0.1Hey traders!
This is a simple script to show some information about the candles on your screen.
Currently it shows:
- Pinbars
- Inside bars
- Bullish engulfing candles
- Bearish engulfing candles
Quick explanation about the settings:
- Wick to candle range ratio (default 0.7): Pinbar wick needs to be at least 70% of the candle range
- Part of wick that stands out to previous candle (default 0.3): Pinbar wick needs to end at least 30% above/below previous candle to stand out to that candle
- Engulfing candle body to range ratio (default 0.7): Engulfing candle needs to have at least 70% body to show strength
Let me know if you have suggestions, improvements or issues!
Bullish and Bearish Engulfing and RSI, DMI and PSAR confirmationThe study combines Bearish and Bullish Engulfing pivot strategy with strong trend confirmative indicators:
Directional Movement Index (DMI)
Parabolic SAR
RSI Bands
Engulfing patterns in market provide a useful way for traders to enter the market in anticipation of a possible reversal in the trend. Engulfing candles tend to signal a reversal of the current trend in the market. This specific pattern involves two candles with the latter candle "engulfing" the entire body of the candle before it. The engulfing candle can be bullish or bearish depending on where it forms in relation to the existing trend
The indicator can be applied to trading pairs with USD, USDT, ETH and BTC quote currencies. Indicator supports spot, futures and marginal trading exchanges. It calculates and compares values of the price action candles to define is there an engulfing and what type it is: bullish or bearish:
If there is a bullish engulfing the indicator fills price action candle with yellow color
If there is a bearish engulfing the indicator fills price action candle with purple color
Advantages of this indicator:
1. This indicator reveals presence of both types of engulfing simultaneously
2. Weak engulfment signals and market noises are filtered by RSI bands, DMI and PSAR confirmations. This allows to receive only strong and confirmed engulfments
3. This indicator includes both
Study with built-in custom alerts to use with your own software through web hook connection.
Strategy with configurable risk management settings (order size, commission, take profit, stop loss and trailing). This provides you opportunity of direct broker connection and allows to conduct backtests before applying the strategy to real account
At the chart you can see the historical price action of XBTUSD at BitMEX exchange from 9th of May 2020 till 17th of May 2020 indicator. Moments when the indicator triggered to enter a position are described with message clouds. Moments when a certain position should be closed are highlighted with circles and commented with clouds
How to use?
Long signals:
1. Apply indicator to the trading pair your are interested in
2. Once bullish engulfing conditions are met price action candle will be colored yellow.
3. Once price action breaks RSI resistance band, retraces and closes below the band the signal is finished and the position should be closed
Short signals:
1. Apply indicator to the trading pair your are interested in
2. Once bearish engulfing conditions are met price action candle will be colored purple.
3. Once price action breaks RSI support band, retraces and closes above the band the signal is finished and the position should be closed
Automatic strategy:
When conditions of long or short position from the strategy are met the script opens position.
Strategy.exit closes the position once risk management settings are met.
Strategy.close closes the position once RSI band rejection is confirmed
If you want to obtain access to the indicator please send us a personal message
Best regards,
SkyRock Signals team

Bulls vs BearsThe script measures relative strenth of bull bars vs bear bars that complete the next rules:
1) rising price with rising volume calculates as bullish only if the next candle is higher
2) falling price with falling volume calculates as bullish only if the next candle is higher
3) rising price with falling volume calculates as bearish only if the next candle is lower
4) falling price with rising volume calculates as bearish only if the next candle is lower
examples
ethusdt
shitperp
bsvusdt
btcusdt

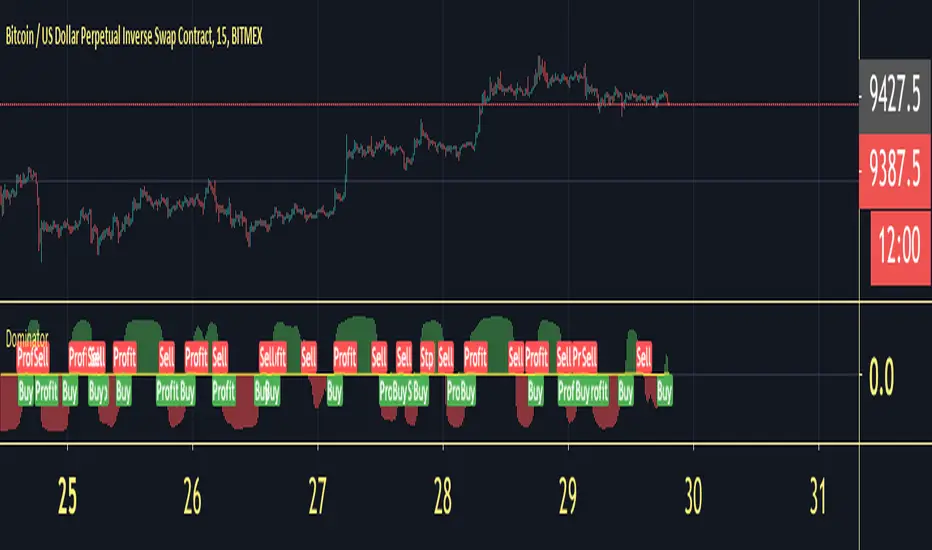
DominatorDo investors appreciate a good animal mascot? It seems like it. Bull and bear markets are key investing lingo and symbols, capturing positive feelings (bull) or negative ones (bear). There’s no official rule, but a bull market tends to refer to a 20% increase in a market over time from its bottom, while a bear represents a 20% decrease from its top. In general, “bull” positivity or “bear” negativity can refer to upward or downward movements of almost anything, like individual stocks. And you’ll even notice investors saying they’re “bullish” on an industry with growth potential or “bearish” on a stock they think will drop.
Dominator will give you the calculation of the wave between Bull&bear
How to use :
Long Alert signal = Bull Wave on the market
Short Alert signal = Bear wave on the market
Apply these fundamentals to any time frame and you will be able to read the correction into the trend or even the trend reversals.
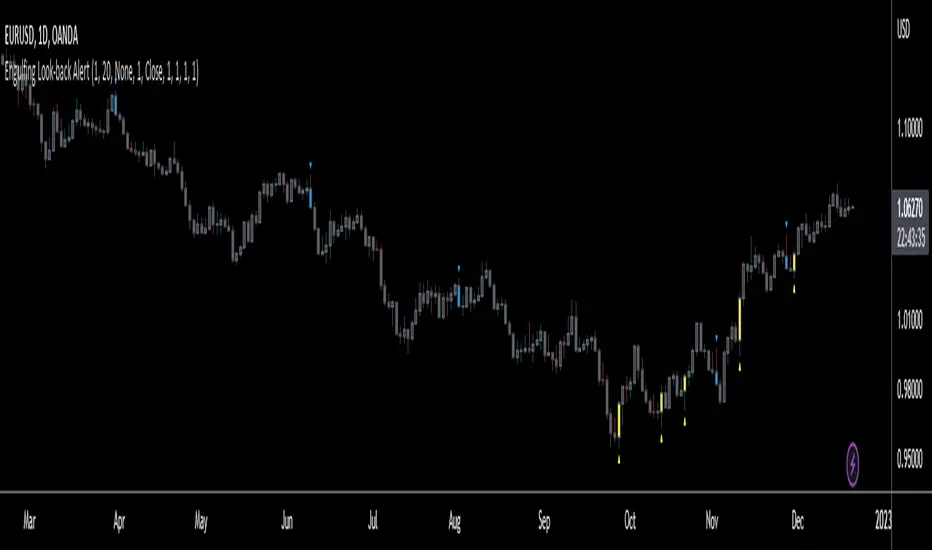
Engulfing Look-back AlertThis script is an extension of the classical engulf pattern with added rules and user defined features.
Engulfing Candle Definition:
- Bullish Engulfing: Trade BELOW the prior candle's LOW and CLOSE ABOVE the prior candle's HIGH. Previous candle can be an up (bullish) or a down (bearish) candle
- Bearish Engulfing: Trade ABOVE the prior candle’s HIGH and CLOSE BELOW the prior candle’s LOW. Previous candle can be an up (bullish) or a down (bearish) candle
Features:
- Set the look-back period for engulfing candle high and low -> default = 1; e.g. Did the bullish eng candle trade below the lows of the last 3 candles and trade above the highs of the last 4 candles? Set the input values accordingly
- Choose time frame(s) engulfing candle is to be displayed on -> default = M/W/D/4H/1H/15M
- Ability to enable Alerts (includes time frame alert was triggered on): IMPORTANT - when setting alerts ensure to choose "ONCE PER BAR"; otherwise alerts will NOT trigger as intended
prntscr.com
Red and Green Ignored Bar by Oliver VelezOn this occasion I present a script that detects Ignored Red Candles and Ignored Green Candles, basically it is a Price Action event that indicates a possible continuation of the current trend and gives the opportunity to climb it with a Very tight risk, before delving into detail I would like to leave this note:
Note: the detection of this event does not guarantee that the signal will be good, the trader must have the ability to determine its quality based on aspects such as trend, maturity, support / resistance levels, expansion / contraction of the market, risk / benefit, etc, if you do not have knowledge about this you should not use this indicator since using it without a robust trading plan and experience could cause you to partially or totally lose your money, if this is your case you should train before If you try to extract money from the market, this script was created to be another tool in your trading plan in order to configure the rules at your discretion, execute them consistently and have AUTOMATIC ALERTS when the event occurs, which is where I find more value because you can have many instruments waiting for the event to be generated, in the time frame you want and without having to observe the mer When the alert is generated, the Trader should evaluate the quality of the alert and define whether or not to execute it (higher timeframes, they can give you more time to execute the operation correctly).
Let's continue….
This event was created by Oliver Velez recognized trader / mentor of price action, the event has a very interesting particularity since it allows to take a position with a very limited risk in trend movements, this achieves favorable operations of good ratio and small losses when taking An adjusted risk, if the trade works, a good ratio is quickly achieved and we agree with a key point in the “Keep small losses and big profits” trading, this makes it easier to have a positive mathematical hope when your level of Success is not very high, so leave you in the field of profitability.
THE EVENT:
The event has a bullish configuration (Ignored Red Candle) and a bearish configuration (Ignored Green Candle), below I detail the “Hard” rules (later I explain why “Hard”):
1- Last 3 bars have to be GREEN-RED-GREEN (possible bullish configuration) or RED-GREEN-RED (possible bearish configuration), the first bar is called Control Bar, the second is called Ignored Bar and the third Signal Bar as shown in the following image:
2- Be in a trend determined by simple moving averages (Slow of 20 periods and Fast of 8 periods), as a general rule you can take the direction of MA20 but the Trader has to determine if there is a trend movement or not.
3- Control bar of good range, little tail and with a body greater than 55%.
4- Ignored bar preferably narrow range, little tail and that is located in the upper 1/3 of the control bar.
5- Signal bar cannot override the minimum of the ignored bar.
6- Activation / Confirmation of event by means of signal bar in overcoming the body of the ignored bar.
Some examples of ignored bars (with “Hard” and “Flexible” rules):
Features and configuration of the indicator:
To access the indicator settings, press the wheel next to the indicator name VVI_VRI "Configuration options".
- Operation mode (Filtering Type):
• Filtering Complete: all filters activated according to the configuration below.
• Without Filtering: all filters deactivated, all VRI / VVI are displayed without any selection criteria.
• Trend Filter only: shows only VRI / VVI that are in accordance with what is set in “Trend Settings”
- Configuration Moving Averages:
• See Slow Media: slow moving average display with direction detection and color change.
• See Fast Media: display of fast moving average with direction detection and color change.
• Type: possibility to choose the type of media: DEMA, EMA, HullMA, SMA, SSMA, SSMA, TEMA, TMA, VWMA, WMA, ZEMA)
• Period: number of previous bars.
• Source: possibility to choose the type of source, open, close, high, low, hl2 hlc3, ohlc4.
• Reaction: this configuration affects the color change before a change of direction, 1 being an immediate reaction and higher values, a more delayed reaction obtaining les false "changes of direction", a value of 3 filters the direction quite well.
- Trend Configuration
• Uptrend Condition P / VRI: possibility to select any of these conditions:
o Bullish MA direction
o Quick bullish MA direction
o Slow and fast bullish MA direction
o Price higher than slow MA
o Price higher than fast MA
o Price higher than slow and fast MA
o Price higher than slow MA and bullish direction
o Price higher than fast MA and bullish direction
o Price higher than slow, fast MA and bullish direction
o No condition
• Condition P / VVI bear trend: possibility of selecting any of these conditions:
o Slow bearish MA direction
o Fast bearish MA direction
o Slow and fast bearish MA direction
o Price less than slow MA
o Price less than fast MA
o Price less than slow and fast MA
o Price lower than slow MA and bearish direction
o Price less than fast MA and bearish direction
o Price less than slow, fast MA and bearish direction
o No condition
- Control bar configuration
• Minimum body percentage%: possibility to select what body percentage the bar must have.
• Paint control bar: when selected, paint the control bar.
• See control bar label: when selected, a label with the legend BC is plotted.
- Configuration bar ignored
• Above X% of the control bar: possibility to select above what percentage of the control bar the ignored bar must be located.
• Paint ignored bar: when selected, paint the ignored bar.
- Signal bar configuration
• You cannot override the minimum of the ignored bar: when selected, the condition is added that the signal bar cannot override the minimum of the ignored bar.
• Paint signal bar: when selected, paint the signal bar.
• See arrow: when selected it shows the direction arrow of the possible movement.
• See bear and arrow: when selected it shows bear and arrow label
• See bull and arrow: when selected it shows bull and arrow label
The following image shows the ignored bar and painted signal:
- Take profit / loss
The profit / loss taking varies depending on the trader and its risk / monetary plan, the proposal is a recommendation based on the nature of the event that is to have a small risk unit (stop below the minimum of the ignored bar), look for objectives in ratios greater than 2: 1 and eliminate the risk in 1: 1 by taking the stop to BE, all parameters are configurable and are the following:
• See recommended stop loss and take profit: trace the levels of Stop, BE, TP1 and TP2, as well as their prices to know them quickly based on the assumed risk
• To: select which event you want to draw the SL and TP (VRI, VVI)
• Extend stop loss line x bars: allows extending the stop line by x number of bars
• Extend take profit line x bars: allows extending the stop line by x number of bars
• Ratio to move to break even: allows you to select the minimum ratio to move stop to break even (default 1: 1)
• Take profit 1 ratio: allows you to select the ratio for take profit 1 (default 2: 1)
• Take profit 2 ratio: allows you to select the ratio for take profit 2 (default 4: 1)
- Alerts
• It is possible to configure the following alerts:
-VRI DETECTED
-VVI DETECTED
-VRI / VVI DETECTED
Final Notes:
- The term hard rules refers to the fact that an event is sought with the rules detailed above to obtain a high quality event but this brings 2 situations to consider, less
number of events and events that are generated in a strong impulse may be leaked, a very large control bar followed by an ignored narrow body away from moving averages, despite having a good chance of continuing, taking a stop very tight in a strong impulse you can touch it by the simple fact of the own volatility at that time.
- The setting of the parameters “Minimum body percentage% (control bar)”, “Above x% of the control bar (bar ignored)” and “Cannot override the minimum of the ignored bar” can bring large Benefits in terms of number of events and that can also be of high quality, feel free to find the best configuration for your instrument to operate.
- It is recommended to look for trending events, near moving averages and at an early stage of it.
- The display of several nearby VRIs or VVIs in an advanced trend may indicate a depletion of it.
- The alerts can be worked in 2 ways: at the closing of the candle (confirms event but the risk unit may be larger or smaller) or immediately the body of the ignored bar is exceeded, in case you are operating from the mobile and miss many events because of the short time I recommend that you operate in a superior time frame to have more time.
- The indicator is configured with “flexible” rules to have more events, but without any important criteria, each trader has to look for the best configuration that suits his instrument.
- It is recommended to partially close the operation based on the ratio and always keep a part of the position to apply manual trailing stop and try to maximize profits.
The code is open feel free to use and modify it, a mention in credits is appreciated.
If you liked this SCRIPT THUMB UP!
Greetings to all, I wish you much green!


RSI DIVRSI divergence Detector
What is Divergence :
The word divergence itself means to separate and that is exactly what we are looking for today. Typically RSI will follow price as the EURUSD declines so will the indicator. Divergence occurs when price splits from the indicator and they begin heading in two different directions.
How to use :
Use the H Plot means Hidden divergence condition
Use the R Plot means Regular divergence condition
Red R above bar = Regular Bearish
Green R below bar = Bullish
Blue H Below bar = Hidden Bullish
Orange H above bar = Hidden Bearish

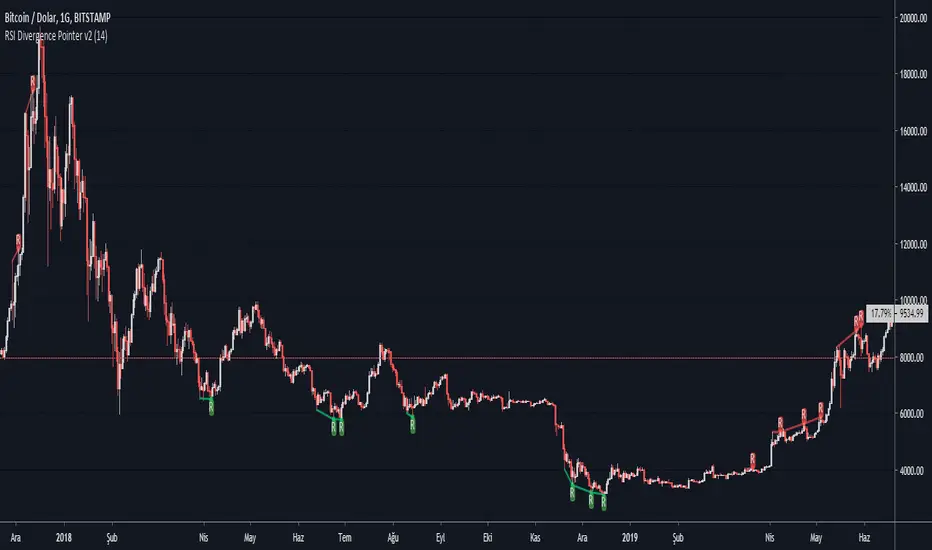
RSI Divergence Pointer v2This script points regular and optionally hidden types of bullish and bearish RSI divergences on the chart by drawing the divergence lines and optionally labels.
Hidden divergence is disabled by default, it can be enabled over settings window.
There is an option to display the price channel additionally.
Added alerts for 4 types of divergences
Titles and messages are the same:
"Regular Bearish Divergence"
"Regular Bullish Divergence"
"Hidden Bearish Divergence"
"Hidden Bullish Divergence"
Bulls vs BearsA tool with the purpose for better insight of bulls/bears influence.
The center, more bright part are the open-close prices, filled green if bullish, red if bearish.
The transparent red and green part, above and below, are the "wick/shadow" area's.
If for example the bears push the price down, far under the open, but the bulls push it right back, so you'll have a large wick,
this will be visible as a large transparent green area below the brighter open-close center area.
Hope this helps!
BOSS Relative Strength MeterTHE BEST FOREX, STOCKS, COMMODITIES , AND CRYPTO INDICATORS FOR TRADINGVIEW.COM
The relative strength meter (RSM) is a momentum indicator that measures the magnitude of recent price changes to evaluate overbought or oversold conditions in the price of a stock or other asset.
The RSM is displayed as a color coded meter.
GREEN: Bullish Uptrend
RED: Bearish Downtrend
YELLOW: Disbursement
Highlights:
Add to any chart or time frame
Prints on the current bar in real time
DOES NOT repaint several bars after the fact
Freedom to Tune
User can change colors
Available Here: bosscripts.com
7_Day Trial: bosscripts.com

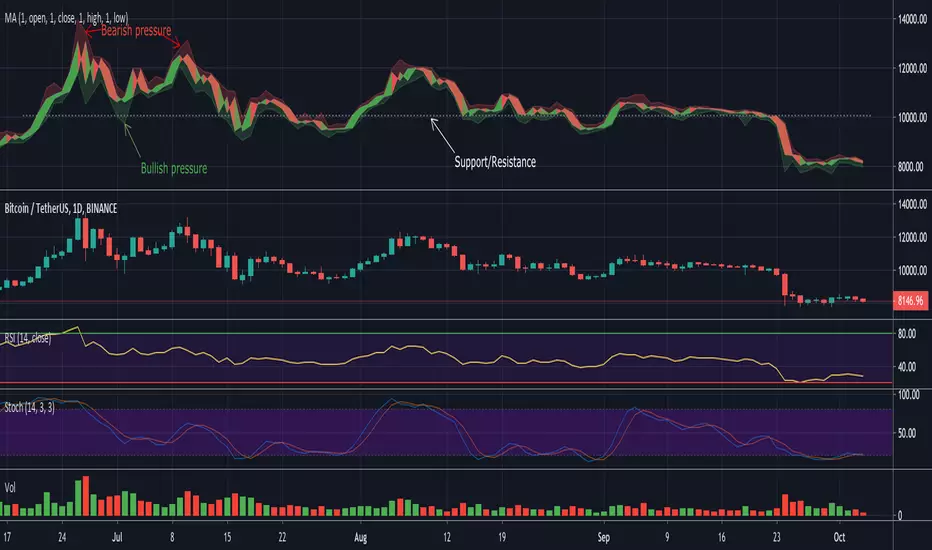
Modiied Elder Ray Index(Bull or Bear)Here's a modified version of the Elder Ray Index created by the famed Dr.Alexander Elder. This indicator has proven to be especially helpful lately given the crazy state of crypto.
Slow Moving Average :
The top chart shows the moving average used to filter trends. I recommend using a higher window length(can be adjusted with the 'lenSlowMA' input option). I wanted this to be a very smooth moving average, so I used the following formula:
slow MA = ema(vwma(close, 64), 64)
This resulted in a pretty smooth line that still detects major price movements very well.
-The background and bar colors both change in response to the Slow MA's value. The background and bars change to green when a bullish trend is detected and red when bearish.
Bear and Bull Power :
To balance things out a little, I included two histogram's based on Elder's Ray. Here, a more responsive EMA with a shorter window length is used to calculate the bull and bear power values and track short-term price fluctuations.
NOTE: The length of the EMA used here can be adjusted in the input menu.
Bull Power = current high - EMA(close, 13)
Bear Power = current low - EMA(close, 13)


#115 OBZ Bull/Bear PowerOBZ represents an attempt to measure the power coming from bulls and bears. When the signal breaks the set threshold, the dominance is likely to be reversed and a corresponding long/short signal is fired.
With up to three layers of analysis, OBZ is one of the most complete indicators in the market. Not only it's great to establish the current dominance, it is also a valuable tool to spot divergences and anticipate the end of the trend.
Access is granted to CryptoSociety Team and members of their community.

Stoch-RSI Divergence PointerThis script points regular and optionally hidden types of bullish and bearish Stoch-RSI divergences on the chart by drawing the divergence lines and optionally labels.
Hidden divergence is disabled by default, it can be enabled over settings window.
Regular divergence is enabled by default, it can be disabled over settings window.
There is an option to display the price channel additionally.

Bull/Bear CandleThis script will display a small triangle under the latest two candles to indicate whether that candle is bullish or bearish based on the following definition.
A bullish candle closes in the top portion of the trading range of the candle while a bearish candle closes in the bottom portion of the trading range of the candle.
The cutoff is currently set at 65% (you can adjust it) so the close must be outside or equal to 65% of the trading range to be considered bullish or bearish. If less than 65% the triangle will indicate a neutral candle.
Colours are;
green triangle = bullish candle
red triangle = bearish candle
yellow triangle = neutral candle
I hope this helps those using TraderCobb's cradle strategy.