Momentum Reversal / Dip Buyer [Score Based]Strategy Overview
Momentum Reversal / Dip Buyer is a quantitative reversal engine designed to fade stretched moves and buy dips / sell rallies when multiple momentum and context factors line up. It’s built for liquid instruments especially for ticker CME_MINI:ES1! and works best on intraday timeframes like the 5-minute or 1-minute chart.
Core Logic
This strategy builds a composite Momentum Score by combining:
Price Location: Relative to 100 SMA, 1000 EMA, and VWAP (trend / regime filter).
RSI: Overbought/oversold and mid-zone strength.
VWMO (Volume-Weighted Momentum): Direction and strength of volume-weighted price drift.
ADX: Trend strength filter (high vs low trend environment).
Full Stoch (%K): Short-term exhaustion and mean-reversion context.
CCI: Overbought/oversold turns (key trigger).
MFI: Volume-confirmed buying/selling pressure.
ATR Regime: High vs low volatility environment.
Cumulative Delta: Whether net aggressor flow is rising or falling.
From this, a single Momentum Score is computed each bar:
Longs: Taken when the score is depressed (scoreLow) and CCI crosses up from oversold.
Shorts: Taken when the score is elevated (scoreHigh) and CCI crosses down from overbought.
Risk Management & Trade Logic
Max Daily Trades: Hard cap on entries per day.
Hard Stop: Fixed % stop based on entry price.
Profit Target: Target ATR Multiplier × main ATR from entry.
Breakeven Logic: Optional; moves stop to breakeven (plus optional offset) after price moves a configurable multiple of the main ATR in your favor.
Trailing Stop (Separate ATR): Optional; uses its own ATR length and ATR-based trigger and distance. This lets you run slower ATR for targets while using a tighter, more reactive ATR for the trail.
Session Control
Trading Window: Optional session filter (e.g., 09:30–16:00). Entries are only allowed inside the defined window.
Force Flat at Session End: Option to automatically close all open positions when the session ends.
Visuals
The script plots entry arrows and a compact dashboard displaying: current Momentum Score, daily trade usage, and CCI status.
Disclaimer:
This script is for educational and research purposes only and is not financial advice. Past performance does not guarantee future results. Always forward-test and adjust parameters to your own risk tolerance and market.
Shoutout and all credit goes to AuclairsCapital for building the base foundation of this strategy on ThinkScript
Wyszukaj w skryptach "bar"

Adaptive Alligator - Asymmetric MH (Entry Only)
Adaptive Alligator – Asymmetric Mexican Hat (Entry Only)
This strategy combines adaptive cycle detection (wavelet + autocorrelation), directional entropy, and a Mexican Hat filter to generate highly selective LONG entry signals. Exits are based solely on the Alligator structure. The system is designed to detect asymmetric, strong, and accelerating bullish phases while filtering out market noise.
1. Adaptive Cycle Detection: The strategy analyzes the median price using wavelet decomposition (Haar, Daubechies D4/D6, Symlet 4), wavelet detail energy, and autocorrelation. It also incorporates the ratio of short-term to long-term ATR volatility. Based on these components, it computes a dominant_cycle value, which dynamically controls the lengths of the Alligator lines (Jaw, Teeth, Lips). This adaptive behavior allows the Alligator to speed up during trending phases and slow down during noise or consolidation.
2. Directional Entropy: Entropy is measured separately for upward and downward movements within the selected lookback window. The entropy difference: e_diff = entropy_down - entropy_up represents the directional bias of the market. When e_diff > 0, the market shows an organized bullish pressure; when < 0, bearish dominance.
3. Mexican Hat Filter: The Mexican Hat (Ricker Wavelet) acts as a second-derivative filter, detecting local maxima in the acceleration of directional entropy. The filtered output (mh_out) is compared against an adaptive noise level computed as SMA(|mh_out|). A signal is considered strong only when: – mh_out exceeds the adaptive noise level, – mh_out is rising relative to the previous bar. This step is critical for eliminating false signals produced by random fluctuations.
4. Entry Logic: A LONG entry requires all three layers: (1) Alligator structure: Lips > Teeth > Jaw. (2) Directional entropy bias: e_diff > 0. (3) A strong, accelerating Mexican Hat signal confirmed by a user-defined number of bars. Once all conditions are satisfied, a buy_final entry is triggered.
5. Exit Logic: Exits are intentionally simple and rely solely on the Alligator: crossunder(lips, teeth) This clean separation ensures precise, adaptive entries and stable, consistent exits.
6. Visual Components: – Alligator lines: Jaw (blue), Teeth (red), Lips (green), plotted with their characteristic offsets. – Background coloring reflects signal strength: dark green (STRONG BUY), lime (acceleration), yellow (weak bias), transparent otherwise. – A dedicated panel displays e_diff (entropy difference), mh_out (Mexican Hat output), and the adaptive noise band.
7. Diagnostic Table: A compact diagnostic dashboard shows: – MH Value, – Noise Level, – MH Acceleration (YES/NO), – Signal Status (STRONG BUY / ACCELERATING / WEAK / BEARISH). It updates on the last bar, making it suitable for live monitoring.
8. Use Case: This strategy is highly selective and ideal as an entry module within trend-following systems. By combining wavelets, entropy, and adaptive noise modeling, it effectively filters out consolidation periods and focuses only on statistically significant bullish transitions. It can be integrated with various exit frameworks such as ATR stops, channel-based exits, range boxes, or trailing logic.

Hyper Insight MA Strategy [Universal]Hyper Insight MA Strategy ** is a comprehensive trend-following engine designed for traders who require precision and flexibility. Unlike standard indicators that lock you into a single calculation method, this strategy serves as a "Universal Adapter," allowing you to **Mix & Match 13 different Moving Average types** for both the Fast and Slow trend lines independently.
Whether you need the smoothness of T3, the responsiveness of HMA, or the classic reliability of SMA, this script enables you to backtest thousands of combinations to find the perfect edge for your specific asset class.
---
🔬 Deep Dive: Calculation Logic of Included MAs
This strategy includes 13 distinct calculation methods. Understanding the math behind them will help you choose the right tool for your specific market conditions.
#### 1. Standard Averages
* **SMA (Simple Moving Average):** The unweighted mean of the previous $n$ data points.
* *Logic:* Treats every price point in the period with equal importance. Good for identifying long-term macro trends but reacts slowly to recent volatility.
* **WMA (Weighted Moving Average):** A linear weighted average.
* *Logic:* Assigns heavier weight to current data linearly (e.g., $1, 2, 3... n$). It reacts faster than SMA but is still relatively smooth.
* **SWMA (Symmetrically Weighted Moving Average):**
* *Logic:* Uses a fixed-length window (usually 4 bars) with symmetrical weights $ $. It prioritizes the center of the recent data window.
#### 2. Exponential & Lag-Reducing Averages
* **EMA (Exponential Moving Average):**
* *Logic:* Applies an exponential decay weighting factor. Recent prices have significantly more impact on the average than older prices, reducing lag compared to SMA.
* **RMA (Running Moving Average):** Also known as Wilder's Smoothing (used in RSI).
* *Logic:* It is essentially an EMA but with a slower alpha weight of $1/length$. It provides a very smooth, stable line that filters out noise effectively.
* **DEMA (Double Exponential Moving Average):**
* *Logic:* Calculated as $2 \times EMA - EMA(EMA)$. By subtracting the "lag" (the smoothed EMA) from the original EMA, DEMA provides a much faster reaction to price changes with less noise than a standard EMA.
* **TEMA (Triple Exponential Moving Average):**
* *Logic:* Calculated as $3 \times EMA - 3 \times EMA(EMA) + EMA(EMA(EMA))$. This effectively eliminates the lag inherent in single and double EMAs, making it an extremely fast-tracking indicator for scalping.
#### 3. Advanced & Adaptive Averages
* **HMA (Hull Moving Average):**
* *Logic:* A composite formula involving Weighted Moving Averages: ASX:WMA (2 \times Integer(n/2)) - WMA(n)$. The result is then smoothed by a $\sqrt{n}$ WMA.
* *Effect:* It eliminates lag almost entirely while managing to improve curve smoothness, solving the traditional trade-off between speed and noise.
* **ZLEMA (Zero Lag Exponential Moving Average):**
* *Logic:* This calculation attempts to remove lag by modifying the data source before smoothing. It calculates a "lag" value $(length-1)/2$ and applies an EMA to the data: $Source + (Source - Source )$. This creates a projection effect that tracks price tightly.
* **T3 (Tillson T3 Moving Average):**
* *Logic:* A complex smoothing technique that runs an EMA through a filter multiple times using a "Volume Factor" (set to 0.7 in this script).
* *Effect:* It produces a curve that is incredibly smooth and free of "overshoot," making it excellent for filtering out market chop.
* **ALMA (Arnaud Legoux Moving Average):**
* *Logic:* Uses a Gaussian distribution (bell curve) to assign weights. It allows the user to offset the moving average (moving the peak of the weight) to align it perfectly with the price, balancing smoothness and responsiveness.
* **LSMA (Least Squares Moving Average):**
* *Logic:* Calculates the endpoint of a Linear Regression line for the lookback period. It essentially guesses where the price "should" be based on the best-fit line of the recent trend.
* **VWMA (Volume Weighted Moving Average):**
* *Logic:* Weights the closing price by the volume of that bar.
* *Effect:* Prices on high volume days pull the MA harder than prices on low volume days. This is excellent for validating true trend strength (i.e., a breakout on high volume will move the VWMA significantly).
---
### 🛠 Features & Settings
* **Universal Switching:** Change the `Fast MA` and `Slow MA` types instantly via the settings menu.
* **Trend Cloud:** A dynamic background fill (Green/Red) highlights the crossover zone for immediate visual trend identification.
* **Strategy Mode:** Built-in Backtesting logic triggers `LONG` entries when Fast MA crosses over Slow MA, and `EXIT` when Fast MA crosses under.
### ⚠️ Disclaimer
This script is intended for educational and research purposes. The wide variety of MA combinations can produce vastly different results. Past performance is not indicative of future results. Please use proper risk management.

W/M Pattern Strategy + MACD/RSI Confirmation V3.0 by ThaungkmitlW/M Pattern Strategy + MACD/RSI Confirmation V3.0
Description Text:
This script is a comprehensive Strategy (backtestable) that combines classical Chart Patterns with momentum indicators to identify high-probability reversal setups. It focuses on detecting "W" Patterns (Double Bottoms/Higher Lows) and "M" Patterns (Double Tops/Lower Highs), filtered by MACD and RSI to reduce false signals.
How It Works
The strategy relies on a "Confluence" of three factors before triggering an entry:
1. Price Action Patterns (W & M)
W Pattern (Bullish): The script detects Pivot Lows. If a new Pivot Low is higher than the previous one (forming a Higher Low structure), it marks a potential "W" pattern.
M Pattern (Bearish): The script detects Pivot Highs. If a new Pivot High is lower than the previous one (forming a Lower High structure), it marks a potential "M" pattern.
2. MACD Confirmation (Zero Line)
Price action alone is not enough. The script waits for the MACD Line to cross the Zero Line:
Buy: MACD crosses UP over 0 (indicating bullish momentum shift).
Sell: MACD crosses DOWN under 0 (indicating bearish momentum shift).
3. RSI Threshold
To ensure the trend has strength, the RSI (Relative Strength Index) acts as a final filter:
Buy Condition: RSI must be above 50.
Sell Condition: RSI must be below 50.
Visual Features
Pivot Labels: Automatically marks Pivot High (Red Triangle) and Pivot Low (Green Triangle).
Pattern Lines: Draws lines connecting the swing points when a potential W or M pattern is detected.
Signals: Displays "BUY" or "SELL" labels with text explaining the setup (e.g., "W+MACD+RSI").
Background: Highlights the chart background (Green/Red) when a valid trade signal occurs.
EMAs: Plots EMA 10 (Blue) and EMA 15 (Red) to help you visualize the immediate trend direction.
Settings
Pivot Left/Right Bars: Adjust the sensitivity of the Swing detection.
MACD Settings: Fast, Slow, and Signal lengths (Standard 12, 26, 9).
RSI Settings: Adjust Length and the Threshold level (Default is 50).
Backtesting
This is a strategy script, meaning you can use the Strategy Tester panel below the chart to see how this logic performs on historical data for your chosen timeframe and asset.
Disclaimer: This tool is for educational purposes. Past performance in backtesting does not guarantee future results.

Robrechtian Long-Medium Breakout Trend SystemRobrechtian Long–Medium-Term Breakout Trend System
A professional, rule-based trend-following strategy designed to capture large, sustained price movements using pure price action and breakouts.
This system follows long-established trend-following philosophy: no prediction, no volatility targeting, and no profit targets. Only disciplined entries, position additions, and exits driven entirely by trend structure.
Core Principles
Breakout-driven entries: Initial positions are taken only when price breaks above/below the 80-day Donchian channel, confirming a long–medium-term trend shift.
Short-term confirmation: Breakouts must also exceed the 20-day channel, reducing false positives.
Trend-direction filter: A 50-day moving average slope filter ensures alignment with the broader trend.
Explosive bar filter: Entries avoid excessively large, single-candle expansions (>2.5× ATR(20)) to prevent chasing exhaustion spikes.
Pyramiding into strength: Additional units are added only when price makes fresh 20-day breakouts in the direction of the trend. No scaling out. No adding on dips.
Exit only on trend violation: Positions are closed exclusively when price breaks the opposite 80-day channel. This preserves unlimited upside while enforcing disciplined exits.
Pure trend philosophy: No volatility targeting, no smoothing, no discretionary overrides, no optimization for short-term performance.
Intended Use
This system is designed primarily for diversified futures portfolios, where diversification across dozens of globally liquid markets creates robustness and stability. However, it may also be used on individual assets for educational and analytical purposes.
The system embraces the core trend-following logic:
Small losses, big winners, and unlimited upside when trends persist.
⚠️ WARNINGS / DISCLAIMERS
⚠️ Warning 1 — This strategy is not optimized for single stocks
The Robrechtian Trend System is designed for multi-asset futures portfolios, not single equities.
Performance on individual tickers may vary greatly due to lack of diversification.
⚠️ Warning 2 — Trend following includes substantial drawdowns
Deep drawdowns are a normal and expected feature of all long-term trend-following systems.
The strategy does not attempt to smooth returns or manage volatility.
If you seek steady, low-volatility equity curves, this system is not suitable.
⚠️ Warning 3 — No volatility targeting or risk smoothing
This system intentionally avoids volatility-based position sizing.
Trades may experience larger fluctuations than systems using risk parity or vol targeting.
⚠️ Warning 4 — Not financial advice
This script is for educational and research purposes only.
Past performance does not guarantee future results.
Use at your own risk.
⚠️ Warning 5 — TradingView backtests have known limitations
TradingView does not simulate:
futures contract roll logic
slippage
real bid/ask spreads
liquidity conditions
limit-up/limit-down behavior
Results may vary from live market execution.

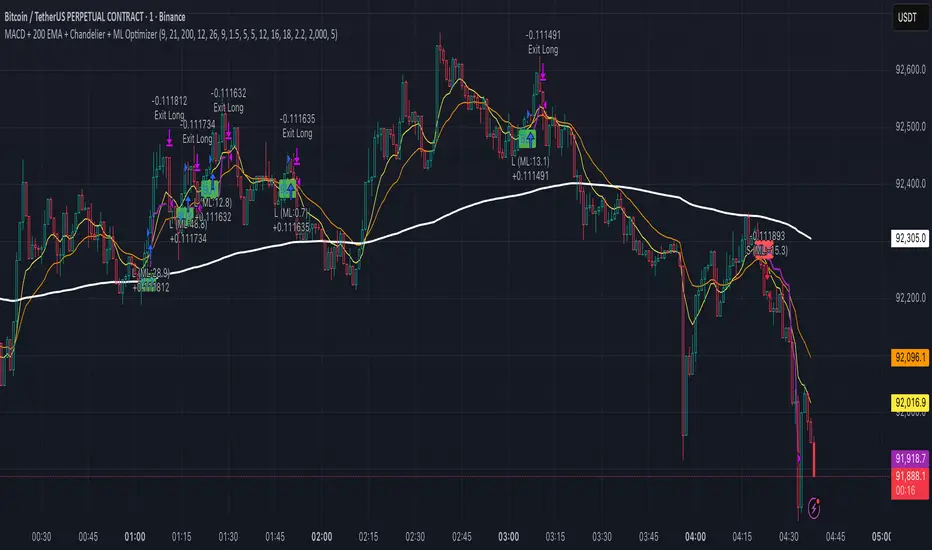
MACD + 200 EMA + Chandelier + ML OptimizerNeural MACD Trend Strategy
This script modernizes a classic high-probability trend strategy by integrating Machine Learning and dynamic risk management. It is built on the foundation of the 9, 21, and 200 EMAs with MACD execution, designed to automate the workflow of trend traders.
Key Features:
1. Core Logic: Trades are executed on MACD crosses, but only when aligned with the long-term trend (200 EMA). An optional setting enforces a simultaneous 9/21 EMA cross for high-momentum confirmation.
2. Machine Learning Optimizer: A K-Nearest Neighbors (KNN) algorithm runs in the background, analyzing RSI, CCI, and ROC. It compares the current setup to the last 1,000 bars of history; if the historical probability is negative, the ML blocks the trade to save capital.
3. Range Filter: Uses ADX to detect choppy markets. If the market is ranging (ADX < 20), the background turns gray and trading is paused.
4. Advanced Exits: Automatically calculates Stop Losses based on recent Swing Highs/Lows. Includes a Chandelier Exit (ATR Trailing Stop) to lock in profits dynamically. You can choose between fixed Reward-to-Risk targets (e.g., 1.5x) or disable targets to ride the trend until the trailing stop is hit.
A13: Micro MAP Scalping StrategyA13: Micro MAP Scalping Strategy — Institutional Breakout Scalper (Pine Script v6 – Protected Source)
A completely original, professional scalping strategy developed from scratch over several months of research and live-market testing. The system is built around institutional breakout zones with a unique multi-stage validation process, strict confirmation requirements, and sophisticated risk management — all designed specifically for 1–15 minute timeframes.
Why this implementation is original and the source code is protected
The entire logic — from breakout detection to entry confirmation, multi-filter stop-loss engines, and dynamic position sizing — was built independently without relying on any existing public libraries, built-ins, or open-source code beyond standard Pine functions. The proprietary validation rules, ATR-scaled gap filtering, and layered confirmation system required extensive original development to achieve consistent performance in real-market conditions. Protecting the source code is necessary to preserve the unique edge that distinguishes this system from standard or publicly available implementations.
Core concepts and methodology (fully transparent — no code revealed)
1. Institutional Breakout Zone Detection
• Real-time identification of high-probability zones using a custom ATR-based minimum gap filter
• Zones are only considered valid when accompanied by clear price displacement and volume confirmation
• No reliance on standard Fair Value Gap or order block libraries — completely custom validation
2. Strict Dual Confirmation Entry Logic
• Entry requires one of two precise conditions:
— Confirmed pullback retest of the validated breakout zone, or
— Clean inside-bar formation fully contained within the zone
• Both conditions must align with the directional bias of the breakout
3. Five Independent Stop-Loss Engines
• ATR-based (default and recommended)
• Swing Low/High levels
• Pivot Point structure
• Trailing Stop with ATR offset
• Fixed percentage
• Every engine includes minimum and maximum stop-loss filters to prevent unrealistic risk during extreme volatility
4. Professional Risk & Position Sizing Engine
• Fixed percentage risk per trade (default 1%)
• Optional compounding mode for growing accounts
• Real-time calculation based on exact stop distance and current equity
• Full integration with leverage settings
5. Multi-Layer Filtering System
• Multi-timeframe EMA filter (default 60-period, fully customizable timeframe)
• Complete trading session control with UTC offset support
• Date range filtering for strategy deployment control
• Consecutive loss protection (optional multi-stop filter)
• Minimum/maximum stop-loss filters to eliminate low-probability setups
6. Real-Time Performance Dashboard
• Live display of win rate, net profit, maximum drawdown, total trades
• Consecutive win/loss streak tracking
• Current position size and average entry price
• All statistics visible directly on chart
Backtesting settings used in the published chart
• Symbol: BTC/USD
• Timeframe: 15-minute
• Initial capital: $10,000
• Risk per trade: 1%
• Commission: 0.04% (realistic for major brokers)
• Slippage: enabled
• Sample size: 200+ trades
These are the exact default Properties settings of the strategy.
The strategy is completely free to add and use on your charts.
#Scalping #Breakout #Intraday #Institutional #RiskManagement #ProfessionalStrategy

BTC Mon 8am Buy / Wed 2pm Sell (NY Time, Daily + Intraday)This strategy implements a fixed weekly time-based trading schedule for Bitcoin, using New York market hours as the reference clock. It is designed to test whether a consistent pattern exists between early-week accumulation and mid-week distribution in BTC price behavior.
Entry Rule — Monday 8:00 AM (NY Time)
The strategy enters a long position every Monday at exactly 08:00 AM Eastern Time, one hour after the U.S. equities market pre-open activity begins influencing global liquidity.
This timing attempts to capture early-week directional moves in Bitcoin, which sometimes occur as traditional markets come online.
Exit Rule — Wednesday 2:00 PM (NY Time)
The strategy closes the position every Wednesday at 2:00 PM Eastern Time, a point in the week where:
U.S. equity markets are still open
BTC often experiences mid-week volatility rotations
Liquidity is generally high
This exit removes exposure before later-week uncertainty and gives a consistent, measurable time window for each trade.
Timeframe Compatibility
Works on intraday charts (recommended 1h or lower) using precise time-based triggers.
Also runs on daily charts, where entries and exits occur on the Monday and Wednesday bars respectively (daily charts cannot show intraday timestamps).
All timestamps are synced to America/New_York regardless of the exchange’s native timezone.
Trading Frequency
Exactly one trade per week, preventing overtrading and allowing comparison of weekly performance across years of historical BTC price data.
Purpose of the Strategy
This is not a value-based or trend-following system, but a behavioral/time-cycle analysis tool.
It helps evaluate whether a repeating short-term edge exists based solely on:
Weekday timing
Liquidity cycles
Institutional market influence
BTC’s habitual early-week momentum patterns
It is ideal for:
Backtesting weekly BTC behavior
Studying time-based edges
Comparing alternative weekday/time combinations
Visualizing weekly P&L structure
Risk Notes
This strategy does not attempt to predict price direction and should not be assumed profitable without robust backtesting.
Time-based edges can appear, disappear, or invert depending on macro conditions.
There is no stop loss or risk management included by default, so the strategy reflects raw timing-based performance.

Trend Breakout & Ratchet Stop System [Market Filter]Description:
This strategy implements a robust trend-following system designed to capture momentum moves while strictly managing downside risk through a multi-stage "Ratchet" exit mechanism and broad market filters.
It is designed for swing traders who want to align individual stock entries with the overall market direction.
How it works:
1. Market Regime Filters (The "Safety Check") Before taking any position, the strategy checks the health of the broader market to avoid "catching falling knives."
Broad Market Filter: By default, it checks NASDAQ:QQQ (adjustable). If the benchmark is trading below its SMA 200, the strategy assumes a Bear Market and suppresses all new long entries.
Volatility Filter (VIX): Uses CBOE:VIX to gauge fear. If the VIX is above a specific threshold (Default: 32), entries are paused, and existing positions can optionally be closed to preserve capital.
2. Entry Logic Entries are based on Momentum and Trend confirmation. A position is opened if filters are clear AND one of the following occurs:
Golden Cross: SMA 25 crosses over SMA 50.
SMA Breakouts: A "Three-Bar-Break" logic confirms a breakout above the SMA 50, 100, or 200 (price must establish itself above the moving average).
3. The "Ratchet" Exit System The exit logic evolves as the trade progresses, tightening risk like a ratchet:
Stage 0 (Initial Risk): Starts with a standard percentage Stop Loss from the entry price.
Stage 1 (Breakeven/Lock): Once the price rises by Profit Step 1 (e.g., +10%), the Stop Loss jumps to a tighter level and locks there. This secures the initial move.
Stage 2 (Trailing Mode): If the price continues to rise to Profit Step 2 (e.g., +15%), the Stop Loss converts into a dynamic Trailing Stop relative to the Highest High. This allows the trade to run as long as the trend persists.
Additional Exits:
Dead Cross: Closes position if SMA 25 crosses under SMA 50.
VIX Panic: Emergency exit if volatility spikes above the threshold.
Settings & Customization:
SMAs: Adjustable lengths for all Moving Averages.
Filters: Toggle Market/VIX filters on/off and choose your benchmark ticker (e.g., SPY or QQQ).
Risk Management: Fully customizable percentages for the Ratchet steps (Initial SL, Stage 1 Trigger, Trailing distance).

Ratchet Exit Trend Strategy with VIX FilterThis strategy is a trend-following system designed specifically for volatile markets. Instead of focusing solely on the "perfect entry," this script emphasizes intelligent trade management using a custom **"Ratchet Exit System."**
Additionally, it integrates a volatility filter based on the CBOE Volatility Index (VIX) to minimize risk during extreme market phases.
### 🎯 The Concept: Ratchet Exit
The "Ratchet" system operates like a mechanical ratchet tool: the Stop Loss can only move in one direction (up, for long trades) and "locks" into specific stages. The goal is to give the trade "room to breathe" initially to avoid being stopped out by noise, then aggressively reduce risk as the trade moves into profit.
The exit logic moves through 3 distinct phases:
1. **Phase 0 (Initial Risk):** At the start of the trade, a wide Stop Loss is set (Default: 10%) to tolerate normal market volatility.
2. **Phase 1 (Risk Reduction):** Once the trade reaches a specific floating profit (Default: +10%), the Stop Loss is raised and "pinned" to a fixed value (Default: -8% from entry). This drastically reduces risk while keeping the trade alive.
3. **Phase 2 (Trailing Mode):** If the trend extends to a higher profit zone (Default: +15%), the Stop switches to a dynamic Trailing Mode. It follows the **Highest High** at a fixed percentage distance (Default: 8%).
### 🛡️ VIX Filter & Panic Exit
High volatility is often the enemy of trend-following strategies.
* **Entry Filter:** The system will not enter new positions if the VIX is above a user-defined threshold (Default: 32). This helps avoid entering "falling knife" markets.
* **Panic Exit:** If the VIX spikes above the threshold (32) while a trade is open, the position is closed immediately to protect capital (Emergency Exit).
### 📈 Entry Signals
The strategy trades **LONG only** and uses Simple Moving Averages (SMAs) to identify trends:
* **Golden Cross:** SMA 25 crosses over SMA 50.
* **3-Bar Breakouts:** A confirmation logic where the price must close above the SMA 50, 100, or 200 for 3 consecutive bars.
### ⚙️ Settings (Inputs)
All parameters are fully customizable via the settings menu:
* **SMAs:** Lengths for the trend indicators (Default: 25, 50, 100, 200).
* **VIX Filter:** Toggle the filter on/off and adjust the panic threshold.
* **Ratchet Settings:** Percentages for Initial Stop, Trigger Levels for Stages 1 & 2, and the Trailing Distance.
### ⚠️ Technical Note & Risk Warning
This script uses `request.security` to fetch VIX data. Please ensure you understand the risks associated with trading leveraged or volatile assets. Past performance is not indicative of future results.

Best Entry Swing MASTER v3 PUBLIC (S.S)Strategy Description (English)
Best Entry Swing MASTER v3 – Quality Mode
The Best Entry Swing MASTER v3 is a structured swing trading and trend-following strategy designed to identify high-probability long and short entries during directional markets.
It combines three core setup types commonly used by momentum and breakout traders:
Breakout (BO)
Pullback Reversal (PB)
Volatility Contraction Pattern (VCP)
The strategy applies multiple layers of confirmation, including multi-EMA trend structure, volatility contraction, volume filters, and an optional market regime filter.
It is suitable for swing trading on higher timeframes (4H, Daily), as well as medium-term trend continuation setups.
Core Concepts
1. Trend Structure
A trend is considered valid when:
Uptrend: Price > EMA20 > EMA50 > EMA100
Downtrend: Price < EMA20 < EMA50 < EMA100
In addition, a simple but effective trend-strength metric is calculated using the percentage spread between EMA20 and EMA100.
This helps avoid signals during sideways or low-volatility environments.
2. Market Regime Filter
The market environment is determined using a higher timeframe benchmark (default: SPY on Daily).
Only long trades are allowed in bullish market conditions
Only short trades in bearish conditions
This significantly reduces false signals in counter-trend conditions.
Entry Logic
Breakout (BO)
A long breakout triggers when:
Price closes above the highest high of the lookback period
Volume exceeds its 20-period average
Trend and market regime confirm
(Optional A+ mode): true volatility contraction is required
Similar logic applies for short breakdowns.
Pullback (PB)
A pullback entry triggers after:
At least two corrective candles
A strong reversal candle (close above previous high for long)
Volume confirmation
Price interacts with EMA20
This structure models classical trend-reentry conditions.
Volatility Contraction Pattern (VCP)
A VCP entry triggers when:
True range contracts over multiple bars
Price holds near the breakout zone
Volume contracts
Trend and market regime are aligned
This setup aims to capture explosive continuation moves.
Quality Modes
The strategy offers two modes:
Balanced Mode
Moderate signal frequency
Broader trend-strength allowance
Suitable for more active traders
A+ Only Mode
Strict confirmation requirements
Only high-quality setups with multiple confluences
Designed to avoid low-probability trades entirely
Risk Management
Risk is managed using an ATR-based stop and target:
Long SL = Close − ATR × 1.5
Long TP = Close + ATR × 3
(Equivalent logic for short positions)
This provides a balanced reward-to-risk profile and avoids overly tight stops.
Early Entry Signals (Optional)
The script offers optional “Early Entry” markers that highlight when a setup is forming but not yet confirmed.
These are not entry signals and are disabled by default for public use.
Intended Use
This strategy is designed for:
Swing trading
Momentum continuation
Trend-following
Multi-day to multi-week trades
It performs best on:
4H
Daily
High-liquidity equities, indices, and futures
Disclaimer
This script is intended for educational and research purposes.
Past performance does not guarantee future results.
Always backtest thoroughly and use appropriate risk management.

Third eye • StrategyThird eye • Strategy – User Guide
1. Idea & Concept
Third eye • Strategy combines three things into one system:
Ichimoku Cloud – to define market regime and support/resistance.
Moving Average (trend filter) – to trade only in the dominant direction.
CCI (Commodity Channel Index) – to generate precise entry signals on momentum breakouts.
The script is a strategy, not an indicator: it can backtest entries, exits, SL, TP and BreakEven logic automatically.
2. Indicators Used
2.1 Ichimoku
Standard Ichimoku settings (by default 9/26/52/26) are used:
Conversion Line (Tenkan-sen)
Base Line (Kijun-sen)
Leading Span A & B (Kumo Cloud)
Lagging Span is calculated but hidden from the chart (for visual simplicity).
From the cloud we derive:
kumoTop – top of the cloud under current price.
kumoBottom – bottom of the cloud under current price.
Flags:
is_above_kumo – price above the cloud.
is_below_kumo – price below the cloud.
is_in_kumo – price inside the cloud.
These conditions are used as trend / regime filters and for stop-loss & trailing stops.
2.2 Moving Average
You can optionally display and use a trend MA:
Types: SMA, EMA, DEMA, WMA
Length: configurable (default 200)
Source: default close
Filter idea:
If MA Direction Filter is ON:
When Close > MA → strategy allows only Long signals.
When Close < MA → strategy allows only Short signals.
The MA is plotted on the chart (if enabled).
2.3 CCI & Panel
The CCI (Commodity Channel Index) is used for entry timing:
CCI length and source are configurable (default length 20, source hlc3).
Two thresholds:
CCI Upper Threshold (Long) – default +100
CCI Lower Threshold (Short) – default –100
Signals:
Long signal:
CCI crosses up through the upper threshold
cci_val < upper_threshold and cci_val > upper_threshold
Short signal:
CCI crosses down through the lower threshold
cci_val > lower_threshold and cci_val < lower_threshold
There is a panel (table) in the bottom-right corner:
Shows current CCI value.
Shows filter status as colored dots:
Green = filter enabled and passed.
Red = filter enabled and blocking trades.
Gray = filter is disabled.
Filters shown in the panel:
Ichimoku Cloud filter (Long/Short)
Ichimoku Lines filter (Conversion/Base vs Cloud)
MA Direction filter
3. Filters & Trade Direction
All filters can be turned ON/OFF independently.
3.1 Ichimoku Cloud Filter
Purpose: trade only when price is clearly above or below the Kumo.
Long Cloud Filter (Use Ichimoku Cloud Filter) – when enabled:
Long trades only if close > cloud top.
Short Cloud Filter – when enabled:
Short trades only if close < cloud bottom.
If the cloud filter is disabled, this condition is ignored.
3.2 Ichimoku Lines Above/Below Cloud
Purpose: stronger trend confirmation: Ichimoku lines should also be on the “correct” side of the cloud.
Long Lines Filter:
Long allowed only if Conversion Line and Base Line are both above the cloud.
Short Lines Filter:
Short allowed only if both lines are below the cloud.
If this filter is OFF, the conditions are not checked.
3.3 MA Direction Filter
As described above:
When ON:
Close > MA → only Longs.
Close < MA → only Shorts.
4. Anti-Re-Entry Logic (Cloud Touch Reset)
The strategy uses internal flags to avoid continuous re-entries in the same direction without a reset.
Two flags:
allowLong
allowShort
After a Long entry, allowLong is set to false, allowShort to true.
After a Short entry, allowShort is set to false, allowLong to true.
Flags are reset when price touches the Kumo:
If Low goes into the cloud → allowLong = true
If High goes into the cloud → allowShort = true
If Close is inside the cloud → both allowLong and allowShort are set to true
There is a key option:
Wait Position Close Before Flag Reset
If ON: cloud touch will reset flags only when there is no open position.
If OFF: flags can be reset even while a trade is open.
This gives a kind of regime-based re-entry control: after a trend leg, you wait for a “cloud interaction” to allow new signals.
5. Risk Management
All risk management is handled inside the strategy.
5.1 Position Sizing
Order Size % of Equity – default 10%
The strategy calculates:
position_value = equity * (Order Size % / 100)
position_qty = position_value / close
So position size automatically adapts to your current equity.
5.2 Take Profit Modes
You can choose one of two TP modes:
Percent
Fibonacci
5.2.1 Percent Mode
Single Take Profit at X% from entry (default 2%).
For Long:
TP = entry_price * (1 + tp_pct / 100)
For Short:
TP = entry_price * (1 - tp_pct / 100)
One strategy.exit per side is used: "Long TP/SL" and "Short TP/SL".
5.2.2 Fibonacci Mode (2 partial TPs)
In this mode, TP levels are based on a virtual Fib-style extension between entry and stop-loss.
Inputs:
Fib TP1 Level (default 1.618)
Fib TP2 Level (default 2.5)
TP1 Share % (Fib) (default 50%)
TP2 share is automatically 100% - TP1 share.
Process for Long:
Compute a reference Stop (see SL section below) → sl_for_fib.
Compute distance: dist = entry_price - sl_for_fib.
TP levels:
TP1 = entry_price + dist * (Fib TP1 Level - 1)
TP2 = entry_price + dist * (Fib TP2 Level - 1)
For Short, the logic is mirrored.
Two exits are used:
TP1 – closes TP1 share % of position.
TP2 – closes remaining TP2 share %.
Same stop is used for both partial exits.
5.3 Stop-Loss Modes
You can choose one of three Stop Loss modes:
Stable – fixed % from entry.
Ichimoku – fixed level derived from the Kumo.
Ichimoku Trailing – dynamic SL following the cloud.
5.3.1 Stable SL
For Long:
SL = entry_price * (1 - Stable SL % / 100)
For Short:
SL = entry_price * (1 + Stable SL % / 100)
Used both for Percent TP mode and as reference for Fib TP if Kumo is not available.
5.3.2 Ichimoku SL (fixed, non-trailing)
At the time of a new trade:
For Long:
Base SL = cloud bottom minus small offset (%)
For Short:
Base SL = cloud top plus small offset (%)
The offset is configurable: Ichimoku SL Offset %.
Once computed, that SL level is fixed for this trade.
5.3.3 Ichimoku Trailing SL
Similar to Ichimoku SL, but recomputed each bar:
For Long:
SL = cloud bottom – offset
For Short:
SL = cloud top + offset
A red trailing SL line is drawn on the chart to visualize current stop level.
This trailing SL is also used as reference for BreakEven and for Fib TP distance.
6. BreakEven Logic (with BE Lines)
BreakEven is optional and supports two modes:
Percent
Fibonacci
Inputs:
Percent mode:
BE Trigger % (from entry) – move SL to BE when price goes this % in profit.
BE Offset % from entry – SL will be set to entry ± this offset.
Fibonacci mode:
BE Fib Level – Fib level at which BE will be activated (default 1.618, same style as TP).
BE Offset % from entry – how far from entry to place BE stop.
The logic:
Before BE is triggered, SL follows its normal mode (Stable/Ichimoku/Ichimoku Trailing).
When BE triggers:
For Long:
New SL = max(current SL, BE SL).
For Short:
New SL = min(current SL, BE SL).
This means BE will never loosen the stop – only tighten it.
When BE is activated, the strategy draws a violet horizontal line at the BreakEven level (once per trade).
BE state is cleared when the position is closed or when a new position is opened.
7. Entry & Exit Logic (Summary)
7.1 Long Entry
Conditions for a Long:
CCI signal:
CCI crosses up through the upper threshold.
Ichimoku Cloud Filter (optional):
If enabled → price must be above the Kumo.
Ichimoku Lines Filter (optional):
If enabled → Conversion Line and Base Line must be above the Kumo.
MA Direction Filter (optional):
If enabled → Close must be above the chosen MA.
Anti-re-entry flag:
allowLong must be true (cloud-based reset).
Position check:
Long entries are allowed when current position size ≤ 0 (so it can also reverse from short to long).
If all these conditions are true, the strategy sends:
strategy.entry("Long", strategy.long, qty = calculated_qty)
After entry:
allowLong = false
allowShort = true
7.2 Short Entry
Same structure, mirrored:
CCI signal:
CCI crosses down through the lower threshold.
Cloud filter: price must be below cloud (if enabled).
Lines filter: conversion & base must be below cloud (if enabled).
MA filter: Close must be below MA (if enabled).
allowShort must be true.
Position check: position size ≥ 0 (allows reversal from long to short).
Then:
strategy.entry("Short", strategy.short, qty = calculated_qty)
Flags update:
allowShort = false
allowLong = true
7.3 Exits
While in a position:
The strategy continuously recalculates SL (depending on chosen mode) and, in Percent mode, TP.
In Fib mode, fixed TP levels are computed at entry.
BreakEven may raise/tighten the SL if its conditions are met.
Exits are executed via strategy.exit:
Percent mode: one TP+SL exit per side.
Fib mode: two partial exits (TP1 and TP2) sharing the same SL.
At position open, the script also draws visual lines:
White line — entry price.
Green line(s) — TP level(s).
Red line — SL (if not using Ichimoku Trailing; with trailing, the red line is updated dynamically).
Maximum of 30 lines are kept to avoid clutter.
8. How to Use the Strategy
Choose market & timeframe
Works well on trending instruments. Try crypto, FX or indices on H1–H4, or intraday if you prefer more trades.
Adjust Ichimoku settings
Keep defaults (9/26/52/26) or adapt to your timeframe.
Configure Moving Average
Typical: EMA 200 as a trend filter.
Turn MA Direction Filter ON if you want to trade only with the main trend.
Set CCI thresholds
Default ±100 is classic.
Lower thresholds → more signals, higher noise.
Higher thresholds → fewer but stronger signals.
Enable/disable filters
Turn on Ichimoku Cloud and Ichimoku Lines if you want only “clean” trend trades.
Use Wait Position Close Before Flag Reset to control how often re-entries are allowed.
Choose TP & SL mode
Percent mode is simpler and easier to understand.
Fibonacci mode is more advanced: it aligns TP levels with the distance to stop, giving asymmetric RR setups (two partial TPs).
Choose Stable SL for fixed-risk trades, or Ichimoku / Ichimoku Trailing to tie stops to the cloud structure.
Set BreakEven
Enable BE if you want to lock in risk-free trades after a certain move.
Percent mode is straightforward; Fib mode keeps BreakEven in harmony with your Fib TP setup.
Run Backtest & Optimize
Press “Add to chart” → go to Strategy Tester.
Adjust parameters to your market and timeframe.
Look at equity curve, PF, drawdown, average trade, etc.
Live / Paper Trading
After you’re satisfied with backtest results, use the strategy to generate signals.
You can mirror entries/exits manually or connect them to alerts (if you build an alert-based execution layer).

Time Syndicate: Sweep & ShiftTime Syndicate: Sweep & Shift
The Hierarchy of Time.
Most traders look at price and wonder "where." Time Syndicate asks "when."
This system is a paradigm shift away from lagging indicators. It is built on a proprietary temporal engine that mathematically divides market activity into predictive windows of opportunity. It does not guess; it waits for the market to reveal its hand at specific, algorithmically determined intervals.
Core Capabilities
100% Non-Repainting Logic: Built for professional reliability. Unlike tools that rewrite history to look perfect in hindsight, this strategy features Absolute Signal Permanence. Once a signal is confirmed and the bar closes, it never vanishes or shifts. What you see live is exactly what remains, ensuring that your backtesting reality matches your live execution.
Temporal Segmentation: The indicator ignores noise by isolating price action into a rigid, non-linear time hierarchy. It automatically detects when the market is in a "Reference Phase" versus an "Expansion Phase," keeping you out of the chop and aligning you with institutional volatility.
Algorithmic Bias Detection: Forget drawing manual support and resistance. The system utilizes a dynamic, time-weighted volatility model to determine the immediate directional bias. It identifies exactly when liquidity has been harvested and when the smart money is committing to a direction.
Fractal Confirmation Engine: A bias is nothing without timing. The "Shift" mechanism is a secondary confirmation layer that monitors sub-structural price delivery. It validates that the momentum matches the time cycle, ensuring you only execute when Time, Price, and Structure are in perfect confluence.
Adaptive Cycle Modes: Whether you are positioning for macro moves or scalp executions, the system adapts its internal clock to your objective:
Daily Mode: For capturing significant intraday expansions.
Session (Indian Market): A bespoke calibration tuned specifically to the volatility signature of the Indian trading session.
90-Min (Scalp): High-frequency cycle detection for rapid precision plays.
Discipline Protocols: Built-in execution filters prevent over-trading by locking signals once a cycle objective is met. This enforces a "sniper" mentality—one trigger, one cycle, zero noise.
Stop chasing candles. Start trading Time.

BTR Auto Buy/Sell Trend System
BTR Auto Buy/Sell Trend System — Your New Profit Machine!
Discover the only TradingView system you need to spot powerful trend reversals with precision, confidence, and automation.
Designed for Stocks, Crypto & Commodities, this strategy consistently delivers 60%–80% accuracy in trending markets.
This is not just a script…
👉 It’s your complete plug-and-play trading system.
💡 Why Traders Love This System
✔ Early Trend Identification
Catch major reversals before the crowd.
✔ Non-Repainting Confirmed Signals
All entries are triggered only on candle close, so what you see is what you trade.
✔ Smart ATR + Momentum Engine
Filters bad trades automatically, giving you only high-quality signals.
✔ Works on All Timeframes
From 5-minute scalping to daily swing trading.
✔ Full Auto-Trading Ready
Pre-built JSON alerts for API Algo Trading.
No coding. No setup headache. Just copy → paste → trade.
⚡ How You Make Money With This Strategy
Step 1: Wait for Trend Flip
🔵 BUY when the system flips from bearish → bullish
🔴 SELL when it flips from bullish → bearish
Step 2: Enter on Confirmed Signal
Trade only on the bar after signal closes.
Step 3: Ride the Trend
Let the strategy take the move.
It avoids sideways markets and shines in strong trends.
Step 4: Auto Alerts (Optional)
Turn on Dhan alerts and let the system execute trades automatically.
📈 What You Can Expect (Typical Performance)
✔ 60–80% success rate in trending markets
✔ Works in Stocks, Crypto, Commodities
✔ High accuracy in 15m, 30m, 1H, 4H charts
✔ Avoids most fake breakouts & sideways noise
This system is built for consistency, simplicity, and scalable automation.
⭐ Perfect For:
Beginner traders
Algo traders
Swing traders
Scalpers
Systematic
API users
Anyone who wants clean, high-probability trend signals
⚠ Disclaimer
Trading involves risk. Past results do not guarantee future returns.
Use proper risk management for best results.

A+ Setup Strategy Trendline Features Added:
1. Automatic Trendline Detection
Support Trendline (green) - Connects swing lows
Resistance Trendline (red) - Connects swing highs
Uses pivot points to identify key swing levels
Validates trendlines by counting touches (minimum 3 touches required)
2. Trendline Settings
Show Trendlines - Toggle on/off
Lookback Period - How far back to look for pivots (default: 50 bars)
Min Touches - How many touches needed for valid trendline (default: 3)
3. Trendline Break Detection
Bullish Break - Price breaks above support trendline (marked with small green circle)
Bearish Break - Price breaks below resistance trendline (marked with small red circle)
Generates signals when breaks occur
4. Enhanced A+ Setups
Now includes ULTRA setups - the absolute best trades:
ULTRA BUY Setup (Aqua label):
Bullish FVG + BOS + Volume Spike + Uptrend
PLUS: Support trendline break OR near key support
PLUS: Trendline breakout confirmation
ULTRA SELL Setup (Fuchsia label):
Bearish FVG + BOS + Volume Spike + Downtrend
PLUS: Resistance trendline break OR near key resistance
PLUS: Trendline breakdown confirmation
5. Confluence Integration
The strategy now considers price near trendlines as additional confluence, similar to how it uses daily S/R levels.
6. Additional Alerts
Support Trendline Break
Resistance Trendline Break
ULTRA BUY/SELL Setup alerts
This gives you multiple tiers of signal quality:
Standard A+ Setup - All conditions met
ULTRA A+ Setup - All conditions + trendline break (highest probability)
The trendlines will help you identify major trend reversals and breakouts for even better entry timing!

Oracle Protocol — Arch Public (Testing Clone) Oracle Protocol — Arch Public Series (testing clone)
This model implements the Arch Public Oracle structure: a systematic accumulation-and-distribution engine built around a dynamic Accumulation Cost Base (ACB), strict profit-gate exit logic, and a capital-bounded flywheel reinvestment system.
It is designed for transparent execution, deterministic behaviour, and rule-based position management.
Core Function Set
1. Accumulation Framework (ACB-Driven)
The accumulation engine evaluates market movement against defined entry conditions, including:
Percentage-based entry-drop triggers
Optional buy-below-ACB mode
Capital-gated entries tied to available ledger balance
Fixed-dollar and min-dollar entry rules (as seen in Arch public materials)
Automated sizing through flywheel capital
Range-bounded ledger for controlled backtesting input
Each qualifying buy updates the live ACB, maintains the internal ledger, and forms the next reference point for exit evaluation.
No forecasting mechanisms are included.
2. Profit-Gate Exit System
Exits are governed by the standard Arch public approach:
A sealed ACB reference for threshold evaluation
Optional live-ACB visibility
Profit-gate triggers defined per asset class
Candle-confirmation integration (“ProfitGate + Candle” mode)
Distribution only when the smallest active threshold is met
This provides a consistent cadence with published Arch diagrams and PDFs.
3. Once-Per-Rally Governance
After a distribution, the algorithm locks until price retraces below the most recent accumulation base.
Only after re-arming can the next profit gate activate.
This prevents over-frequency selling and aligns with the public-domain Oracle behaviour.
4. Quiet-Bars & Threshold Cluster Control
A volatility-stabilisation layer prevents multiple exits from micro-fluctuations or transient spikes.
This ensures clean execution during fast markets and high volatility.
5. Flywheel Reinvestment
Distribution proceeds automatically return to the capital pool where permitted, creating a closed system of:
Entry sizing
Exit proceeds
Ledger-managed capital state
All sizing respects capital boundaries and does not breach dollar floors or overrides.
6. Automation Hooks and Integration
The script exposes:
3Commas-compatible JSON sizing
Entry/exit signalling via alertcondition()
Deterministic event reporting suitable for external automation
This allows consistent deployment across automated execution environments.
7. Visual Tooling
Optional displays include:
Live ACB line
Exit-guide markers
Capital, state, and ledger panels
Realized/unrealized outcome tracking based on internal logic only
Visual components do not influence execution rules.
Operating Notes
This model is rule-based, deterministic, and non-predictive.
It executes only according to the explicit thresholds, capital limits, and state transitions defined within the script.
No discretionary or forward-looking logic is included.

CSS_LFU_v0.1Overview:
A multi-factor, market-adaptive swing strategy designed for intraday and short-term crypto trading. It synthesizes momentum, volatility, and trend signals into a unified composite score over a configurable lookback window. The strategy leverages a modular, signal-weighted approach to ensure robust entry timing while remaining compatible with human-in-the-loop validation and algorithmic execution.
Core Modules:
AJFFRSI (RSX-based Momentum): Measures smoothed price momentum with noise-reduction filters to detect crossovers relative to the QQE trailing stop.
QQE (Quantitative Qualitative Easing RSI): A modified RSI with a dynamic trailing stop that adapts to short-term volatility, identifying exhaustion and potential reversal points.
Keltner Channel Zones: Determines overextension relative to trend, providing buy/sell zones based on ATR-banded EMA.
WaveTrend Oscillator: Confirms short-term swings and market direction through smoothed oscillator cross signals.
Rolling Composite Score: Aggregates module signals over a unified lookback (e.g., 144 bars) to normalize noise and capture consistent trends.
Signal Logic:
Each module outputs a discrete score (+1 / 0 / -1).
The rolling composite score sums all module scores over the lookback period.
Long positions trigger when the rolling score meets or exceeds the long threshold.
Short positions trigger when the rolling score meets or falls below the short threshold.
Multi-dimensional signal aggregation reduces false positives from single indicators.
Rolling lookback ensures score normalization across different volatility regimes.
Highly modular: easy to adapt modules or weights to different instruments or timeframes.
Fully compatible with automated execution pipelines, including custom exchange screener bots.
Use Case:
Ideal for quant-driven altcoin or multi-asset strategies where high-frequency validation is critical and sequential module weighting enhances trend flip detection.

EMA Trend Pro v5.0 5M ONLY — 策略版(1:1出30%+保本)Here is a clear, professional English description you can copy-paste directly (suitable for sharing with friends, investors, brokers, or posting on TradingView):
EMA Trend Pro v5.0 – Strategy Overview
This is a trend-following strategy designed for 15-minute charts on assets like XAUUSD, NASDAQ, BTC, and ETH.
Entry Rules
Buy when the 7, 14, and 21-period EMAs are aligned upward and the 14-period EMA crosses above the 144-period EMA (with ADX > 20 and volume confirmation).
Sell short when the EMAs are aligned downward and the 14-period EMA crosses below the 144-period EMA.
Risk Management
Initial stop-loss is placed at 1.8 × ATR below (long) or above (short) the entry price.
Position size is calculated to risk a fixed percentage of equity per trade.
Profit-Taking & Trade Management
When price reaches 1:1 reward-to-risk, 30% of the position is closed.
At the same moment, the stop-loss for the remaining 70% is moved to the entry price (breakeven).
The remaining position is split:
50% targets 1:2 reward-to-risk
50% targets 1:3 reward-to-risk (allowing big wins during strong trends)
Visualization
Clean colored bars extend to the right showing entry, stop-loss, and three take-profit levels.
Price labels clearly display "Entry", "SL", "TP1 1:1", "TP2 1:2", and "TP3 1:3".
Only the current trade is displayed for a clean chart.
Key Advantages
High win rate due to breakeven protection after 1R
Excellent reward-to-risk ratio that lets winners run
Fully automated, works on any market with clear trends
Professional look, easy to understand and explain
Perfect for swing traders who want consistent profits with limited downside risk.
Feel free to use this description on TradingView, in your trading journal, or when explaining the strategy to others!
If you want a shorter version (e.g., for TradingView description box) or a Chinese version, just let me know — I’ll give it to you right away! 😊

PA Builder [PrimeAutomation]1. PA Builder – Overview
PA Builder is not a fixed strategy; it’s a framework for building strategies. Instead of giving traders one rigid system, it provides a toolbox where entries, exits, filters, risk parameters, and automation rules can all be defined and combined. The core philosophy is confluence: the idea that a trade should only be taken when multiple independent signals agree. The Builder is built around this principle. Every module; trend, reactors, bands, reversals, volume, structure, divergences, externals can be treated as one layer of confidence. The stronger the alignment across layers, the higher the quality of the setup in theory.
In practice, this means PA Builder encourages traders to think in terms of “confluence,” not single indicators. Trend and positioning define whether you should even be looking for longs or shorts. Timing tools such as bands, reversals and candlestick structures determine when inside that broader bias you want to engage. Confirmation tools like volume and flow tell you whether capital is actually supporting the move. Filter systems then ensure that even if everything looks good locally, you still respect higher-timeframe or opposing warnings. The Builder’s philosophy is simple: enter less often, but only when conditions are genuinely in your favour.
2. Core Entry Signal Components
The entry logic in PA Builder is built on a set of signal engines that can be combined in many ways. Trend Signals form a natural foundation. They use low-lag low-pass filters, borrowed from audio signal processing, to extract directional bias from price without the classic delay of classical moving averages. The sensitivity parameter controls how reactive this engine is: lower values favour cleaner trends and fewer whipsaws, while higher values are better suited to short-term intraday trading where speed matters more than smoothness. Many traders start by requiring that Trend Signals show “all bullish” or “all bearish” before allowing any entries in that direction.
Trend signals firing short positions
On top of this directional backbone, the Dynamic Reactor behaves as an adaptive baseline. It accelerates in volatile phases and slows down during consolidation, effectively acting as a moving reference point for both trend and price position. A typical use of this module is to insist that, for long trades, the price sits above a bullish reactor; for shorts, below a bearish one. At the higher-timeframe level, the Quantum Reactor provides a VWAP-style reference that can be anchored to larger candles than the chart you are trading. A common configuration is to trade on a 15-minute chart while requiring that price is above the 4-hour Quantum Reactor for longs or below it for shorts. The “fast” and “slow” options determine how quickly this reference adapts to new information.
Timing is then refined with tools like Quantum Bands, reversals and candle structure analysis. Quantum Bands identify extremes within the current environment. In an uptrend, a tag of the lower band can be treated as a pullback rather than a breakdown; in a downtrend, the upper band acts like a shorting zone. Many traders combine “trend up and above higher-timeframe reactor” with “price temporarily below lower band” to construct a mean-reversion entry inside a larger uptrend. Reversal detection modules examine recent bars to find turning points, with shorter lookbacks capturing fast flips and longer lookbacks tracking deeper structural changes. Candle structure logic goes beyond classical candlestick names and instead focuses on whether price action confirms follow-through or reversion behaviour, with options like “2X” modes that wait for two successive confirmations before acting.
Before and after filtering using reactor applied.
Additional confirmation layers come from Volume Matrix, Money Flow, OSC True7 and divergence detection. Volume and flow tools answer whether actual capital is participating in the move or whether price is drifting on thin activity. OSC True7 categorises the state of the trend into intuitive buckets, strong, healthy, neutral, or exhausted, making it easier to avoid chasing extremes. Divergences between price and momentum can be used either as entry triggers in contrarian systems or as hard filters that block trades when warning signs are present. Finally, two external indicator inputs make it possible to integrate RSI, MACD, custom indicators or even other strategies into the Builder, either as simple thresholds or as comparative logic between two external sources (for example, requiring a fast EMA to be above a slow EMA before allowing longs).
3. Exit System & Trade Management
The exit systems in PA Builder are designed to be as vital as the entry logic. It assumes exits are not an afterthought, but half of the edge. Instead of forcing a single take profit point, the system uses a three-tier structure where you can assign different portions of the position to different targets. A common pattern is to scale out a small portion early (for example at one ATR), another portion at an intermediate level, and keep the largest slice for a deeper move. This creates a natural balance: you book something early to reduce emotional stress, while leaving room to participate in the full potential of a trend.
Targets can be defined using ATR multiples or risk-to-reward ratios that are directly tied to the initial stop distance. Using ATR keeps exits proportional to current volatility. A two ATR target in a quiet environment is very different in absolute price distance from the same multiple in a high-volatility environment, yet conceptually it represents the same “size” move. Risk-to-reward exits build on this by ensuring that if you risk one unit (1R), the reward targets are set at predefined multiples of that risk. This enforces positive expectancy at the structural level: the strategy cannot generate entries with inherently negative payoffs.
Once price begins to move in your favour, trailing logic takes over if you choose to enable it. Trailing can begin immediately from entry or only after a target has been hit. Many users prefer to let TP1 and TP2 behave as fixed profit points and then apply a trailing stop or trailing take profit to the final remainder. That way, routine winners are banked mechanically, while occasional explosive moves can be ridden for as long as the market allows. The breakeven module supports this behaviour by automatically moving stops to entry (or slightly through entry into profit) after a specified condition such as TP1 being hit. This transforms the risk profile mid trade: once breakeven has been secured, remaining size can be managed with much less psychological pressure.
The system also recognises the cost of time. Kill Switch functionality exits trades that have been open too long under mediocre conditions, typically when they are in modest profit but not progressing. This protects you from capital being tied up while better opportunities appear elsewhere. Underlying all of this are several trailing stop mechanisms: percentage-based, tick-based for very short-term strategies, TP linked trailing that activates only once a certain profit threshold has been achieved, and ATR based trailing that automatically scales the trail distance with volatility. Each method serves a slightly different profile of strategy, but all share the same aim: preserve gains and limit downside in a structured way rather than rely on discretionary judgement after the fact.
4. Filters and Risk Management
The filter systems in PA Builder formalise the idea that good trading is often about knowing when not to act. “Do Not Trade” conditions can be configured so that even a perfectly aligned bullish entry stack is overridden if certain bearish evidence is present. These can include higher timeframe reversal structures, powerful opposing divergences, or conflicting signals in key modules. By assigning conditions specifically to “Do Not Long” and “Do Not Short” rather than only to entries, you create asymmetry: buying requires bullish evidence and an absence of strong bearish warnings; selling requires the mirror.
Volatility filters extend this logic to the regime level. Some strategies are inherently suited to low volatility, range bound environments where fading extremes is profitable; others require expansion and energy to function properly. By binding trading permission to volatility ranges, you ensure that a mean-reversion system does not blindly attempt to fade a breakout, and that a momentum system does not spin its wheels in a dead, sideways market. You can even reference volatility from a higher timeframe than the one you trade, so that a five-minute strategy is still aware of the broader one-hour volatility regime it sits inside.
Applied DO NOT TRADE - removes poor signal
Risk management and position sizing are configured so each trade is expressed in units of risk rather than arbitrary size. Leverage, in this framework, is simply a scaling factor for capital efficiency; the actual risk per trade is still controlled by the distance between entry and stop and the percentage of equity you choose to expose. Reinvestment options then decide what proportion of accumulated profit is fed back into position sizing. A more aggressive reinvestment setting accelerates compounding but increases the amplitude of drawdowns; a more conservative one smooths the equity curve at the cost of slower growth. The Base Trade Value parameter ties all of this together by deciding how much nominal capital or how many contracts are committed per trade in light of your maximum allowed simultaneous positions and your intended use of leverage.
External exit conditions provide further flexibility. For example, you might design a system whose entries rely purely on PA Builder’s internal modules, but whose exits use RSI readings, moving average crosses, or a proprietary external indicator. The separation of entry and exit logic allows you to bolt on different behaviours at the tail end of trades while keeping your core signal engine intact. In all cases, the objective is the same: express risk in a controlled, repeatable way that can survive long stretches of unfavourable market conditions.
5. PDT, Cooldowns and Visual Modes
For traders subject to Pattern Day Trading rules, PA Builder includes a day-trade tracking system that counts business days correctly and respects the three-trades-in-five-days limit. This goes beyond simple compliance; it forces discipline. When intraday trading is heavily constrained, you are naturally pushed toward swing-oriented strategies with fewer, more selective entries. The tool visually marks your PDT status so you never inadvertently cross the line and trigger a lockout.
Cooldown systems address another reality: psychological vulnerability after streaks. Following several consecutive wins, many traders unconsciously loosen their standards, take marginal signals, oversize positions, or overtrade. A win-streak cooldown deliberately pauses trading after a configured number of wins, giving you time to reset. The same applies to losing streaks. After a run of losses, the strongest temptation is often to “make it back now,” which is exactly when discipline is weakest. A loss-streak cooldown enforces a break in activity during this high-risk emotional state, helping to prevent cascading damage driven by revenge trading.
Visualisation comes in two main modes. Classic mode emphasises precision: it draws explicit entry lines, stop levels, target levels and fill zones, making it easy to audit risk/reward on each trade, verify that the exit logic behaves as intended, and review historical trades in detail. Modern mode emphasises market feel: instead of focusing on exact levels, it colours candles and backgrounds to reflect momentum, profit state and dynamics.
This helps you see at a glance whether a strategy is operating in a smooth trending environment or a choppy, fragmented one, and whether current trades are broadly working or struggling. Many users develop and debug in Classic mode and then monitor live performance in Modern mode, so both representations become part of the workflow.
6. Strategy Design Workflow, Examples and Cautions
Designing with PA Builder is inherently iterative. You begin with a simple theory and a minimal configuration, perhaps just a trend filter and a basic stop/target structure, and run a backtest. You then examine where the system fails. If you see many losses occurring in counter-trend conditions, you add an additional directional filter or restrict entries with a higher-timeframe reactor condition. If you observe many small whipsaw losses, you might require candle structure confirmation or volume confirmation before allowing an entry. Each change is made one at a time and evaluated. This process gradually builds a layered system where every component has a clear purpose: some reduce drawdown, some increase win rate, some cut out only the worst trades, and others help capture more of the best ones.
A conservative swing strategy might need an agreement between short-term trend signals, a higher-timeframe Quantum position, and a bullish Dynamic Reactor state, while checking that volume supports the move and that no significant bearish reversals or divergences are present on higher timeframes. It might accept relatively few trades, but each trade would be tightly controlled, scaled out over several ATR-based targets and protected with breakeven and trailing logic. On the opposite end, an aggressive scalping configuration would relax some filters, favour faster sensitivities, use short lookback reversals, and tighten stops and targets dramatically, relying on high frequency and careful volatility filtering to maintain edge.
Throughout all of this, overfitting remains the main danger. The more parameters you tune and the more coincidental rules you add to make the backtest equity curve smoother, the more likely it is that you are capturing noise rather than a real, repeatable edge. Signs of overfitting include heavily optimised numeric values with no intuitive justification, large differences between in-sample and out-of-sample results, or strategies that work spectacularly in very specific regimes and collapse elsewhere. To mitigate this, keep strategies as simple as possible, test across different market regimes (bull, bear, range), and accept that robust systems usually look less “perfect” on the historical chart.
Bridging the gap from backtest to live trading is another critical step. Before risking capital, it is wise to paper trade the configuration for a number of trades to confirm that signal frequency, behaviour and execution align with expectations. When going live, starting with minimal size and gradually scaling up based on real-world performance helps manage both financial and psychological risk. If live results diverge significantly from backtest expectations due to slippage, fees, or changing market conditions, you can adjust, reduce size, or temporarily pause rather than commit fully to a failing configuration.
Ultimately, PA Builder is designed to be a tool for building structured, rules-driven trading systems. It gives you the tools to express your ideas, test them, refine them, and run them under controlled risk. It does not remove uncertainty or guarantee results, but it does provide a clear, transparent way to translate trading concepts into executable, testable logic, and to evolve those systems as markets change and your understanding deepens.

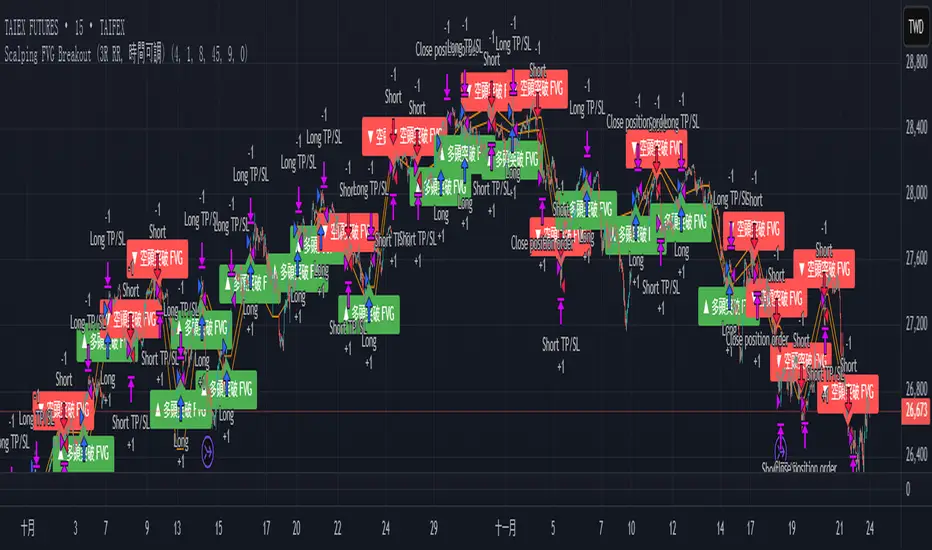
Scalping FVG Breakout (3R RR, 時間可調)Scalping
1. Taipei Open Time (time adjustable)
2. First 15mK Bar
3. Risk 1:3
4. Stop Loss
Fibo Tarayıcı + Mirror + Bot
KEY FEATURES:
1. Fibonacci Levels: Plots 23.6%, 38.2%, 50%, 61.8%, 78.6%, 88.6%, 100%, 127.2%, 141.4%, 161.8% levels
2. Mirror Fibonacci: Shows reverse extensions of main levels
3. Auto Trading System: Executes automatic trades at specified Fibonacci levels
4. Multi-Symbol Scanner: Scans 120+ crypto and stock symbols
5. Visual Alerts: Colored background and labels when price approaches Fibonacci levels
HOW IT WORKS:
1. Finds swing high/low points over 144 bars
2. Calculates Fibonacci levels between these points
3. Generates buy/sell signals when price approaches these levels
4. User can select which levels to trade
5. Scanner shows Fibonacci signals across multiple symbols

CNN Fear and Greed StrategyAdaptation of the CNN Fear and Greed Index Indicator (Original by EdgeTools)
The following changes have been implemented:
Put/Call Ratio Data Source: The data source for the Put/Call Ratio has been updated.
Bond Data Source: The data sources for the bond components (Safe Haven Demand and Junk Bond Demand) have been updated.
Normalization Adjustment: The normalization method has been adjusted to allow the CNN Fear and Greed Index to display over a longer historical period, optimizing it for backtesting purposes.
Style Modification: The display style has been modified for a simpler and cleaner appearance.
Strategy Logic Addition: Added a new strategy entry condition: index >= 25 AND index crosses over its 5-period Simple Moving Average (SMA), and a corresponding exit condition of holding the position for 252 bars (days).
CNN Fear & Greed Backtest Strategy (Adapted)
This script is an adaptation of the popular CNN Fear & Greed Index, originally created by EdgeTools, with significant modifications to optimize it for long-term backtesting on the TradingView platform.
The core function of the Fear & Greed Index is to measure the current emotional state of the stock market, ranging from 0 (Extreme Fear) to 100 (Extreme Greed). It operates on the principle that excessive fear drives prices too low (a potential buying opportunity), and excessive greed drives them too high (a potential selling opportunity).
Key Components of the Index (7 Factors)
The composite index is calculated as a weighted average of seven market indicators, each normalized to a score between 0 and 100:
Market Momentum: S&P 500's current level vs. its 125-day Moving Average.
Stock Price Strength: Stocks hitting 52-week highs vs. those hitting 52-week lows.
Stock Price Breadth: Measured by the McClellan Volume Summation Index (or similar volume/breadth metric).
Put/Call Ratio: The relationship between volume of put options (bearish bets) and call options (bullish bets).
Market Volatility: The CBOE VIX Index relative to its 50-day Moving Average.
Safe Haven Demand: The relative performance of stocks (S&P 500) vs. bonds.
Junk Bond Demand: The spread between high-yield (junk) bonds and U.S. Treasury yields.
Critical Adaptations for Backtesting
To improve the index's utility for quantitative analysis, the following changes were made:
Long-Term Normalization: The original normalization method (ta.stdev over a short LENGTH) has been replaced or adjusted to use longer historical data. This change ensures the index generates consistent and comparable sentiment scores across decades of market history, which is crucial for reliable backtesting results.
Updated Data Sources: Specific ticker requests for the Put/Call Ratio and Bond components (Safe Haven and Junk Bond Demand) have been updated to use the most reliable and long-running data available on TradingView, reducing data gaps and improving chart continuity.
Simplified Visuals: The chart display is streamlined, focusing only on the final Fear & Greed Index line and key threshold levels (25, 50, 75) for quick visual assessment.
Integrated Trading Strategy
This script also includes a simple, rules-based strategy designed to test the counter-trend philosophy of the index:
Entry Logic (Long Position): A long position is initiated when the market shows increasing fear, specifically when the index score is less than or equal to the configurable FEAR_LEVEL (default 25) and the index crosses above its own short-term 5-period Simple Moving Average (SMA). This crossover acts as a confirmation that sentiment may be starting to turn around from peak fear.
Exit Logic (Time-Based): All positions are subject to a time-based exit after holding for 252 trading days (approximately one year). This fixed holding period aims to capture the typical duration of a cyclical market recovery following a major panic event.

ILM & IFVG StrategyPlease feel free to adjust in any way possible. Let me know if you can create something better from this initial coding.
//═══════════════════════════════════════════════════════════════════════
// Inverted Liquidity Model (ILM) – Strategy
//═══════════════════════════════════════════════════════════════════════
//
// The **Inverted Liquidity Model (ILM)** is a liquidity-based algorithm
// built to capture high-probability reversals after:
//
// • A liquidity sweep (SSL/BSL taken)
// • Rejection back inside the range
// • A Fair Value Gap (FVG) forms
// • That FVG becomes invalidated → becomes an IFVG entry zone
//
// ILM combines:
// • LTF BOS / CHOCH structure confirmation
// • HTF structure (expansion) filtering
// • Premium / Discount filter (17:00 CST session midline)
// • Optional ATR volatility filter
// • Optional trading session restrictions
// • Optional partial profit-taking + runners
//
// When all conditions align, the strategy enters:
// ✔ Long after sweep of SSL + valid long IFVG + trend confirmation
// ✔ Short after sweep of BSL + valid short IFVG + trend confirmation
//
// Stops are placed at the sweep wick.
// Full target is set at the next structural high/low.
// Optional partial TP sends a runner to full target.
//
// Visual tools (labels, sweep lines, IFVG boxes, midline) assist
// with review and forward testing.
//
//───────────────────────────────────────────────────────────────────────
// USER CONFIGURABLE FEATURES
//───────────────────────────────────────────────────────────────────────
//
// • **Liquidity & Structure**
// - pivotLen → swing length for pivots / liquidity
// - htfOn → toggle higher-timeframe pivots
// - htfTF → timeframe for HTF structure/liquidity
// - useStructureFilter → enforce LTF BOS/CHOCH trend
// - useHtfExpansionFilter → enforce HTF trend
// - showStructureLabels → show BOS/CHOCH labels
// - showHtfStructureLabels → show HTF BOS/CHOCH labels
//
// • **Premium / Discount Midline**
// - usePremiumDiscountFilter → only long in discount / short in premium
// - pdSession → session used for midline (default 17:00 CST)
// - showPdMidLine → show 50% midline
//
// • **FVG / IFVG Detection**
// - useBodyGapFVG → FVG uses candle bodies instead of wicks
// - useDisplacementFVG → require displacement bar
// - dispAtrMult → minimum ATR threshold for displacement
// - showIFVG → draw IFVG boxes
//
// • **ATR / Volatility / Sessions**
// - useRangeFilter → require minimum ATR%
// - atrLen → ATR period
// - minAtrPerc → minimum ATR% of price
// - useSessionFilter → restrict trading hours
// - sessionTimes → allowed trading session
//
// • **Sweep Visualization**
// - showSweepLines → draw sweep lines at SSL/BSL sweeps
// - sweepLineWidth → thickness of sweep lines
//
// • **Exits: Partial Targets & Runners**
// - usePartialTargets → enable partial TP logic
// - tp1QtyPercent → percent closed at TP1
// - tp1FractionOfPath → TP1 relative to path to full target
//
// • **Formatting / Visibility**
// - labelFontSizeInput → tiny / small / normal / large / huge
// - showEntries → entry markers
// - showTargets → target lines
//
//═══════════════════════════════════════════════════════════════════════
// END OF STRATEGY DESCRIPTION
//═══════════════════════════════════════════════════════════════════════
