Complete turtles strategy based on the donchian channelsDear Traders and investor,
I want to demonstrate scrypt of the iconic "trend following strategy" coded by my
The main idea was borrowed from the book "Way of the Turtle: The Secret Methods that Turned Ordinary People into Legendary". The strategy is based on the donchian channels and is one of the oldest and easiest strategy in the using. Also strategy include risk managment and trends filter which prevent false entries and high drawndowns. The results are based on the period from 2006 to present, but you can also change timeframe and period of backtesting.
Best regards,
Vlad
Wyszukaj w skryptach "backtesting"

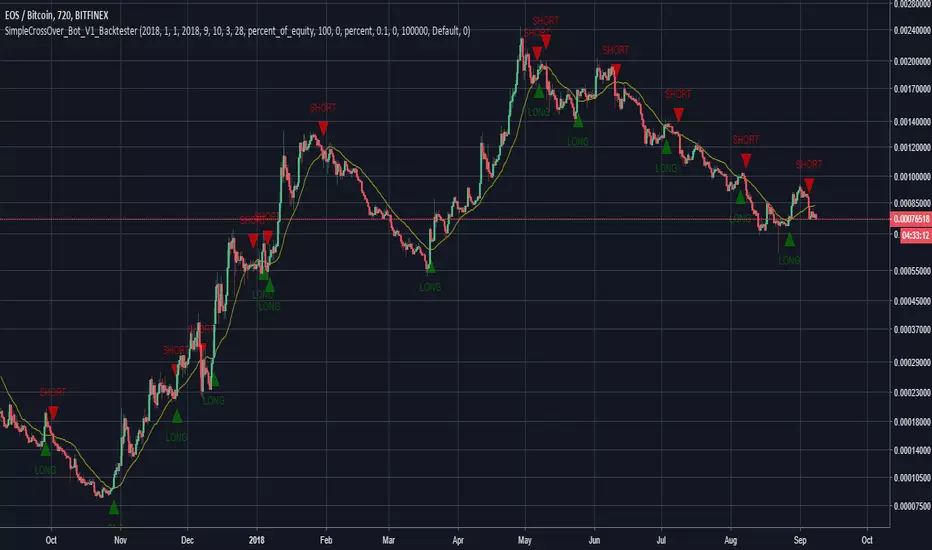
SimpleCrossOver_BotThis is a simple example of how you can compile your own strategy
This script contains the code for alerts and for backtesting.
In order to use the backtester, comment out the sections to be used for signals, and comment in the sections to be used on the back tester, and visa versa for using the script for alerts in order to automate your own bot.
Awesome Oscillator.MMouse_Lager_BCEAwesome Oscillator with added options for turning short trades on and off, as well as a start date for backtesting.

Pivot Reversal Strategy - TimeFramedThis is Pivot Reversal Strategy including the time frames for backtesting.

3 Duck's Trading System from Babypips.comThe 3 Duck's Trading System from Babypips.com
The 3 Duck's Trading System is the most popular and active trading system thread on the the babypips.com forum. It is a system that is mainly for beginners because it teaches you discipline, learning to cope with price moving against your position and learning to stay in a trade and keep profits running. For the thread and more info on the 3 Duck's Trading System click here
How does it work?
The system is a very simple enter/exit based on the 60 SMA of 3 different time frames: 4 hour, 1 hour and 5 minute.
The Rules, er, the Ducks! The Ducks must all be in a row for a trade to take place!
Duck 1 - To go long, price must be above the 60 SMA on the 4 hour chart.
Duck 2 - To go long, price must be above the 60 SMA on the 1 hour chart.
Duck 3 - To go long, price must cross above the 60 SMA on the 5 minute chart and the 60 SMA of the 5 minute chart must be below that of the 4 hour and 1 hour chart. (obviously the reverse for shorting)
YOU MUST USE THIS SYSTEM ONLY ON THE 5 MINUTE CHART.
I say this because I have already charted all of the Ducks into the 5 minute chart so you don't have to flip back and forth.
I have also added some inputs for profit targets, stop targets, trailing stops and times to trade for backtesting.
If you have any questions or comments, please let me know! If you see I messed up on something, please let me know!
Also a VERY special thanks to the babypips.com user Captain_Currency . He wrote this strategy 10 years ago (2007 was 10 years ago?!) and he is still active on the thread and posting results and offering help!

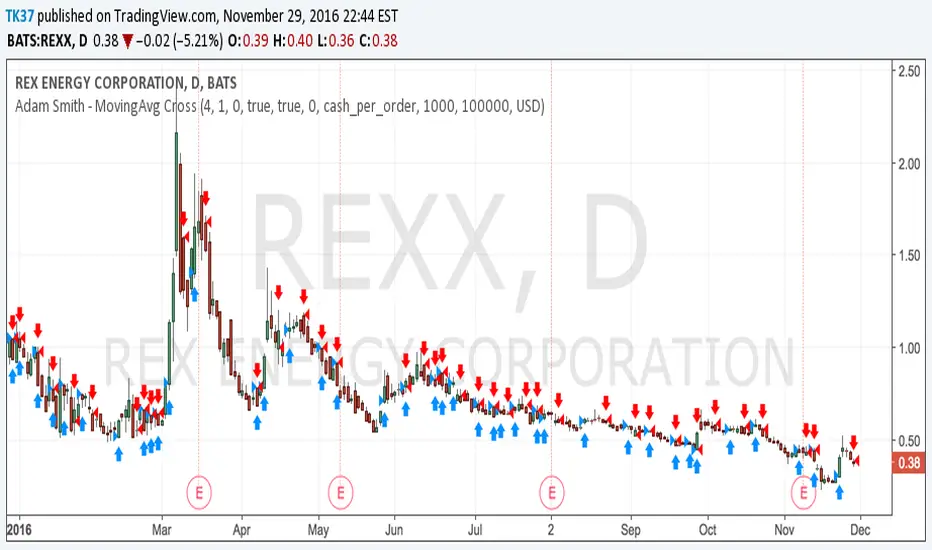
Adam Smith - MovingAvg CrossSimple Moving Average Cross script. Test on stocks and currency. For stocks test shorter time periods, meaning intra-day time periods such as 3min to 30min and so on to fit what is best. For currency, try longer periods with this model such as day to weeks depending on which currency.
NOTE: Take a look at your Max Drawdowns when testing. This will be the main indicator once you figure out your time period for backtesting. This will also let you know how much money to save and/or hold back in savings for down periods.
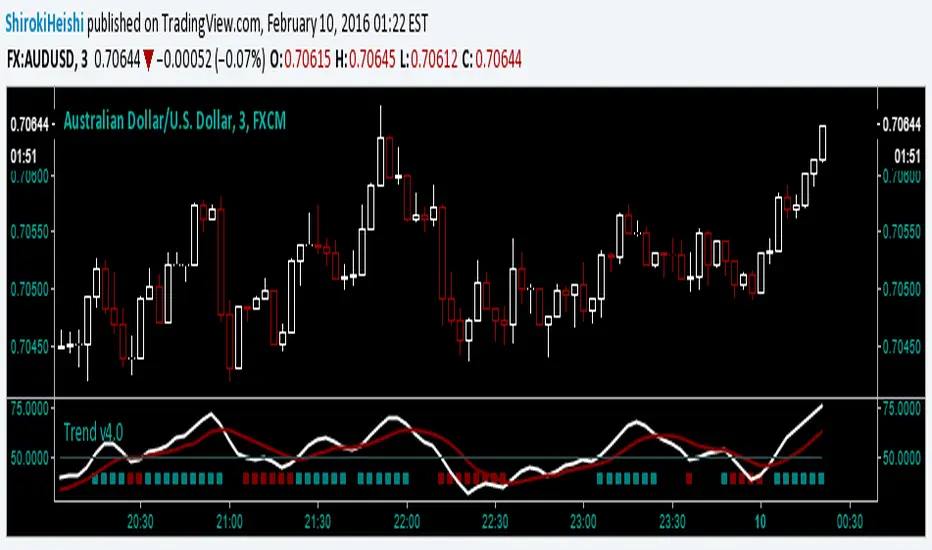
Trend v4.0 Another updateYet another update, default settings can be customized to your needs. Be aware that while this is similar to the other versions, this can only repaint an active bar, but that slows it down by one period. You are warned. Be that as it may, the basic idea is the same; trying to capture the really strong moves into overbought or oversold territory as defined by Relative Strength index. In RSI mode, you can see the smoothing has slowed it down a bit, but warrants backtesting.
First green bar go long, First red bar go short, first white bar possible trend exhaustion. Or use crossovers and such, play with the inputs OB/OS, RSI length, signal length, tick length, swing length, as I said customize to your tastes. I offer no surety as to its efficacy, but we all learn.
Trade Responsibly,
Shiroki
Adaptive EMA (Momentum Entry & Crash Protection)This script is the result of extensive backtesting to find the perfect balance between capturing high-volume momentum and protecting capital during market crashes.
It is not just a standard EMA crossover; it is a fine-tuned trend-following system designed for maximum profit margins.
🚀 KEY OPTIMIZATIONS:
1. Adaptive Logic (Auto-Switching):
The script automatically detects your timeframe and applies the most effective parameters:
• Intraday (≤ 4H): Uses EMA 9 & 21. This classic setup is perfect for filtering noise in short-term trading.
• Swing/Long-Term (> 4H): Uses EMA 7 & 14. *CRITICAL UPDATE:* After testing, the 7/14 combination proved to offer higher profit margins than the traditional 7/21. It reacts faster to major trend reversals, allowing you to lock in profits sooner before a dump.
2. Professional Visuals:
• Fast Line (Gold - 1px): Represents the immediate momentum.
• Slow Line (Deep Blue - 2px): Represents the baseline trend.
• Glow Effect: A subtle white border ensures the lines remain visible even on dark charts.
• Clean Chart Policy: Gradient background signals are included but *disabled by default* to keep your workspace clutter-free. You can enable them in the settings if you prefer visual zones.
💎 HOW TO TRADE:
• Entry (Pump): When the Gold line crosses ABOVE the Blue line. This indicates a surge in volume and upward momentum.
• Exit (Protection): When the Gold line crosses BELOW the Blue line. This is your signal to exit and protect your gains before the price collapses.
No manual configuration is needed. Just add it to your chart, and it adapts instantly.

ST | MA Occurrence ScannerThis tool is designed to automate the statistical backtesting of Moving Averages. Instead of subjectively looking at a chart to see if an MA is being "respected" by the price, this indicator quantifies every interaction to provide hard data.
How it Works: The scanner detects when price approaches a user-defined Moving Average (SMA) and tracks the outcome of that interaction based on a dynamic "Tolerance Zone."

Market Structure & Supply-Demand EngineMarket Structure & Supply-Demand Engine (MSD-Engine) is a professional, non-repainting market structure and supply-demand analysis tool built purely on price action and volatility logic.
This indicator is designed for discretionary traders who want a clean, institutional-style view of market structure without lagging indicators or strategy automation.
🔍 What This Indicator Does
MSD-Engine identifies major structural reversals, plots price-action based supply & demand zones, and provides multi-timeframe confluence in a single, unified framework.
It is visual and analytical only — no strategy orders, no backtesting, and no repainting.
🚀 Core Features
• Non-Repainting Market Structure
Event-based swing reversal detection
ATR-adaptive displacement filtering
Confirmed pivots only (no future leaks)
• Pure Supply & Demand Zones
Candle-structure based zone detection
Volume-weighted zone strength
Automatic invalidation on breach
Configurable zone limits to maintain chart clarity
• Multi-Timeframe Context (MTF)
Chart timeframe structure
Two independent higher-timeframe supply & demand layers
Higher-timeframe directional bias visualization
HTF zones plotted only on confirmed HTF closes
• Volatility-Adaptive Logic
ATR normalized across timeframes
Dynamic reversal thresholds
Stable behavior from scalping to swing charts
• Trendline Lifecycle Tracking
Automatic major trendline construction
Single-fire break detection
Break validation / failure logic
HTF-aligned vs counter-trend classification
🧠 Designed For
• Discretionary price-action traders
• Supply & demand traders
• Market structure & smart-money style analysis
• Multi-timeframe confluence trading
• Futures, indices, forex, crypto, and equities
⚠️ Important Notes
This is NOT a strategy or auto-trading system
No buy/sell signals or performance metrics
No repainting (uses barmerge.lookahead_off)
Educational & analytical use only
📜 Disclaimer
This script is provided for educational and analytical purposes only.
It does not constitute financial advice. Trading financial markets involves risk.

SPY 200SMA +4% Entry -3% Exit TQQQ/QLD/GLDM THREE PHASE STRATEGYWanted to take a look at all of the individual trades and provide a series of options to balance performance and risk. This post is expanding on my previous one - www.reddit.com
Here is the data and the backtesting splitting the strategy into three primary phases with multiple options and exact trade dates to help people easily backtest other combinations - docs.google.com (Three Tabs with the three phases)
If you just want my personal recommendations this would be what I will be using -
PHASE 1 (Strategy BUY signal triggers when SPY price crosses +4% over the SPY 200SMA) = 100% TQQQ
If trade lasts 366 days (Long Term Cap Gains) go to PHASE 2
If SPY price crosses below -3% SPY 200SMA go to PHASE 3
PHASE 2 (PHASE 1 lasts 366 days) = Deleverage and diversify into 50% QLD & 50% GLDM
PHASE 3 (Strategy SELL signal triggers when SPY price crosses -3% below the SPY 200SMA) = Defensive posture with 50% SGOV & 50% GLDM
As market degrades start selling SGOV and buying QQQ until 50% QQQ & 50% GLDM
TradingView Script for the THREE PHASE STRATEGY (imgur.com):
//
@version=
5
strategy("SPY 200SMA +4% Entry -3% Exit Strategy",
overlay=true,
default_qty_type=strategy.percent_of_equity,
default_qty_value=100)
// === Inputs ===
smaLength = input.int(200, title="SMA Period", minval=1)
entryThreshold = input.float(0.04, title="Entry Threshold (%)", step=0.01)
exitThreshold = input.float(0.03, title="Exit Threshold (%)", step=0.01)
startYear = input.int(1995, "Start Year")
startMonth = input.int(1, "Start Month")
startDay = input.int(1, "Start Day")
// === Time filter ===
startTime = timestamp(startYear, startMonth, startDay, 0, 0)
isAfterStart = time >= startTime
// === Calculations ===
sma200 = ta.sma(close, smaLength)
upperThreshold = sma200 * (1 + entryThreshold)
lowerThreshold = sma200 * (1 - exitThreshold)
// === Strategy Logic ===
enterLong = close > upperThreshold
exitLong = close < lowerThreshold
if isAfterStart
if enterLong and strategy.position_size == 0
strategy.entry("Buy", strategy.long)
if exitLong and strategy.position_size > 0
strategy.close("Buy")
// === 366-Day Marker Logic (Uninterrupted) ===
var
int
targetTime = na
// 1. Capture entry time only when a brand new position starts
if strategy.position_size > 0 and strategy.position_size == 0
targetTime := time + (366 * 24 * 60 * 60 * 1000)
// 2. IMPORTANT: If position is closed or a sell signal hits, reset the timer to "na"
if strategy.position_size == 0
targetTime := na
// 3. Trigger only if we are still in the trade and hit the timestamp
isAnniversary = not na(targetTime) and time >= targetTime and time < targetTime
// === Visuals ===
p_sma = plot(sma200, title="200 SMA", color=color.rgb(255, 0, 242))
p_upper = plot(upperThreshold, title="Entry Threshold (+4%)", color=color.rgb(0, 200, 0))
p_lower = plot(lowerThreshold, title="Exit Threshold (-3%)", color=color.rgb(255, 0, 0))
fill(p_sma, p_upper, color=color.new(color.green, 80), title="Entry Zone")
// Draw marker only if 366 days passed without a sell
if isAnniversary
label.new(bar_index, high, "366 DAYS - PHASE 2", style=label.style_label_down, color=color.yellow, textcolor=color.black, size=size.small)
// === Entry/Exit Labels ===
newOpen = strategy.position_size > 0 and strategy.position_size == 0
newClose = strategy.position_size == 0 and strategy.position_size > 0
if newOpen
label.new(x=bar_index, y=low * 0.97, text="BUY - PHASE 1", xloc=xloc.bar_index, yloc=yloc.price, color=color.lime, style=label.style_label_up, textcolor=color.black, size=size.small)
if newClose
label.new(x=bar_index, y=high * 1.03, text="SELL - PHASE 3", xloc=xloc.bar_index, yloc=yloc.price, color=color.red, style=label.style_label_down, textcolor=color.white, size=size.small)
200 SMA SPY Trading Range Bands Script:
//
@version=
5
indicator("200 SMA SPY Trading Range Bands", overlay=true)
// === Settings ===
smaLength = input.int(200, title="SMA Length")
mult1 = input.float(1.09, title="Multiplier 1 (9% Over)")
mult2 = input.float(1.15, title="Multiplier 2 (15% Over)")
// === Calculations ===
smaValue = ta.sma(close, smaLength)
line9Over = smaValue * mult1
line15Over = smaValue * mult2
// === Plotting ===
plot(smaValue, title="200 SMA", color=color.gray, linewidth=1, style=plot.style_linebr)
plot(line9Over, title="9% Over 200 SMA", color=color.rgb(255, 145, 0), linewidth=1)
plot(line15Over, title="15% Over 200 SMA", color=color.rgb(38, 1, 1), linewidth=2)

SPY Quant ML + Session Filter Strategy [CocoChoco]S&P 500 Quant: Machine Learning & Mean Reversion (Session-Filtered)
Overview
This is a professional-grade quantitative strategy designed specifically for the S&P 500. It combines classical statistical mean reversion (Z-Score) with a modern Machine Learning filter and rigorous institutional-grade risk management.
The strategy is optimized for traders who prioritize high win rates and capital preservation, specifically avoiding the "gap risk" associated with holding positions overnight.
Core Methodology
1. Statistical Entry (The Z-Score Engine)
The strategy identifies "oversold" conditions in a bullish context. It calculates the Z-Score of the price relative to its 20-period Mean (SMA). By default, it looks for a -1.2 Standard Deviation extension, signaling a high-probability "dip" ripe for a snap-back to the mean.
2. Trend & ML Filters
To avoid "catching a falling knife," the strategy uses two layers of confirmation:
Trend Filter: Only takes Long positions when the price is above the 200-period SMA, ensuring we only buy dips in a confirmed uptrend.
ML Correlation Filter: A Machine Learning-inspired module that analyzes the correlation between RSI and Volatility (ATR). It only permits entries when market internal dynamics suggest a reversal is technically "healthy."
3. Institutional Risk Management
This script is built for "safety-first" automation:
Hard Stop Loss: Fixed at 1.5% to protect against sudden market shocks.
Active Trailing: A dual-trigger trailing stop. It activates once the price touches the 20 SMA (The Mean) OR once a trade reaches a 0.50% profit threshold. This ensures near-winners are protected and large runners are captured.
Intraday Circuit Breaker: Includes a Max Daily Drawdown (2%) limit. If hit, the script automatically closes losing positions and halts trading for the day, while allowing winning positions to continue.
Key Features
Session-Specific: Tailored for the US Trading Session (UTC/NY times).
Zero Overnight Risk: Automatically flattens all positions before the market close (16:00 NY Time).
Holiday Intelligence: Hard-coded logic for US Market Holidays and Early Closes (2026–2028), ensuring the bot doesn't get stuck in illiquid holiday markets.
Hourly Entry Cap: Limits entries to one per hour to prevent over-concentration during a single price leg.
How to Use
Timeframe: I suggest you use it on the 5-minute or 1-hour timeframe for optimal results.
Instrument: Designed for the S&P 500, but highly effective on SPY, IVV, and ES (Futures).
Pyramiding: Designed to handle up to 3 concurrent positions, allowing the strategy to scale into a move as the Z-Score deepens.
Automation Ready
This script is fully compatible with webhook-based automation tools. All signals (Entry, SL, Trail, Market Close, and Daily Limit) are clearly labeled in the Alert comments for seamless execution. I haven't tasted it though. This is not financial advice. Please perform your own tests and manage your risk.
Disclaimer
Past performance does not guarantee future results. This script is a tool for quantitative analysis and should be used as part of a broader diversified trading plan.

Custom Step Bar CountHere is a professional description for your TradingView script, suitable for the "Description" field when publishing.
I have provided two versions: a **Standard Version** (detailed and professional) and a **Short Version** (concise).
### Option 1: Standard Version (Recommended for Publishing)
**Title:** Custom Step Bar Count
**Description:**
This indicator is an advanced bar counting tool designed for traders who need to track time cycles or specific bar sequences with custom arithmetic progressions. Unlike standard counters that simply display "1, 2, 3," this script allows you to decouple the **display frequency** from the **displayed value**.
The counter automatically resets at the beginning of every new trading day.
**Key Features:**
* **Custom Display Interval:** Choose how often a label appears (e.g., every 5 bars).
* **Custom Number Increment:** Define the value step for the displayed numbers (e.g., count by 3s).
* **Daily Reset:** The count restarts automatically at the beginning of each session.
* **Visual Customization:** Adjust label size and text color to fit your chart theme.
**How it works (Example):**
If you want to track a cycle where every **5th** bar represents a value of **3**:
1. Set **Display Every X Bars** to `5`.
2. Set **Number Increment** to `3`.
**Result:**
* Bar 5 shows label "**3**"
* Bar 10 shows label "**6**"
* Bar 15 shows label "**9**"
This is particularly useful for specific time-based strategies, Gann analysis, or backtesting setups that require non-linear counting.
---
### Option 2: Short Version (Concise)
**Title:** Custom Step Bar Count
**Description:**
A flexible bar counting utility that resets daily. This script allows you to customize both the frequency of the labels and the numeric step value.
**Settings:**
* **Display Every X Bars:** Controls the gap between labels (e.g., every 5th bar).
* **Number Increment:** Controls the number sequence (e.g., increments of 3).
**Example:**
With an interval of **5** and an increment of **3**, the script will display:
* 5th Bar: **3**
* 10th Bar: **6**
* 15th Bar: **9**
Includes options for text color and label size. Updated for Pine Script v6.

Bullish Divergent Bar DCA Strategy [Skyrexio]Overview
Bullish Divergent Bar DCA Strategy is a long-only, multi-layer Dollar-Cost Averaging (DCA) strategy that builds positions around bullish divergent bars formed below the Williams Alligator. It detects potential local bottoms and then scales into the move using up to four pyramiding entries, each with its own size and price threshold. The strategy optionally incorporates Market Facilitation Index (MFI) and Awesome Oscillator (AO) momentum to strengthen reversal confirmation and uses ATR-based take profit on the averaged entry price.
Unique Features
Layered DCA entries with equity-based sizing . It supports up to four DCA layers, where each additional layer is opened only after a configurable percentage drawdown from the first entry and position size is computed as a fraction of current equity via a geometric weighting scheme.
Optional AO and MFI confirmation . Users can require Awesome Oscillator momentum divergence, MFI/volume “squat” bars, or both to confirm that the reversal bar is accompanied by capitulation and weakening downside momentum.
ATR-based dynamic take profit . Take profit is defined as a multiple of ATR added to the current average entry price, automatically adjusting exits to prevailing volatility.
Built-in DCA visualization . The script can plot the initial entry level and all DCA thresholds to make the averaging structure and risk visually transparent on the chart.
Methodology
The core entry logic starts from a bullish divergent bar definition: the bar must close above its midpoint (close > hl2) and be the lowest low within the user-defined lookback window, flagging a local swing low. On top of this, the bar must form entirely below all three Alligator lines, ensuring that the pattern appears after a sustained downside move rather than inside noise.
If enabled, AO adds a momentum filter by requiring the Awesome Oscillator difference to be negative (descending bar on AO histogram), signaling fading downside momentum at the potential bottom. If the MFI filter is enabled, the bar (or one of the last two bars) must be a “squat” bar where spread narrows while volume increases, approximating effort vs. result exhaustion.
Once a valid bullish reversal bar is detected and the time is within the configured trading window, the strategy opens the first DCA layer using a stop entry at the bar’s high (confirmation level), only entering if price actually breaks the bar high. Additional layers (second, third, and fourth entries) are only allowed if price trades below percentage thresholds from the first entry price and a new valid bullish reversal bar forms, thereby averaging down into deep pullbacks while still requiring fresh reversal evidence.
While any DCA position is open, the strategy continuously recalculates the take profit as the current volume-weighted average entry price plus ATR multiplied by a user-defined factor. All individual entries share the same take profit level through separate strategy exit calls, so the entire stacked position exits together once price has moved sufficiently above the averaged entry.
Strategy settings
In the inputs window, users can configure the following strategy settings:
sourceUuid / secretToken: Identifiers used to format JSON alerts for automated execution through webhooks.
Trade Start Date/Time: Beginning of the backtest/live-trading window.
Trade Stop Date/Time: End of the backtest/live-trading window.
Show DCA Levels (default = false): Toggles plotting of the initial entry level and all three DCA thresholds on the chart.
Enable MFI (default = false): Enables the MFI-style volume/spread filter.
Enable AO (default = false): Enables Awesome Oscillator confirmation.
Number Of Bar For Lowest Bar (default = 7): Lookback window used to identify the lowest low bar for the bullish reversal bar condition.
Layer 2 Threshold Percent (default = 4.0): Percentage drop from the first layer price that must be reached to allow the second DCA entry.
Layer 3 Threshold Percent (default = 10.0): Percentage drop from the first layer price required to unlock the third DCA layer.
Layer 4 Threshold Percent (default = 22.0): Percentage drop from the first layer price required to unlock the fourth DCA layer.
Position Size Multiplier (default = 2.0): Multiplier used in the geometric weighting scheme to determine how much equity is allocated to each additional DCA layer.
Number Of ATR For Take Profit (default = 2.0): ATR multiple added to the current average entry price to calculate the shared take profit for all open layers.
Users can refine these parameters during backtesting to fit the volatility profile and structure of the specific asset and timeframe.
Justification of Methodology
Before understanding why this particular combination of indicator has been chosen let's briefly explain what is Williams Alligator, MFI and AO.
let’s start with the Williams Alligator. Developed by Bill Williams, the Alligator is a technical indicator that identifies trends and potential market reversals. It consists of three smoothed moving averages:
Jaw (Blue Line): The slowest of the three, based on a 13-period smoothed moving average shifted 8 bars ahead.
Teeth (Red Line): The medium-speed line, derived from an 8-period smoothed moving average shifted 5 bars forward.
Lips (Green Line): The fastest line, calculated using a 5-period smoothed moving average shifted 3 bars forward.
When the lines diverge and align in order, the "Alligator" is "awake," signaling a strong trend. When the lines overlap or intertwine, the "Alligator" is "asleep," indicating a range-bound or sideways market. This indicator helps traders determine when to enter or avoid trades.
The Awesome Oscillator (AO), developed by Bill Williams, is a momentum indicator designed to measure market momentum by contrasting recent price movements with a longer-term historical perspective. It helps traders detect potential trend reversals and assess the strength of ongoing trends.
The formula for AO is as follows:
AO = SMA5(Median Price) − SMA34(Median Price)
where:
Median Price = (High + Low) / 2
SMA5 = 5-period Simple Moving Average of the Median Price
SMA 34 = 34-period Simple Moving Average of the Median Price
The Market Facilitation Index (MFI) is a technical indicator that measures the price movement per unit of volume, helping traders gauge the efficiency of price movement in relation to trading volume. Here's how you can calculate it:
MFI = (High−Low)/Volume
MFI can be used in combination with volume, so we can divide 4 states. Bill Williams introduced these to help traders interpret the interaction between volume and price movement. Here’s a quick summary:
Green Window (Increased MFI & Increased Volume): Indicates strong momentum with both price and volume increasing. Often a sign of trend continuation, as both buying and selling interest are rising.
Fake Window (Increased MFI & Decreased Volume): Shows that price is moving but with lower volume, suggesting weak support for the trend. This can signal a potential end of the current trend.
Squat Window (Decreased MFI & Increased Volume): Shows high volume but little price movement, indicating a tug-of-war between buyers and sellers. This often precedes a breakout as the pressure builds.
Fade Window (Decreased MFI & Decreased Volume): Indicates a lack of interest from both buyers and sellers, leading to lower momentum. This typically happens in range-bound markets and may signal consolidation before a new move.
For our purposes we are interested in squat bars. This is the sign that volume cannot move the price easily. This type of bar increases the probability of trend reversal. In this indicator we added to enable the MFI filter of reversal bars. If potential divergent bar or two preceding bars have squat state this bar can be interpret as a reversal one.
The strategy intentionally focuses on bullish divergent bars forming at local lows and below the Alligator to catch potential exhaustion points in downtrends where risk/reward becomes asymmetric. The Alligator (Jaw, Teeth, Lips) acts as a dynamic structure filter: requiring price to be below all three lines before reversal helps avoid chasing minor pullbacks inside an ongoing uptrend and instead concentrates entries on deeper corrections where mean reversion potential is higher.
The custom bullish divergent bar rule (close above midpoint and being the lowest low over N bars) approximates a local capitulation candle, which often precedes short squeezes or at least strong reactions. By combining this with AO and MFI-style filters, the strategy further increases the likelihood that the pattern coincides with downside momentum(as a confirmation that current trend is downward, AO difference < 0) and effort vs. result anomalies (squat bars), which is common signatures of trend exhaustion.
The DCA structure is designed to deploy capital progressively rather than all at once: the first entry is triggered only if price confirms the reversal by breaking above the bar’s high, while subsequent layers require both a deeper discount relative to the initial entry and a new bullish reversal signal. Percentage thresholds from the first entry ensure that each additional allocation is made at meaningfully better prices, improving the blended entry level and reducing the break-even distance.
Finally, using ATR as the basis for take profit aligns exits with current volatility. A fixed-percentage target can be too tight in volatile regimes or too loose in quiet markets, whereas ATR-based targets scale with average bar range. Applying ATR to the evolving average entry price of all open layers keeps the risk/reward framework consistent across different volatility regimes and DCA configurations.
Backtest Results
Operating window: Date range of backtests is 2025.01.01 - 2026.01.01. It is chosen to let the strategy to close all opened positions.
Commission and Slippage: Includes a standard Binance commission of 0.1% and accounts for possible slippage over 5 ticks.
Initial capital: 10000 USDT
Maximum Single Position Loss: -6.56%
Maximum Single Profit: +4.92%
Net Profit: +934.08 USDT (+9.34%)
Total Trades: 121 (82.64% win rate)
Profit Factor: 2.948
Maximum Accumulated Loss: 624.72 USDT (-6.15%)
Average Profit per Trade: 7.72 USDT (+0.37%)
Average Trade Duration: 60 hours
These results are obtained with realistic parameters representing trading conditions observed at major exchanges such as Binance and with realistic trading portfolio usage parameters.
You should run your own backtests on the target asset and timeframe (for example, BTC/USDT on intraday charts) and adjust threshold percentages, layer sizing, and ATR take profit factor to match your risk tolerance and market conditions.
How to Use
Add the script to favorites for easy access.
Apply to the desired timeframe and chart.
Configure settings using the dropdown choice list in the built-in menu.
Set up alerts to automate strategy positions through web hook with the text: {{strategy.order.alert_message}}
Disclaimer:
Educational and informational tool reflecting Skyrex commitment to informed trading. Past performance does not guarantee future results. Test strategies in a simulated environment before live implementation

Bank Nifty RSI Dynamic v6This is a specialized mean-reversion strategy designed for Bank Nifty (NSE:NIFTYBANK) on the 5-minute timeframe. It focuses on capturing rapid reversals when the market reaches extreme overbought or oversold conditions based on the Relative Strength Index (RSI).
Unlike standard RSI strategies that wait for a cross back into the neutral zone, this script uses asymmetric dynamic exits to lock in profits early as momentum shifts.
How it Works
Timeframe: Optimized for 5m (Intraday).
Bullish Entry (Call): Triggers when the RSI closes below 30. This identifies a potential "exhaustion" in selling pressure.
Bearish Entry (Put): Triggers when the RSI closes above 68. This identifies a potential "overextension" in buying pressure.
Dynamic Exits:
Calls are closed when RSI recovers to 45.
Puts are closed when RSI cools down to 56.
Position Sizing: Fixed at 3 Lots (90 units), calibrated for the 2026 Bank Nifty lot size.
Key Features
Pine Script v6: Built using the latest TradingView standards for faster execution and better backtesting accuracy.
Capital Efficiency: Includes a zero-margin override to ensure the backtester reflects the full 3-lot position regardless of account leverage settings.
Visual Signals: Uses clear plotshape triangles (Green for Call, Red for Put) directly on the price chart for easy manual execution or alert monitoring.
Risk Disclaimer
Bank Nifty is highly volatile. This strategy does not include a fixed stop loss by default (exits are momentum-based), so users should be prepared for drawdowns during strong trending phases where RSI remains in extreme zones for extended periods. Always backtest on your preferred broker's data before going live.

VWAP Tension Bands + Osc Sigma Gap [MAXmks]Hello Traders,
This indicator started as an accident. I was building a different tool — a multi-metric dashboard — and added VWAP deviation as one of the components. I expected it to help catch falling knives. It didn't.
But I noticed something else. During cooling-off periods — when volatility fades and price just sits there, not really going anywhere — VWAP deviation on lower timeframes would start climbing quietly. And more often than not, a pullback followed. Sometimes a liquidity sweep first, then a pullback. I watched this pattern for months before deciding to build a dedicated tool around it, adding oscillator confirmation to filter the noise.
This is that tool.
The core idea
Markets act like a rubber band around VWAP — the further price stretches, the higher the tension. But raw deviation isn't enough. The real question: is momentum confirming the stretch, or lagging behind?
The σ-Gap captures when these two disagree — price pushed hard, but internals haven't caught up. That's where mean-reversion setups tend to appear.
The indicator tracks VWAP deviation across 2m / 5m / 15m simultaneously and compares it against a composite of momentum oscillators (Williams %R, CVD-based metrics). Signals require multi-timeframe consensus — no single timeframe can trigger alone.
Adaptive thresholds
What counts as "extreme" isn't fixed. Distance is measured in standard deviations (σ) , not pips or percentages — so the indicator adapts to volatility automatically. Thresholds scale with regime and historical distribution, adjusting to current market conditions in real time.
Two modes
Standard — adaptive thresholds, more signals. Good for active sessions and exploration.
High Precision — adds divergence confirmation from multiple oscillators (MFI, Delta RSI, CVD Z-Score). Fewer signals, higher selectivity.
Extreme Tension
When σ-Gap exceeds 1.6× the threshold, the indicator can fire without full confirmation. Rare, but these are the "overstretched" moments worth watching.
Filters (so you don't trade ghosts)
RVOL filter blocks signals during low activity. Session close filter avoids entries near VWAP reset. 24h volume filter skips illiquid instruments. Cooldown prevents signal clustering in the same direction.
Best use case
Built for short-term mean-reversion — quick snapback plays on 5m–15m charts where price overextends and reverts within a few candles. The engine is optimized for this rhythm, not for trend-following or swings.
On-chart
Tension Bands show dynamic threshold zones around VWAP. Signals are non-repainting and confirmed on bar close. Compact HUD displays all metrics, filter states, and signal status in real time.
Alerts
Pre-signal alerts when conditions start forming. Confirmed signal alerts with full breakdown: VWAP deviation values, σ-Gap readings, divergences detected, current mode.
Volume matters
This is a VWAP-based indicator. No volume data = no signal. If your instrument shows "No Volume" in the dashboard, switch to a data feed that provides it (crypto spot, futures, stocks with real volume).
A note on expectations
I use this logic in my own research and it has shown useful results for me in my backtesting scenarios. But this is an indicator for analysis , not a magic button. Your execution, fees, slippage, and market regime all matter. Treat signals as context, not commands. DYOR.
Feedback welcome.
For educational and analysis purposes only. Not financial advice.

Adaptive AI SuperTrend [AlgoPoint]🚀 Adaptive AI SuperTrend
Adaptive AI SuperTrend is a high-performance trading terminal that redefines trend-following by integrating Machine Learning (ML) principles with advanced market regime detection. Unlike static indicators, this system dynamically recalibrates its internal parameters to match the ever-changing volatility of the financial markets.
Equipped with a custom "Wizard Engine," it filters out market noise during consolidation and identifies high-probability trend continuation points, making it an essential tool for scalpers, day traders, and swing traders alike.
🧠 What Makes it "AI"?
While traditional indicators use fixed rules, Adaptive AI SuperTrend utilizes Algorithmic Intelligence to make real-time decisions:
KNN-Inspired Adaptation: The engine analyzes the last 150 bars of volatility and trend strength to automatically adjust its sensitivity.
Market Regime Intelligence: It distinguishes between "Trending" and "Ranging" states using a sophisticated Squeeze Momentum module, preventing "whipsaws" during low-volume periods.
Self-Backtesting Logic: The indicator continuously calculates its own historical Win-Rate. If the probability of success falls below a certain threshold, it suppresses lower-quality signals.
🛠 Key Features
Dynamic Consolidation Boxes: Automatically identifies and wraps "choppy" price action in professional gray boxes. It waits for 3+ bars of consolidation before marking the zone, helping you spot breakout opportunities early.
Multi-Strategy Aggression:
- Conservative: Filtered signals for long-term trend following.
- Balanced: Optimized for daily volatility.
- Aggressive: High-frequency signals for capturing micro-trends.
Dual-Exit Risk Management:
- ATR TP-SL Mode: Sets mathematical targets based on market volatility with persistent on-screen lines.
- Smart Trailing Mode: Rides the trend to its exhaustion point. Includes intelligent labeling (🎯 TP or 🛑 SL) based on the trade's net profitability.
- RSI Pullback Confirmation: Beyond simple trend flips, it detects "buy the dip" or "sell the rip" opportunities within an existing trend using RSI 50-level crossovers.
📊 Real-Time Analytics Dashboard
The integrated AlgoPoint Dashboard provides a surgical view of the market:
- Market State: Instant "Trending" vs. "Ranging" (Consolidation) detection.
- Trend Strength: ADX-based momentum tracking.
- Strategy Status: Real-time feedback on your active aggression and exit modes.
🎨 Clean Charting & Customization
Built for professional clarity, you have total control over the UI:
Toggle Consolidation Boxes on/off.
Toggle ATR Target Lines and Exit Labels.
Customize background filters and dashboard visibility.

Daily Bias Panel (with MTF Toggle)Daily Bias Panel Documentation
Overview
The Daily Bias Panel is a TradingView indicator designed to provide a structured, multi factor assessment of market direction for intraday and swing traders. It consolidates several key bias components—Prior Day levels, VWAP, Overnight High/Low, Multi Timeframe Market Structure, and an Overall Bias—into a clean, compact table. A confidence meter summarizes the combined strength of all signals.
This document explains each line item, the rules behind it, and how to interpret the panel.
1. Prior Day Bias
Definition
Compares the current price to the previous day’s high and low.
Rules
• Bullish (1): Close > Prior Day High
• Bearish (-1): Close < Prior Day Low
• Neutral (0): Price is between the prior high and low
Interpretation
This bias reflects whether the market is breaking out above or below the previous day’s range. It is a foundational directional signal.
2. VWAP Bias
Definition
Measures whether price is trading above or below the Volume Weighted Average Price.
Rules
• Bullish (1): Close > VWAP
• Bearish (-1): Close < VWAP
• Neutral (0): Price is at VWAP
Interpretation
VWAP is a widely used institutional benchmark. Trading above VWAP suggests buyers are in control; below VWAP suggests sellers dominate.
3. ONH / ONL Bias (Overnight High / Low)
Definition
Tracks the overnight session’s high and low (18:00–09:30 ET) and compares current price to those levels.
Rules
• Bullish (1): Close > Overnight High
• Bearish (-1): Close < Overnight Low
• Neutral (0): Price is inside the overnight range
Interpretation
ONH/ONL is extremely important for index futures (ES/NQ). Breaking ONH/ONL often signals strong directional intent at the RTH open.
4. Struct MTF (Market Structure Bias)
Definition
A weighted blend of market structure trends across multiple timeframes.
Modes
Swing Mode
• 4H (50%)
• 1H (30%)
• 15M (20%)
Intraday Mode
• 1H (40%)
• 15M (35%)
• 5M (25%)
Rules
Each timeframe is classified as:
• Bullish (1): Higher High + Higher Low
• Bearish (-1): Lower High + Lower Low
• Neutral (0): No clear structure
The weighted average produces a final structure score.
Interpretation
This is your trend engine. It smooths noise and provides a stable directional backbone.
5. Overall Bias
Definition
A strict agreement filter between Prior Day Bias and VWAP Bias.
Rules
• Bullish (1): Both Prior Day and VWAP are bullish
• Bearish (-1): Both are bearish
• Neutral (0): Any disagreement
Interpretation
This prevents false positives by requiring alignment between two major bias components.
6. Confidence Score
Definition
A weighted blend of all bias components:
• Prior Day (25%)
• VWAP (25%)
• ONH/ONL (20%)
• MTF Structure (30%)
Output
A normalized score between -1.00 and +1.00.
Interpretation
• +1.00: Strong bullish alignment across all systems
• -1.00: Strong bearish alignment
• 0.00: Mixed or unclear conditions
7. Confidence Meter (10 Square Visual)
Definition
A visual representation of the confidence score.
Rules
• 0–10 squares filled based on absolute confidence
• Color reflects direction (green/red/yellow)
Interpretation
A quick glance gauge of trend strength.
8. Debug Mode (Optional)
Purpose
Displays all underlying levels and bias markers directly on the chart.
Includes
• Prior High / Low
• VWAP
• ONH / ONL
• Confidence Score line
• Bias markers (P, V, O, M)
Use Case
Great for verifying logic, backtesting visually, and understanding how each component behaves.
9. Panel Layout & Spacing
Top Left Spacer System
When the panel is placed in the top left corner, a 3 row spacer pushes it below the chart header and indicator dropdown.
Panel Size Options
• Small
• Medium
• Large
These adjust font sizes and meter padding.
______________________________________________________________________________
Summary
The Daily Bias Panel is a compact, multi factor decision tool that blends:
• Prior Day context
• VWAP positioning
• Overnight session dynamics
• Multi timeframe trend structure
• A strict overall bias filter
• A confidence scoring engine
Together, these components give traders a clear, structured view of market direction and strength.
This documentation should serve as a complete reference for understanding, using, and publishing the indicator.

10 Youtube Opening Range Strategies + Backtest 1. Quick Flip Scalper
A strategy centered on fading or following the initial move relative to the Opening Range (OR).
LONG Rules:
Reversal Mode: If the Opening Range is Bearish (Red), enter Long when price drops below the Opening Range Low (ORL).
Continuity Mode: If the Opening Range is Bullish (Green), enter Long when price drops below the Opening Range Low (ORL) (Buying the deep pullback/trap).
SHORT Rules:
Reversal Mode: If the Opening Range is Bullish (Green), enter Short when price breaks above the Opening Range High (ORH).
Continuity Mode: If the Opening Range is Bearish (Red), enter Short when price breaks above the Opening Range High (ORH) (Selling the deep pullback/trap).
2. First Candle Scalper
Identical to the Quick Flip Scalper but restricts entries to the very first retest only.
LONG Rules:
Same as Quick Flip Long, but only triggers once per session.
SHORT Rules:
Same as Quick Flip Short, but only triggers once per session.
3. Smart Money Trap (SMT)
Identifies a "fakeout" breakout followed immediately by a reversal candlestick pattern.
LONG Rules:
Condition: The previous candle low was below the ORL, but the candle closed back inside (above ORL).
Trigger: Must have a Bullish Engulfing or Bullish Rejection pattern closing above the ORL.
SHORT Rules:
Condition: The previous candle high was above the ORH, but the candle closed back inside (below ORH).
Trigger: Must have a Bearish Engulfing or Bearish Rejection pattern closing below the ORH.
4. Trident Pattern (TG Capital)
A London-session exclusive strategy requiring a Fair Value Gap (FVG) and a Doji confirmation.
LONG Rules:
Filter: Price is Above the 200 EMA (if enabled).
Setup: A Bullish FVG forms.
Confirmation: A Doji candle wicks down into the 50% level of the FVG.
Trigger: Enter on the next candle close.
SHORT Rules:
Filter: Price is Below the 200 EMA (if enabled).
Setup: A Bearish FVG forms.
Confirmation: A Doji candle wicks up into the 50% level of the FVG.
Trigger: Enter on the next candle close.
5. OTE Framework (MBB Trader)
Simulates an Optimal Trade Entry by combining a Liquidity Sweep with a Market Structure Shift (SMR).
LONG Rules:
Sweep: Price drops below the lowest low of the last 20 candles.
Structure: A Bullish SMR forms (Low → High → Lower Low → Higher High).
SHORT Rules:
Sweep: Price breaks above the highest high of the last 20 candles.
Structure: A Bearish SMR forms (High → Low → Higher High → Lower Low).
6. Liquidity Trap (Marco Trades)
A contrarian strategy that buys/sells purely on sweeps of major structural levels.
LONG Rules:
Trigger: Price sweeps (drops below) the lowest low of the last 50 candles.
SHORT Rules:
Trigger: Price sweeps (breaks above) the highest high of the last 50 candles.
7. Trojan Horse (Trader Mayne)
Uses Trend EMAs (50 & 200) to identify direction, then enters on a Lower Timeframe Breaker.
LONG Rules:
Trend: 50 EMA > 200 EMA (Uptrend).
Trigger: Price sweeps a recent 10-candle low, then immediately breaks a recent 5-candle high.
SHORT Rules:
Trend: 50 EMA < 200 EMA (Downtrend).
Trigger: Price sweeps a recent 10-candle high, then immediately breaks a recent 5-candle low.
8. Simplified SMT (9:30 Range)
Focuses on the 9:30 AM range. Waits for a breakout and a confirmed failure to sustain it.
LONG Rules:
Context: Price previously broke above the ORH.
Trigger: Price returns to the ORH (Retest) with a Bullish Engulfing/Rejection pattern.
SHORT Rules:
Context: Price previously broke below the ORL.
Trigger: Price returns to the ORL (Retest) with a Bearish Engulfing/Rejection pattern.
9. 9:30 One-Candle (Scarface)
Uses the high/low of the single 9:30 candle as the range.
LONG Rules:
Setup: Price closes above the 9:30 High.
Trigger: Price pulls back and touches/dips into the 9:30 High (Retest).
SHORT Rules:
Setup: Price closes below the 9:30 Low.
Trigger: Price pulls back and touches/wicks into the 9:30 Low (Retest).
10. London Breakout (Joovier)
Based on the 3 AM - 9 AM EST box.
LONG Rules:
Trigger: A candle's Body (Open and Close) forms completely above the Box High after the session opens.
SHORT Rules:
Trigger: A candle's Body (Open and Close) forms completely below the Box Low after the session opens.
⚠️ DISCLAIMER & LIMITATION OF LIABILITY
1. NO AFFILIATION / INDEPENDENT PROJECT This script is an independent coding project created solely for testing, research, and entertainment purposes. The creator of this indicator is not associated, affiliated, endorsed by, or in any way connected to the strategy authors or influencers mentioned within the tool (including but not limited to TG Capital, MBB Trader, Marco Trades, Trader Mayne, Scarface, or Joovier).
The strategy names are used strictly for identification purposes to credit the original concept creators.
This code represents an independent interpretation of public trading concepts. It may not reflect the exact, proprietary, or private methods taught by these individuals.
This is not an official product from any of the aforementioned parties.
2. FOR EDUCATIONAL PURPOSES ONLY This indicator is strictly for educational and informational purposes. It is not a signal service and does not constitute investment, financial, or trading advice. The buy/sell labels generated by this script are merely visual representations of specific code logic and should not be interpreted as instructions to execute trades.
3. EXCLUSION OF LIABILITY By using this script, you explicitly agree that:
The creator assumes no responsibility or liability for any direct, indirect, consequential, or incidental losses or damages resulting from the use of this tool.
You engage in trading entirely at your own risk.
You release the creator from any legal responsibility regarding your trading activities or financial results.
4. HYPOTHETICAL PERFORMANCE The statistics displayed on the "Dashboard" (Win Rate, P&L, etc.) are hypothetical and based on historical backtesting data.
Past performance is not indicative of future results.
These results do not account for slippage, spreads, commission fees, or real-time liquidity issues.
Strategies that performed well in the past may fail in current or future market conditions.
5. HIGH-RISK WARNING Trading in financial markets (Stocks, Forex, Crypto, Futures) involves a high degree of risk and is not suitable for all investors. You could lose some or all of your initial investment. You should not trade with money that you cannot afford to lose.
IF YOU DO NOT AGREE WITH THESE TERMS, DO NOT USE THIS SCRIPT.

MACD-V (Volatility Normalized MACD)Award-Winning Momentum Indicator by Alex Spiroglou (CMT Charles Dao Award & NAAIM Founders Award, 2022)
The classic MACD has powered trading decisions for decades, but it suffers from five major limitations that undermine consistency:
1- Readings are not comparable over time (absolute price dependency causes massive scale differences across decades)
2- Not comparable across markets or assets (e.g., stocks vs. forex vs. crypto)
3- No universal overbought/oversold levels
4- Excessive whipsaws in low-momentum/range-bound conditions
5- Lagging signals in high-momentum reversals (e.g., missing big chunks of V-shaped recoveries)
MACD-V solves all five issues by normalizing momentum against volatility instead of price.
Core Formula
MACD-V = (EMA(12) - EMA(26)) / ATR(26) × 100
This expresses momentum in units of Average True Range (ATR), creating a volatility-adjusted oscillator that remains mathematically meaningful and comparable:
-Analysts can use MACD-V across any timeframe:
-Across any asset class (stocks, forex, commodities, bonds, crypto)
-Over decades of history
Key Features & Benefits
Time-stable & cross-market comparable: A +100 reading today has the same meaning as +100 in the past years, regardless of asset or price level.
Universal extremes: ±150 captures ~95% of all readings across markets → extreme/stretched momentum.
Momentum Lifecycle Roadmap (objective framework):
+150 or < -150: Extreme / overstretched (high reversal risk)
+50 to +150 or -50 to -150: Strong directional momentum (rallying, retracing, rebounding, reversing)
-50 to +50: Neutral / low momentum / ranging (avoid most signals — high whipsaw zone)
Range Rules for regime context: In bullish regimes (price > 200 EMA), -50 to -150 becomes the practical oversold zone; readings below -100 are rare and often powerful buy setups. Opposite in bearish regimes.
Improved signal quality: Filter whipsaws in neutral zone, anticipate lag in extremes, prioritize high-probability crosses in strong-momentum bands.
MACD-V Histogram (MACD-VH): Normalized short-term momentum with extremes at ±40 for fast reversal detection.
Backtesting & strategy-friendly: Enables reliable historical analysis, cross-asset relative strength, and systematic rules
MACD-V transforms momentum from subjective art into objective, repeatable science — giving you consistent, actionable insights no matter what you're trading.
Use it standalone or layer with trend filters (e.g., 200 EMA), volume, or price action for even stronger edges.
Developer: Alex Spiroglou
Open-source versions inspired by his work — feel free to fork and improve!
Happy trading! 🚀

TSM 1987 RSI + Supertrend + High Volume StrategyRSI + Supertrend + High Volume Strategy is a rule-based trading strategy designed to capture high-probability trend reversals and continuations using a combination of trend, momentum, and volume confirmation.
The strategy uses Supertrend to identify the primary market direction, RSI to confirm momentum strength, and High Volume to validate participation from strong market players. Trades are triggered only when all conditions align, helping to filter out low-quality signals.
Each BUY and SELL signal is plotted on the chart along with the exact trade date, and the script is fully compatible with TradingView’s Strategy Tester for backtesting performance across different markets and timeframes.
🔑 Core Logic
BUY
Supertrend turns bullish
RSI is above the defined trend level
Volume is significantly higher than average
SELL
Supertrend turns bearish
RSI is below the defined trend level
Volume confirms strong selling pressure
🎯 Best Use
Works well for intraday and swing trading
Suitable for stocks, indices, crypto, and forex
Designed for trend-following with confirmation
⚠️ Disclaimer
This strategy is for educational purposes only.
Always use proper risk management and stop-loss.
Past performance does not guarantee future results.

TSM RSI + Supertrend + High Volume Strategy (BACKTESTED) 1987RSI + Supertrend + High Volume Strategy is a rule-based trading strategy designed to capture high-probability trend reversals and continuations using a combination of trend, momentum, and volume confirmation.
The strategy uses Supertrend to identify the primary market direction, RSI to confirm momentum strength, and High Volume to validate participation from strong market players. Trades are triggered only when all conditions align, helping to filter out low-quality signals.
Each BUY and SELL signal is plotted on the chart along with the exact trade date, and the script is fully compatible with TradingView’s Strategy Tester for backtesting performance across different markets and timeframes.
Core Logic
BUY
Supertrend turns bullish
RSI is above the defined trend level
Volume is significantly higher than average
SELL
Supertrend turns bearish
RSI is below the defined trend level
Volume confirms strong selling pressure
🎯 Best Use
Works well for intraday and swing trading
Suitable for stocks, indices, crypto, and forex
Designed for trend-following with confirmation
⚠️ Disclaimer
This strategy is for educational purposes only.
Always use proper risk management and stop-loss.
Past performance does not guarantee future results.

AI Adaptive Trend Navigator Strategy Echo EditionAI Adaptive Trend Navigator Strategy
This is a professional long-only automated strategy optimized for Taiwan Index Futures (TX). Based on the LuxAlgo clustering framework, this version features advanced logic iteration for institutional-grade backtesting and execution.
1. Realistic Cost Modeling To ensure backtest reliability, this strategy is pre-configured with:
Slippage: 2 ticks (Approx. 400 TWD per side).
Commission: 100 TWD per side.
Total Cost: 500 TWD per side. This provides a rigorous stress test for real-world trading environments.
2. State Consistency & Logic Continuity Optimized the underlying array handling to ensure "State Persistence." This eliminates the logic gaps common in real-time script execution, ensuring that historical signals are 100% consistent with live alerts.
3. Adaptive AI Clustering Utilizes K-means clustering to dynamically select the optimal ATR factors based on current market volatility, allowing the strategy to "evolve" as market regimes shift.
🧠 開發理念:追求實戰一致性的量化策略 本策略旨在為台指期(TX)提供一套具備真實參考價值的自動化系統。
✨ Echo 版核心優化點
數據連續性迭代:修正底層邏輯,確保訊號在即時盤勢中穩定不跳斷。
真實交易成本模擬:預設 2 點滑價 與 單邊 100 TWD 手續費,單邊總成本對標 500 TWD,拒絕虛假神單,挑戰最嚴苛的回測環境。
台指期專屬參數調校:融入針對台灣市場波動特性的預設參數與過濾邏輯。
🛡️ 進階實戰過濾
空間緩衝區 (Buffer Strategy):價格需有效突破緩衝區才觸發,精準過濾盤整雜訊。
AI 信心評分系統:只有當動能穩定度達標時才會發進場訊號。
冷卻保護機制:有效抑制訊號在洗盤區間過度頻繁跳動。
⚠️ Disclaimer: Backtest results do not guarantee future performance.
