ICT Master Suite [Trading IQ]Hello Traders!
We’re excited to introduce the ICT Master Suite by TradingIQ, a new tool designed to bring together several ICT concepts and strategies in one place.
The Purpose Behind the ICT Master Suite
There are a few challenges traders often face when using ICT-related indicators:
Many available indicators focus on one or two ICT methods, which can limit traders who apply a broader range of ICT related techniques on their charts.
There aren't many indicators for ICT strategy models, and we couldn't find ICT indicators that allow for testing the strategy models and setting alerts.
Many ICT related concepts exist in the public domain as indicators, not strategies! This makes it difficult to verify that the ICT concept has some utility in the market you're trading and if it's worth trading - it's difficult to know if it's working!
Some users might not have enough chart space to apply numerous ICT related indicators, which can be restrictive for those wanting to use multiple ICT techniques simultaneously.
The ICT Master Suite is designed to offer a comprehensive option for traders who want to apply a variety of ICT methods. By combining several ICT techniques and strategy models into one indicator, it helps users maximize their chart space while accessing multiple tools in a single slot.
Additionally, the ICT Master Suite was developed as a strategy . This means users can backtest various ICT strategy models - including deep backtesting. A primary goal of this indicator is to let traders decide for themselves what markets to trade ICT concepts in and give them the capability to figure out if the strategy models are worth trading!
What Makes the ICT Master Suite Different
There are many ICT-related indicators available on TradingView, each offering valuable insights. What the ICT Master Suite aims to do is bring together a wider selection of these techniques into one tool. This includes both key ICT methods and strategy models, allowing traders to test and activate strategies all within one indicator.
Features
The ICT Master Suite offers:
Multiple ICT strategy models, including the 2022 Strategy Model and Unicorn Model, which can be built, tested, and used for live trading.
Calculation and display of key price areas like Breaker Blocks, Rejection Blocks, Order Blocks, Fair Value Gaps, Equal Levels, and more.
The ability to set alerts based on these ICT strategies and key price areas.
A comprehensive, yet practical, all-inclusive ICT indicator for traders.
Customizable Timeframe - Calculate ICT concepts on off-chart timeframes
Unicorn Strategy Model
2022 Strategy Model
Liquidity Raid Strategy Model
OTE (Optimal Trade Entry) Strategy Model
Silver Bullet Strategy Model
Order blocks
Breaker blocks
Rejection blocks
FVG
Strong highs and lows
Displacements
Liquidity sweeps
Power of 3
ICT Macros
HTF previous bar high and low
Break of Structure indications
Market Structure Shift indications
Equal highs and lows
Swings highs and swing lows
Fibonacci TPs and SLs
Swing level TPs and SLs
Previous day high and low TPs and SLs
And much more! An ongoing project!
How To Use
Many traders will already be familiar with the ICT related concepts listed above, and will find using the ICT Master Suite quite intuitive!
Despite this, let's go over the features of the tool in-depth and how to use the tool!
The image above shows the ICT Master Suite with almost all techniques activated.
ICT 2022 Strategy Model
The ICT Master suite provides the ability to test, set alerts for, and live trade the ICT 2022 Strategy Model.
The image above shows an example of a long position being entered following a complete setup for the 2022 ICT model.
A liquidity sweep occurs prior to an upside breakout. During the upside breakout the model looks for the FVG that is nearest 50% of the setup range. A limit order is placed at this FVG for entry.
The target entry percentage for the range is customizable in the settings. For instance, you can select to enter at an FVG nearest 33% of the range, 20%, 66%, etc.
The profit target for the model generally uses the highest high of the range (100%) for longs and the lowest low of the range (100%) for shorts. Stop losses are generally set at 0% of the range.
The image above shows the short model in action!
Whether you decide to follow the 2022 model diligently or not, you can still set alerts when the entry condition is met.
ICT Unicorn Model
The image above shows an example of a long position being entered following a complete setup for the ICT Unicorn model.
A lower swing low followed by a higher swing high precedes the overlap of an FVG and breaker block formed during the sequence.
During the upside breakout the model looks for an FVG and breaker block that formed during the sequence and overlap each other. A limit order is placed at the nearest overlap point to current price.
The profit target for this example trade is set at the swing high and the stop loss at the swing low. However, both the profit target and stop loss for this model are configurable in the settings.
For Longs, the selectable profit targets are:
Swing High
Fib -0.5
Fib -1
Fib -2
For Longs, the selectable stop losses are:
Swing Low
Bottom of FVG or breaker block
The image above shows the short version of the Unicorn Model in action!
For Shorts, the selectable profit targets are:
Swing Low
Fib -0.5
Fib -1
Fib -2
For Shorts, the selectable stop losses are:
Swing High
Top of FVG or breaker block
The image above shows the profit target and stop loss options in the settings for the Unicorn Model.
Optimal Trade Entry (OTE) Model
The image above shows an example of a long position being entered following a complete setup for the OTE model.
Price retraces either 0.62, 0.705, or 0.79 of an upside move and a trade is entered.
The profit target for this example trade is set at the -0.5 fib level. This is also adjustable in the settings.
For Longs, the selectable profit targets are:
Swing High
Fib -0.5
Fib -1
Fib -2
The image above shows the short version of the OTE Model in action!
For Shorts, the selectable profit targets are:
Swing Low
Fib -0.5
Fib -1
Fib -2
Liquidity Raid Model
The image above shows an example of a long position being entered following a complete setup for the Liquidity Raid Modell.
The user must define the session in the settings (for this example it is 13:30-16:00 NY time).
During the session, the indicator will calculate the session high and session low. Following a “raid” of either the session high or session low (after the session has completed) the script will look for an entry at a recently formed breaker block.
If the session high is raided the script will look for short entries at a bearish breaker block. If the session low is raided the script will look for long entries at a bullish breaker block.
For Longs, the profit target options are:
Swing high
User inputted Lib level
For Longs, the stop loss options are:
Swing low
User inputted Lib level
Breaker block bottom
The image above shows the short version of the Liquidity Raid Model in action!
For Shorts, the profit target options are:
Swing Low
User inputted Lib level
For Shorts, the stop loss options are:
Swing High
User inputted Lib level
Breaker block top
Silver Bullet Model
The image above shows an example of a long position being entered following a complete setup for the Silver Bullet Modell.
During the session, the indicator will determine the higher timeframe bias. If the higher timeframe bias is bullish the strategy will look to enter long at an FVG that forms during the session. If the higher timeframe bias is bearish the indicator will look to enter short at an FVG that forms during the session.
For Longs, the profit target options are:
Nearest Swing High Above Entry
Previous Day High
For Longs, the stop loss options are:
Nearest Swing Low
Previous Day Low
The image above shows the short version of the Silver Bullet Model in action!
For Shorts, the profit target options are:
Nearest Swing Low Below Entry
Previous Day Low
For Shorts, the stop loss options are:
Nearest Swing High
Previous Day High
Order blocks
The image above shows indicator identifying and labeling order blocks.
The color of the order blocks, and how many should be shown, are configurable in the settings!
Breaker Blocks
The image above shows indicator identifying and labeling order blocks.
The color of the breaker blocks, and how many should be shown, are configurable in the settings!
Rejection Blocks
The image above shows indicator identifying and labeling rejection blocks.
The color of the rejection blocks, and how many should be shown, are configurable in the settings!
Fair Value Gaps
The image above shows indicator identifying and labeling fair value gaps.
The color of the fair value gaps, and how many should be shown, are configurable in the settings!
Additionally, you can select to only show fair values gaps that form after a liquidity sweep. Doing so reduces "noisy" FVGs and focuses on identifying FVGs that form after a significant trading event.
The image above shows the feature enabled. A fair value gap that occurred after a liquidity sweep is shown.
Market Structure
The image above shows the ICT Master Suite calculating market structure shots and break of structures!
The color of MSS and BoS, and whether they should be displayed, are configurable in the settings.
Displacements
The images above show indicator identifying and labeling displacements.
The color of the displacements, and how many should be shown, are configurable in the settings!
Equal Price Points
The image above shows the indicator identifying and labeling equal highs and equal lows.
The color of the equal levels, and how many should be shown, are configurable in the settings!
Previous Custom TF High/Low
The image above shows the ICT Master Suite calculating the high and low price for a user-defined timeframe. In this case the previous day’s high and low are calculated.
To illustrate the customizable timeframe function, the image above shows the indicator calculating the previous 4 hour high and low.
Liquidity Sweeps
The image above shows the indicator identifying a liquidity sweep prior to an upside breakout.
The image above shows the indicator identifying a liquidity sweep prior to a downside breakout.
The color and aggressiveness of liquidity sweep identification are adjustable in the settings!
Power Of Three
The image above shows the indicator calculating Po3 for two user-defined higher timeframes!
Macros
The image above shows the ICT Master Suite identifying the ICT macros!
ICT Macros are only displayable on the 5 minute timeframe or less.
Strategy Performance Table
In addition to a full-fledged TradingView backtest for any of the ICT strategy models the indicator offers, a quick-and-easy strategy table exists for the indicator!
The image above shows the strategy performance table in action.
Keep in mind that, because the ICT Master Suite is a strategy script, you can perform fully automatic backtests, deep backtests, easily add commission and portfolio balance and look at pertinent metrics for the ICT strategies you are testing!
Lite Mode
Traders who want the cleanest chart possible can toggle on “Lite Mode”!
In Lite Mode, any neon or “glow” like effects are removed and key levels are marked as strict border boxes. You can also select to remove box borders if that’s what you prefer!
Settings Used For Backtest
For the displayed backtest, a starting balance of $1000 USD was used. A commission of 0.02%, slippage of 2 ticks, a verify price for limit orders of 2 ticks, and 5% of capital investment per order.
A commission of 0.02% was used due to the backtested asset being a perpetual future contract for a crypto currency. The highest commission (lowest-tier VIP) for maker orders on many exchanges is 0.02%. All entered positions take place as maker orders and so do profit target exits. Stop orders exist as stop-market orders.
A slippage of 2 ticks was used to simulate more realistic stop-market orders. A verify limit order settings of 2 ticks was also used. Even though BTCUSDT.P on Binance is liquid, we just want the backtest to be on the safe side. Additionally, the backtest traded 100+ trades over the period. The higher the sample size the better; however, this example test can serve as a starting point for traders interested in ICT concepts.
Community Assistance And Feedback
Given the complexity and idiosyncratic applications of ICT concepts amongst its proponents, the ICT Master Suite’s built-in strategies and level identification methods might not align with everyone's interpretation.
That said, the best we can do is precisely define ICT strategy rules and concepts to a repeatable process, test, and apply them! Whether or not an ICT strategy is trading precisely how you would trade it, seeing the model in action, taking trades, and with performance statistics is immensely helpful in assessing predictive utility.
If you think we missed something, you notice a bug, have an idea for strategy model improvement, please let us know! The ICT Master Suite is an ongoing project that will, ideally, be shaped by the community.
A big thank you to the @PineCoders for their Time Library!
Thank you!
Wyszukaj w skryptach "backtesting"

CAPE / Shiller PE RatioThe CAPE (Cyclically Adjusted Price-to-Earnings) or Shiller PE ratio is a popular valuation measure used by investors to assess whether a stock or index is over or undervalued relative to its historical earnings. Unlike the traditional P/E ratio, the CAPE ratio smooths earnings over ten years, adjusting for inflation and providing a more stable and long-term view of valuation.
This indicator lets you quickly calculate and visualize the CAPE ratio for any stock on TradingView, helping you make informed decisions about the sustainability of current price levels. With its clear presentation and intuitive setup, you can compare historical CAPE levels and identify potential opportunities for long-term investments or avoid overvalued markets.
Advantages of the CAPE Ratio:
Long-Term Focus : Smooth earnings over ten years, reducing the impact of short-term volatility.
Inflation-Adjusted : Provides a more precise, inflation-adjusted valuation measure over time.
Historical Comparison : Allows for benchmarking against long-term historical averages.
Market Sentiment Indicator : Can highlight overvalued or undervalued markets for long-term investors.
Reduces Noise : Filters out short-term earnings fluctuations, offering a more stable view.
Disadvantages of the CAPE Ratio:
Ignores Recent Earnings : Misses short-term earnings changes, which can affect current valuations.
Outdated Data : Relies on old earnings data that may not reflect recent company performance.
Less Effective for Growth Stocks : May undervalue high-growth stocks focused on future earnings.
Sector Limitations : Works best for broad markets, less so for fast-changing industries.
Debated Predictive Power : It’s unreliable for timing short-term market movements.
In short, the CAPE ratio is excellent for long-term valuation but has limitations for short-term or growth-focused investing.
Disclaimer
Please remember that past performance may not be indicative of future results.
Due to various factors, including changing market conditions, the strategy may no longer perform as well as in historical backtesting.
This post and the script don’t provide any financial advice.

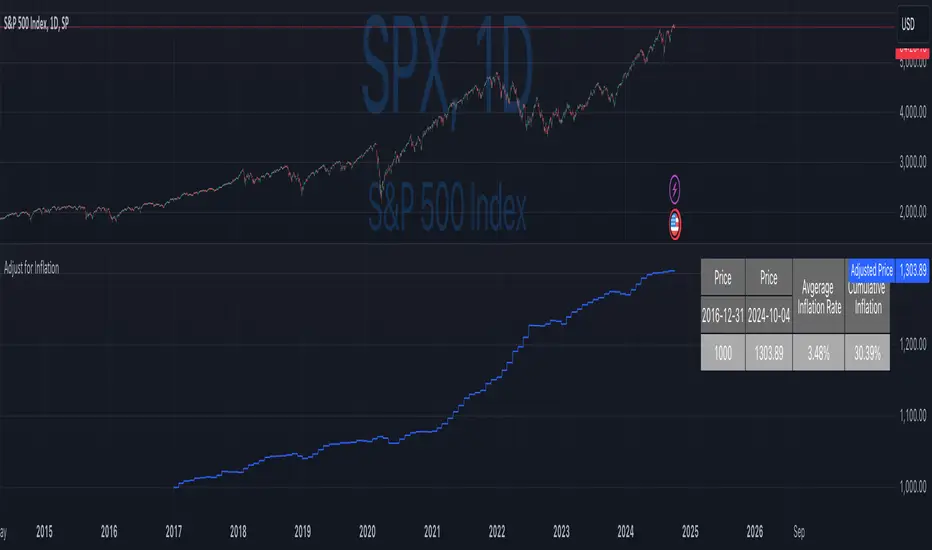
Inflation-Adjusted Price IndicatorThis indicator allows traders to adjust historical prices for inflation using customizable CPI data. The script computes the adjusted price by selecting a reference date, the original price, and the CPI source (US CPI or custom input) and plots it as a line on the chart. Additionally, a table summarizes the adjusted price values and average and total inflation rates.
While the indicator serves as a standalone tool to understand inflation's impact on prices, it is a supportive element in more advanced trading strategies requiring accurate analysis of inflation-adjusted data.
Disclaimer
Please remember that past performance may not be indicative of future results.
Due to various factors, including changing market conditions, the strategy may no longer perform as well as in historical backtesting.
This post and the script don’t provide any financial advice.
RSI 30-50-70 moving averageDescription:
The RSI 30-50-70 Moving Average indicator plots three distinct moving averages based on different RSI ranges (30%, 50%, and 70%). Each moving average corresponds to different market conditions and provides potential entry and exit signals. Here's how it works:
• RSI_30 Range (25%-35%): The moving average of closing prices when the RSI is between 25% and 35%, representing potential oversold conditions.
• RSI_50 Range (45%-55%): The moving average of closing prices when the RSI is between 45% and 55%, providing a balanced perspective for trend-following strategies.
• RSI_70 Range (65%-75%): The moving average of closing prices when the RSI is between 65% and 75%, representing potential overbought conditions.
This indicator offers flexibility, as users can adjust key parameters such as RSI ranges, periods, and time frames to fine-tune the signals for their trading strategies.
How it Works:
Like traditional moving averages, the RSI 30-50-70 Moving Averages can highlight dynamic levels of support and resistance. They offer additional insight by focusing on specific RSI ranges, providing early signals for trend reversals or continuation. The default settings can be used across various assets but should be optimized via backtesting.
Default Settings:
• RSI_30: 25% to 35% (Oversold Zone, yellow line)
• RSI_50: 45% to 55% (Neutral/Trend Zone, green line)
• RSI_70: 65% to 75% (Overbought Zone, red line)
• RSI Period: 14
Buy Conditions:
• Use the 5- or 15-minute time frame.
• Wait for the price to move below the RSI_30 line, indicating potential oversold conditions.
• Enter a buy order when the price closes above the RSI_30 line, signaling a recovery from the oversold zone.
• For a more conservative approach, use the RSI_50 line as the buy signal to confirm a trend reversal.
• Important: Before entering, ensure that the RSI_30 moving average has flattened or started to level off, signaling that the oversold momentum has slowed.
Sell Conditions:
• Use the 5- or 15-minute time frame.
• Wait for the price to close above the RSI_70 line, indicating potential overbought conditions.
• Enter a sell order when the price closes below the RSI_70 line, signaling a decline from the overbought zone.
• Important: Similar to buying, wait for the RSI_70 moving average to flatten or level off before selling, indicating the overbought conditions are stalling.
Key Features:
1. Dynamic Range Customization: The indicator allows users to modify the RSI ranges and periods, tailoring the moving averages to fit different market conditions or asset classes.
2. Trend-Following and Reversal Signals: The RSI 30-50-70 moving averages provide both reversal and trend-following signals, making it a versatile tool for short-term traders.
3. Visual Representation of Market Strength: By plotting moving averages based on RSI levels, traders can visually interpret the market’s strength and potential turning points.
4. Risk Management: The built-in flexibility allows traders to choose lower-risk entries by adjusting which RSI level (e.g., RSI_30 vs. RSI_50) they rely on for signals.
Practical Use:
Different assets respond uniquely to RSI-based moving averages, so it's recommended to backtest and adjust ranges for specific instruments. For example, volatile assets may require wider RSI ranges, while more stable assets could benefit from tighter ranges.
Checking for Buy conditions:
1st: Wait for current price to go below the RSI_30 (yellow line)
2nd: Wait and observe for bullish divergence
3rd: RSI_30 has flattened indicating potential gain of momentum after a bullish divergence.
4th: Enter a buy order when the price closed above the RSI_30, preferably when a green candle appeared.

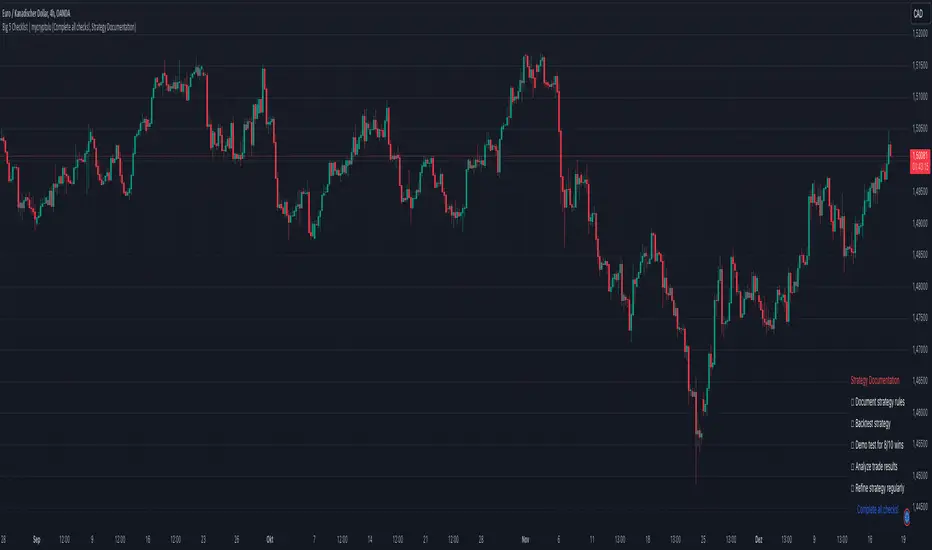
Big 5 Checklist | XEONEDIAThe Big 5 Checklist | XEONEDIA indicator is a powerful trading tool designed to help traders prepare their trading decisions in a structured and effective manner. The indicator encompasses five key areas:
Strategy Documentation :
✅ Ensure that the trading strategy is clearly defined and documented.
✅ Conduct backtesting.
✅ Perform demo testing with an 80% success rate.
✅ Analyze trading results.
✅ Regularly refine the strategy.
Risk Management :
✅ Minimize financial losses and ensure responsible trading.
✅ Set a risk limit of 1-2%.
✅ Use stop-loss orders.
✅ Ensure a risk-reward ratio of at least 2:1.
✅ Adjust position sizes.
Technical Analysis :
✅ Evaluate charts and indicators to identify trading opportunities.
✅ Identify support and resistance levels.
✅ Use technical indicators (e.g., RSI).
✅ Set entry and exit points.
✅ Establish alerts for specific market conditions.
Market Conditions :
✅ Consider external factors that may influence trading.
✅ Monitor the economic calendar.
✅ Apply fundamental analysis.
✅ Observe market volatility.
✅ Analyze global trends.
Psychological Management :
✅ Control emotions and mindset during trading.
✅ Adhere to the trading plan.
✅ Manage emotions while trading.
✅ Set realistic expectations.
✅ Take regular mental breaks.
Mastercheck
The Mastercheck provides a digital checklist where traders can track their progress live. Users can make their own notes and view their checklist on any TradingView device, ensuring they stay informed about their trading readiness and can make adjustments in real-time. ✅
Overall, the Big 5 Checklist | XEONEDIA indicator helps minimize risks and maximize the chances of successful trades by promoting systematic and comprehensive trading preparation.
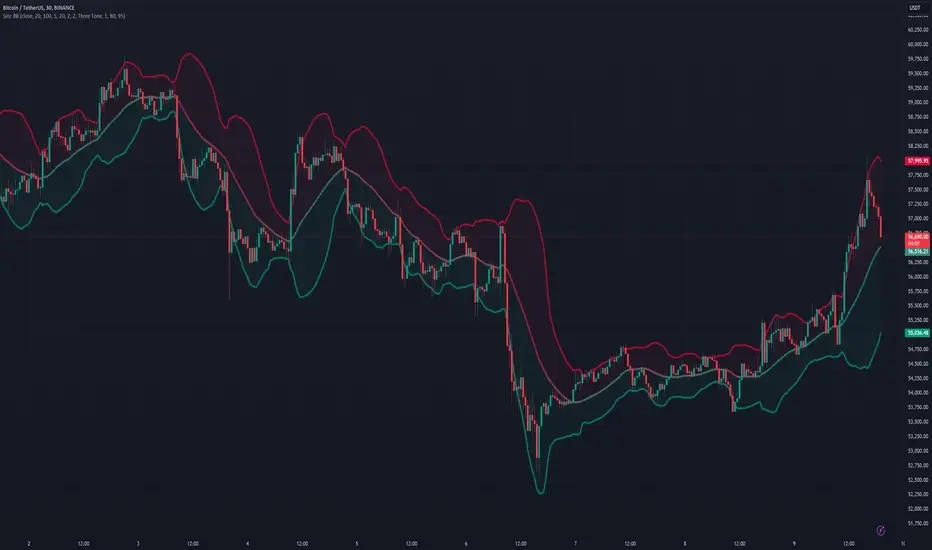
Sinc Bollinger BandsKaiser Windowed Sinc Bollinger Bands Indicator
The Kaiser Windowed Sinc Bollinger Bands indicator combines the advanced filtering capabilities of the Kaiser Windowed Sinc Moving Average with the volatility measurement of Bollinger Bands. This indicator represents a sophisticated approach to trend identification and volatility analysis in financial markets.
Core Components
At the heart of this indicator is the Kaiser Windowed Sinc Moving Average, which utilizes the sinc function as an ideal low-pass filter, windowed by the Kaiser function. This combination allows for precise control over the frequency response of the moving average, effectively separating trend from noise in price data.
The sinc function, representing an ideal low-pass filter, provides the foundation for the moving average calculation. By using the sinc function, analysts can independently control two critical parameters: the cutoff frequency and the number of samples used. The cutoff frequency determines which price movements are considered significant (low frequency) and which are treated as noise (high frequency). The number of samples influences the filter's accuracy and steepness, allowing for a more precise approximation of the ideal low-pass filter without altering its fundamental frequency response characteristics.
The Kaiser window is applied to the sinc function to create a practical, finite-length filter while minimizing unwanted oscillations in the frequency domain. The alpha parameter of the Kaiser window allows users to fine-tune the trade-off between the main-lobe width and side-lobe levels in the frequency response.
Bollinger Bands Implementation
Building upon the Kaiser Windowed Sinc Moving Average, this indicator adds Bollinger Bands to provide a measure of price volatility. The bands are calculated by adding and subtracting a multiple of the standard deviation from the moving average.
Advanced Centered Standard Deviation Calculation
A unique feature of this indicator is its specialized standard deviation calculation for the centered mode. This method employs the Kaiser window to create a smooth deviation that serves as an highly effective envelope, even though it's always based on past data.
The centered standard deviation calculation works as follows:
It determines the effective sample size of the Kaiser window.
The window size is then adjusted to reflect the target sample size.
The source data is offset in the calculation to allow for proper centering.
This approach results in a highly accurate and smooth volatility estimation. The centered standard deviation provides a more refined and responsive measure of price volatility compared to traditional methods, particularly useful for historical analysis and backtesting.
Operational Modes
The indicator offers two operational modes:
Non-Centered (Real-time) Mode: Uses half of the windowed sinc function and a traditional standard deviation calculation. This mode is suitable for real-time analysis and current market conditions.
Centered Mode: Utilizes the full windowed sinc function and the specialized Kaiser window-based standard deviation calculation. While this mode introduces a delay, it offers the most accurate trend and volatility identification for historical analysis.
Customizable Parameters
The Kaiser Windowed Sinc Bollinger Bands indicator provides several key parameters for customization:
Cutoff: Controls the filter's cutoff frequency, determining the divide between trends and noise.
Number of Samples: Sets the number of samples used in the FIR filter calculation, affecting the filter's accuracy and computational complexity.
Alpha: Influences the shape of the Kaiser window, allowing for fine-tuning of the filter's frequency response characteristics.
Standard Deviation Length: Determines the period over which volatility is calculated.
Multiplier: Sets the number of standard deviations used for the Bollinger Bands.
Centered Alpha: Specific to the centered mode, this parameter affects the Kaiser window used in the specialized standard deviation calculation.
Visualization Features
To enhance the analytical value of the indicator, several visualization options are included:
Gradient Coloring: Offers a range of color schemes to represent trend direction and strength for the moving average line.
Glow Effect: An optional visual enhancement for improved line visibility.
Background Fill: Highlights the area between the Bollinger Bands, aiding in volatility visualization.
Applications in Technical Analysis
The Kaiser Windowed Sinc Bollinger Bands indicator is particularly useful for:
Precise trend identification with reduced noise influence
Advanced volatility analysis, especially in the centered mode
Identifying potential overbought and oversold conditions
Recognizing periods of price consolidation and potential breakouts
Compared to traditional Bollinger Bands, this indicator offers superior frequency response characteristics in its moving average and a more refined volatility measurement, especially in centered mode. These features allow for a more nuanced analysis of price trends and volatility patterns across various market conditions and timeframes.
Conclusion
The Kaiser Windowed Sinc Bollinger Bands indicator represents a significant advancement in technical analysis tools. By combining the ideal low-pass filter characteristics of the sinc function, the practical benefits of Kaiser windowing, and an innovative approach to volatility measurement, this indicator provides traders and analysts with a sophisticated instrument for examining price trends and market volatility.
Its implementation in Pine Script contributes to the TradingView community by making advanced signal processing and statistical techniques accessible for experimentation and further development in technical analysis. This indicator serves not only as a practical tool for market analysis but also as an educational resource for those interested in the intersection of signal processing, statistics, and financial markets.
Related:
Price Close ProbabilityThe Price Close Probability Indicator is designed to help traders estimate the likelihood of price closing above or below specified levels within a given bar. By placing two levels on your chart, you can quickly gauge the probability of the current price bar closing above or below these levels in real-time.
Key Features:
Dynamic Probability Calculation: The indicator continuously updates the probability of price closing above or below your set levels as the current bar progresses, providing you with timely insights as the bar approaches its close.
Customizable Standard Deviation : Adjust the length of the Standard Deviation used in the calculations to tailor the probability estimates to your preferred settings.
User-Friendly Probability Table : A clean, easy-to-read table displays the calculated probabilities, helping you make informed trading decisions at a glance.
Assumptions and Considerations:
While the indicator assumes that returns are normally distributed, which may not fully reflect reality, it still offers a valuable approximation of the probabilities for price movement within the current bar.
Future Enhancements (Coming Soon):
Multi-Bar Probability: Calculate probabilities across multiple bars to enhance your forecasting capabilities.
Additional Levels: Set more than two levels for a broader analysis of price movements.
Refined Distribution Modeling: Improve the accuracy of probability calculations by adjusting for more realistic return distributions.
Disclaimer
Please remember that past performance may not be indicative of future results.
Due to various factors, including changing market conditions, the strategy may no longer perform as well as in historical backtesting.
This post and the script don’t provide any financial advice.

All Harmonic Patterns [theEccentricTrader]█ OVERVIEW
This indicator automatically draws and sends alerts for all of the harmonic patterns in my public library as they occur. The patterns included are as follows:
• Bearish 5-0
• Bullish 5-0
• Bearish ABCD
• Bullish ABCD
• Bearish Alternate Bat
• Bullish Alternate Bat
• Bearish Bat
• Bullish Bat
• Bearish Butterfly
• Bullish Butterfly
• Bearish Cassiopeia A
• Bullish Cassiopeia A
• Bearish Cassiopeia B
• Bullish Cassiopeia B
• Bearish Cassiopeia C
• Bullish Cassiopeia C
• Bearish Crab
• Bullish Crab
• Bearish Deep Crab
• Bullish Deep Crab
• Bearish Cypher
• Bullish Cypher
• Bearish Gartley
• Bullish Gartley
• Bearish Shark
• Bullish Shark
• Bearish Three-Drive
• Bullish Three-Drive
█ CONCEPTS
Green and Red Candles
• A green candle is one that closes with a close price equal to or above the price it opened.
• A red candle is one that closes with a close price that is lower than the price it opened.
Swing Highs and Swing Lows
• A swing high is a green candle or series of consecutive green candles followed by a single red candle to complete the swing and form the peak.
• A swing low is a red candle or series of consecutive red candles followed by a single green candle to complete the swing and form the trough.
Peak and Trough Prices
• The peak price of a complete swing high is the high price of either the red candle that completes the swing high or the high price of the preceding green candle, depending on which is higher.
• The trough price of a complete swing low is the low price of either the green candle that completes the swing low or the low price of the preceding red candle, depending on which is lower.
Historic Peaks and Troughs
The current, or most recent, peak and trough occurrences are referred to as occurrence zero. Previous peak and trough occurrences are referred to as historic and ordered numerically from right to left, with the most recent historic peak and trough occurrences being occurrence one.
Upper Trends
• A return line uptrend is formed when the current peak price is higher than the preceding peak price.
• A downtrend is formed when the current peak price is lower than the preceding peak price.
• A double-top is formed when the current peak price is equal to the preceding peak price.
Lower Trends
• An uptrend is formed when the current trough price is higher than the preceding trough price.
• A return line downtrend is formed when the current trough price is lower than the preceding trough price.
• A double-bottom is formed when the current trough price is equal to the preceding trough price.
Range
The range is simply the difference between the current peak and current trough prices, generally expressed in terms of points or pips.
Wave Cycles
A wave cycle is here defined as a complete two-part move between a swing high and a swing low, or a swing low and a swing high. The first swing high or swing low will set the course for the sequence of wave cycles that follow; for example a chart that begins with a swing low will form its first complete wave cycle upon the formation of the first complete swing high and vice versa.
Figure 1.
Retracement and Extension Ratios
Retracement and extension ratios are calculated by dividing the current range by the preceding range and multiplying the answer by 100. Retracement ratios are those that are equal to or below 100% of the preceding range and extension ratios are those that are above 100% of the preceding range.
Fibonacci Retracement and Extension Ratios
The Fibonacci sequence is a series of numbers in which each number is the sum of the two preceding numbers, starting with 0 and 1. For example 0 + 1 = 1, 1 + 1 = 2, 1 + 2 = 3, and so on. Ultimately, we could go on forever but the first few numbers in the sequence are as follows: 0 , 1, 1, 2, 3, 5, 8, 13, 21, 34, 55, 89, 144.
The extension ratios are calculated by dividing each number in the sequence by the number preceding it. For example 0/1 = 0, 1/1 = 1, 2/1 = 2, 3/2 = 1.5, 5/3 = 1.6666..., 8/5 = 1.6, 13/8 = 1.625, 21/13 = 1.6153..., 34/21 = 1.6190..., 55/34 = 1.6176..., 89/55 = 1.6181..., 144/89 = 1.6179..., and so on. The retracement ratios are calculated by inverting this process and dividing each number in the sequence by the number proceeding it. For example 0/1 = 0, 1/1 = 1, 1/2 = 0.5, 2/3 = 0.666..., 3/5 = 0.6, 5/8 = 0.625, 8/13 = 0.6153..., 13/21 = 0.6190..., 21/34 = 0.6176..., 34/55 = 0.6181..., 55/89 = 0.6179..., 89/144 = 0.6180..., and so on.
Fibonacci ranges are typically drawn from left to right, with retracement levels representing ratios inside of the current range and extension levels representing ratios extended outside of the current range. If the current wave cycle ends on a swing low, the Fibonacci range is drawn from peak to trough. If the current wave cycle ends on a swing high the Fibonacci range is drawn from trough to peak.
Measurement Tolerances
Tolerance refers to the allowable variation or deviation from a specific value or dimension. It is the range within which a particular measurement is considered to be acceptable or accurate. I have applied this concept in my pattern detection logic and have set default tolerances where applicable, as perfect patterns are, needless to say, very rare.
Chart Patterns
Generally speaking price charts are nothing more than a series of swing highs and swing lows. When demand outweighs supply over a period of time prices swing higher and when supply outweighs demand over a period of time prices swing lower. These swing highs and swing lows can form patterns that offer insight into the prevailing supply and demand dynamics at play at the relevant moment in time.
‘Let us assume… that you the reader, are not a member of that mysterious inner circle known to the boardrooms as “the insiders”… But it is fairly certain that there are not nearly so many “insiders” as amateur trader supposes and… It is even more certain that insiders can be wrong… Any success they have, however, can be accomplished only by buying and selling… hey can do neither without altering the delicate poise of supply and demand that governs prices. Whatever they do is sooner or later reflected on the charts where you… can detect it. Or detect, at least, the way in which the supply-demand equation is being affected… So, you do not need to be an insider to ride with them frequently… prices move in trends. Some of those trends are straight, some are curved; some are brief and some are long and continued… produced in a series of action and reaction waves of great uniformity. Sooner or later, these trends change direction; they may reverse (as from up to down), or they may be interrupted by some sort of sideways movement and then, after a time, proceed again in their former direction… when a price trend is in the process of reversal… a characteristic area or pattern takes shape on the chart, which becomes recognisable as a reversal formation… Needless to say, the first and most important task of the technical chart analyst is to learn to know the important reversal formations and to judge what they may signify in terms of trading opportunities’ (Edwards & Magee, 1948).
This is as true today as it was when Edwards and Magee were writing in the first half of the last Century, study your patterns and make judgements for yourself about what their implications truly are on the markets and timeframes you are interested in trading.
Over the years, traders have come to discover a multitude of chart and candlestick patterns that are supposed to pertain information on future price movements. However, it is never so clear cut in practice and patterns that where once considered to be reversal patterns are now considered to be continuation patterns and vice versa. Bullish patterns can have bearish implications and bearish patterns can have bullish implications. As such, I would highly encourage you to do your own backtesting.
There is no denying that chart patterns exist, but their implications will vary from market to market and timeframe to timeframe. So it is down to you as an individual to study them and make decisions about how they may be used in a strategic sense.
Harmonic Patterns
The concept of harmonic patterns in trading was first introduced by H.M. Gartley in his book "Profits in the Stock Market", published in 1935. Gartley observed that markets have a tendency to move in repetitive patterns, and he identified several specific patterns that he believed could be used to predict future price movements. The bullish and bearish Gartley patterns are the oldest recognized harmonic patterns in trading and all the other harmonic patterns are modifications of the original Gartley patterns. Gartley patterns are fundamentally composed of 5 points, or 4 waves.
Since then, many other traders and analysts have built upon Gartley's work and developed their own variations of harmonic patterns. One such contributor is Larry Pesavento, who developed his own methods for measuring harmonic patterns using Fibonacci ratios. Pesavento has written several books on the subject of harmonic patterns and Fibonacci ratios in trading. Another notable contributor to harmonic patterns is Scott Carney, who developed his own approach to harmonic trading in the late 1990s and also popularised the use of Fibonacci ratios to measure harmonic patterns. Carney expanded on Gartley's work and also introduced several new harmonic patterns, such as the Shark pattern and the 5-0 pattern.
█ INPUTS
• Change pattern and label colours
• Show or hide patterns individually
• Adjust pattern tolerances
• Set or remove alerts for individual patterns
█ NOTES
You can test the patterns with your own strategies manually by applying the indicator to your chart while in bar replay mode and playing through the history. You could also automate this process with PineScript by using the conditions from my swing and pattern libraries as entry conditions in the strategy tester or your own custom made strategy screener.
█ LIMITATIONS
All green and red candle calculations are based on differences between open and close prices, as such I have made no attempt to account for green candles that gap lower and close below the close price of the preceding candle, or red candles that gap higher and close above the close price of the preceding candle. This may cause some unexpected behaviour on some markets and timeframes. I can only recommend using 24-hour markets, if and where possible, as there are far fewer gaps and, generally, more data to work with.
█ SOURCES
Edwards, R., & Magee, J. (1948) Technical Analysis of Stock Trends (10th edn). Reprint, Boca Raton, Florida: Taylor and Francis Group, CRC Press: 2013.

Multiple Instrument Automation ScreenerI have developed a Pine Script indicator on TradingView designed to demonstrate how to automate execution for ten instruments. This example utilizes a straightforward, Simple Moving Average (SMA) indicator. You can use it as a template, but use your indicator.
The indicator computes long/short signals based on the crossing of the SMA using the security function
It acts as a screener, presenting calculation results in an organized table format.
Utilizing the varip variable, the indicator sends alerts for multiple instruments sequentially rather than simultaneously.
For every generated signal, the indicator builds and sends a JSON execution command to a third-party tool, ensuring seamless integration and automation. You can use your own format.
Sent alerts look like this:
{"ticker": "DOGEBTC","action": "buy","price": "0.00000199","time": "1719754620658"}
Details and Limitations
Instrument Limit: The example is configured for ten instruments for simplicity. However, it can be expanded to handle up to 40 instruments.
Alert Rate Limit: There is a rate limit of 15 alerts in 3 minutes. Exceeding this limit may cause some alerts to be stopped. This can be managed by tracking the alert times and delaying some alerts, though this may affect the entry prices.
Timing of Signal Generation : The indicator processes signals at the bar close to the active instrument. Due to its computational complexity, there is a slight delay in collecting all records, potentially causing signals to reflect a few seconds before the bar closes. Care should be taken when executing based on these signals.
Disclaimer
Please remember that past performance may not be indicative of future results.
Due to various factors, including changing market conditions, the strategy may no longer perform as well as in historical backtesting.
This post and the script don’t provide any financial advice.

Multiple Indicators Screener v2After taking the approval of Mr. QuantNomad
Multiple Indicators Screener by QuantNomad
New lists have been modified and added
Built-in indicators:
RSI (Relative Strength Index): Provides trading opportunities based on overbought or oversold market conditions.
MFI (Cash Flow Index): Measures the flow of cash into or from assets, which helps in identifying buying and selling areas.
Williams Percent Range (WPR): Measures how high or low the price has been in the last time period, giving signals of periods of saturation.
Supertrend: Used to determine market direction and potential entry and exit locations.
Volume Change Percentage: Provides an analysis of the volume change percentage, which helps in identifying demand and supply changes for assets.
How to use:
Users can choose which symbols they want to monitor and analyze using a variety of built-in indicators.
The indicator provides visual signals that help traders identify potential trading opportunities based on the selected settings.
RSI in purple = buy weak liquidity (safe entry).
MFI in yellow = Liquidity
WPR in blue = RSI, MFI and WPR in oversold areas for all.
Allows users to customize the display locations and appearance of the cursor to their personal preferences.
Disclaimer
Please remember that past performance may not be indicative of future results.
Due to various factors, including changing market conditions, the strategy may no longer perform as well as in historical backtesting.
This post and the script don’t provide any financial advice.
=========================================================================
فاحص لمؤشرات متعددة مع مخرجات جدول شاملة لتسهيل مراقبة الكثير من العملات تصل الى 99 في وقت واحد
بختصر الشرح
ظهور اللون البنفسجي يعني كمية الشراء ضعف السيولة .
ظهور اللون الازرق جميع المؤشرات وصلة الى مرحلة التشبع البيعي ( دخول آمن )
ظهور اللون الاصفر يعني السيولة ضعفين الشراء ( عكس اتجاه قريب ) == ركزو على هاللون خصوصا مع عملات الخفيفة

Buffett IndicatorThis is an open-source version of the Buffett indicator. The old version was code-protected and broken, so I created another version.
It's computed simply as the entire SPX 500 capitalization divided by the US GDP. Since TradingView does not have data for the SPX 500 capitalization, I used quarterly values of SPX devisors as a proxy.
I tried to create another version of the Buffett indicator for other countries/indexes, but I can't find the data. If you can help me find data for index divisors, I can add more choices to this indicator.
It's interesting to see how this indicator's behavior has changed in the last few years. Levels that looked crazy are not so crazy anymore.
Disclaimer
Please remember that past performance may not be indicative of future results.
Due to various factors, including changing market conditions, the strategy may no longer perform as well as in historical backtesting.
This post and the script don’t provide any financial advice.

Wavelet & Fourier Smoothed Volume zone oscillator (W&)FSVZO Indicator id:
USER;e7a774913c1242c3b1354334a8ea0f3c
(only relevant to those that use API requests)
MEANINGFUL DESCRIPTION:
The Volume Zone oscillator breaks up volume activity into positive and negative categories. It is positive when the current closing price is greater than the prior closing price and negative when it's lower than the prior closing price. The resulting curve plots through relative percentage levels that yield a series of buy and sell signals, depending on level and indicator direction.
The Wavelet & Fourier Smoothed Volume Zone Oscillator (W&)FSVZO is a refined version of the Volume Zone Oscillator, enhanced by the implementation of the Discrete Fourier Transform. Its primary function is to streamline price data and diminish market noise, thus offering a clearer and more precise reflection of price trends.
By combining the Wavalet and Fourier aproximation with Ehler's white noise histogram, users gain a comprehensive perspective on volume-related market conditions.
HOW TO USE THE INDICATOR:
The default period is 2 but can be adjusted after backtesting. (I suggest 5 VZO length and NoiceR max length 8 as-well)
The VZO points to a positive trend when it is rising above the 0% level, and a negative trend when it is falling below the 0% level. 0% level can be adjusted in setting by adjusting VzoDifference. Oscillations rising below 0% level or falling above 0% level result in natural trend.
ORIGINALITY & USFULLNESS:
Personal combination of Fourier and Wavalet aproximation of a price which results in less noise Volume Zone Oscillator.
The Wavelet Transform is a powerful mathematical tool for signal analysis, particularly effective in analyzing signals with varying frequency or non-stationary characteristics. It dissects a signal into wavelets, small waves with varying frequency and limited duration, providing a multi-resolution analysis. This approach captures both frequency and location information, making it especially useful for detecting changes or anomalies in complex signals.
The Discrete Fourier Transform (DFT) is a mathematical technique that transforms discrete data from the time domain into its corresponding representation in the frequency domain. This process involves breaking down a signal into its individual frequency components, thereby exposing the amplitude and phase characteristics inherent in each frequency element.
This indicator utilizes the concept of Ehler's Universal Oscillator and displays a histogram, offering critical insights into the prevailing levels of market noise. The Ehler's Universal Oscillator is grounded in a statistical model that captures the erratic and unpredictable nature of market movements. Through the application of this principle, the histogram aids traders in pinpointing times when market volatility is either rising or subsiding.
DETAILED DESCRIPTION:
My detailed description of the indicator and use cases which I find very valuable.
What is oscillator?
Oscillators are chart indicators that can assist a trader in determining overbought or oversold conditions in ranging (non-trending) markets.
What is volume zone oscillator?
Price Zone Oscillator measures if the most recent closing price is above or below the preceding closing price.
Volume Zone Oscillator is Volume multiplied by the 1 or -1 depending on the difference of the preceding 2 close prices and smoothed with Exponential moving Average.
What does this mean?
If the VZO is above 0 and VZO is rising. We have a bullish trend. Most likely.
If the VZO is below 0 and VZO is falling. We have a bearish trend. Most likely.
Rising means that VZO on close is higher than the previous day.
Falling means that VZO on close is lower than the previous day.
What if VZO is falling above 0 line?
It means we have a high probability of a bearish trend.
Thus the indicator returns 0 when falling above 0 (or rising bellow 0) and we combine higher and lower timeframes to gauge the trend.
In the next Image you can see that trend is positive on 4h, neutral on 12h and positive on 1D. That means trend is positive.
I am sorry, the chart is a bit messy. The idea is to use the indicator over more than 1 Timeframe.
What is approximation and smoothing?
They are mathematical concepts for making a discrete set of numbers a
continuous curved line.
Fourier and Wavelet approximation of a close price are taken from aprox library.
Key Features:
You can tailor the indicator to your preferences with adjustable parameters such as VZO length, noise reduction settings, and smoothing length.
Volume Zone Oscillator (VZO) shows market sentiment with the VZO, enhanced with Exponential Moving Average (EMA) smoothing for clearer trend identification.
Noise Reduction leverages Euler's White noise capabilities for effective noise reduction in the VZO, providing a cleaner and more accurate representation of market dynamics.
Choose between the traditional Fast Fourier Transform (FFT), the innovative Double Discrete Fourier Transform (DTF32) and Wavelet soothed Fourier soothed price series to suit your analytical needs.
Image of Wavelet transform with FAST settings, Double Fourier transform with FAST settings. Improved noice reduction with SLOW settings, and standard FSVZO with SLOW settings:
Fast setting are setting by default:
VZO length = 2
NoiceR max Length = 2
Slow settings are:
VZO length = 5 or 7
NoiceR max Length = 8
As you can see fast setting are more volatile. I suggest averaging fast setting on 4h 12h 1d 2d 3d 4d W and M Timeframe to get a clear view on market trend.
What if I want long only when VZO is rising and above 15 not 0?
You have set Setting VzoDifference to 15. That reduces the number of trend changes.
Example of W&FSVZO with VzoDifference 15 than 0:
VZO crossed 0 line but not 15 line and that's why Indicator returns 0 in one case an 1 in another.
What is Smooth length setting?
A way of calculating Bullish or Bearish FSVZO.
If smooth length is 2 the trend is rising if:
rising = VZO > ta.ema(VZO, 2)
Meaning that we check if VZO is higher that exponential average of the last 2 elements.
If smooth length is 1 the trend is rising if:
rising = VZO_ > VZO_
Rising is boolean value, meaning TRUE if rising and FALSE if falling.
Mathematical equations presented in Pinescript:
Fourier of the real (x axis) discrete:
x_0 = array.get(x, 0) + array.get(x, 1) + array.get(x, 2)
x_1 = array.get(x, 0) + array.get(x, 1) * math.cos( -2 * math.pi * _dir / 3 ) - array.get(y, 1) * math.sin( -2 * math.pi * _dir / 3 ) + array.get(x, 2) * math.cos( -4 * math.pi * _dir / 3 ) - array.get(y, 2) * math.sin( -4 * math.pi * _dir / 3 )
x_2 = array.get(x, 0) + array.get(x, 1) * math.cos( -4 * math.pi * _dir / 3 ) - array.get(y, 1) * math.sin( -4 * math.pi * _dir / 3 ) + array.get(x, 2) * math.cos( -8 * math.pi * _dir / 3 ) - array.get(y, 2) * math.sin( -8 * math.pi * _dir / 3 )
Euler's Noice reduction with both close and Discrete Furrier approximated price.
w = (dft1*src - dft1 *src ) / math.sqrt(math.pow(math.abs(src- src ),2) + math.pow(math.abs(dft1 - dft1 ),2))
filt := na(filt ) ? 0 : c1 * (w*dft1 + nz(w *dft1 )) / 2.0 /math.abs(dft1 -dft1 ) + c2 * nz(filt ) - c3 * nz(filt )
Usecase:
First option:
Select the preferred version of DFT and noise reduction settings based on your analysis requirements.
Leverage the script to identify Bullish and Bearish trends, shown with green and red triangle.
Combine Different Timeframes to accurately determine market trend.
Second option:
Pull the data with API sockets to automate your trading journey.
plot(close, title="ClosePrice", display=display.status_line)
plot(open, title="OpenPrice", display=display.status_line)
plot(greencon ? 1 : redcon ? -1 : 0, title="position", display=display.status_line)
Use ClosePrice, OpenPrice and "position" titles to easily read and backtest your strategy utilising more than 1 Time Frame.
Indicator id:
USER;e7a774913c1242c3b1354334a8ea0f3c
(only relevant to those that use API requests)

Backtester UtilityLook ahead bias is the most evil bias responsible for overestimation of the performance of the trading system.
As the Bar replay feature is only available to paid users which is a great tool for manual testing of the trading system. Leaving other users prone to the evil of Look ahead bias.
So that I have developed this indicator which will help users to manually backtest the strategies.
This indicator hides the price action after specified date and time.
Here are the steps for using the indicator.
1) Hide your chart manually.
2) Plot the indicator.
3) Change the input of time and date after which you want to hide price action.
4) Change the script according to your trading strategy.
5) Enjoy the free of cost manual backtesting.
Good trading buddies !
Note : This post is only for educational purpose , it does not contain any financial advise.
Price Legs: Average Heights; 'Smart ATR'Price Legs: Average Heights; 'Smart ATR'. Consol Range Gauge
~~ Indicator to show small and large price legs (based on short and long input pivot lengths), and calculating the average heights of these price legs; counting legs from user-input start time ~~
//Premise: Wanted to use this as something like a 'Smart ATR': where the average/typical range of a distinct & dynamic price leg could be calculated based on a user-input time interval (as opposed to standard ATR, which is simply the average range over a consistent repeating period, with no regard to market structure). My instinct is that this would be most useful for consolidated periods & range trading: giving the trader an idea of what the typical size of a price leg might be in the current market state (hence in the title, Consol Range gauge)
//Features & User inputs:
-Start time: confirm input when loading indicator by clicking on the chart. Then drag the vertical line to change start time easily.
-Large Legs (toggle on/off) and user-input pivot lookback/lookforward length (larger => larger legs)
-Small Legs (toggle on/off) and user-input pivot lookback/lookforward length (smaller => smaller legs)
-Display Stats table: toggle on/off: simple view- shows the averages of large (up & down), small (up & down), and combined (for each).
-Extended stats table: toggle on/off option to show the averages of the last 3 legs of each category (up/down/large/small/combined)
-Toggle on/off Time & Price chart text labels of price legs (time in mins/hours/days; price in $ or pips; auto assigned based on asset)
-Table position: user choice.
//Notes & tips:
-Using custom start time along with replay mode, you can select any arbitrary chunk of price for the purpose of backtesting.
-Play around with the pivot lookback lengths to find price legs most suitable to the current market regime (consolidating/trending; high volatility/ low volatility)
-Single bar price legs will never be counted: they must be at least 2 bars from H>>L or L>>H.
//Credits: Thanks to @crypto_juju for the idea of applying statistics to this simple price leg indicator.
Simple View: showing only the full averages (counting from Start time):
View showing ONLY the large legs, with Time & Price labels toggled ON:

Supertrend - Optimised Exit We created a small script that will allow you to have a quick look into static SL/PT to choose from. This might save you time, replacing the manual search for optimal SL/PT.
We're checking signals of the strategy and computing its performance with a grid of SL/PT selected.
We used SuperTrend signals in this example, but it will be straightforward to integrate your signals.
In addition to total Return, we compute MAX Dd and Profit Factor. Other metrics can be implemented as well.
Thanks to @MUQWISHI for helping code it.
Disclaimer
Please remember that past performance may not indicate future results.
Due to various factors, including changing market conditions, the strategy may no longer perform as well as in historical backtesting.
This post and the script don’t provide any financial advice.

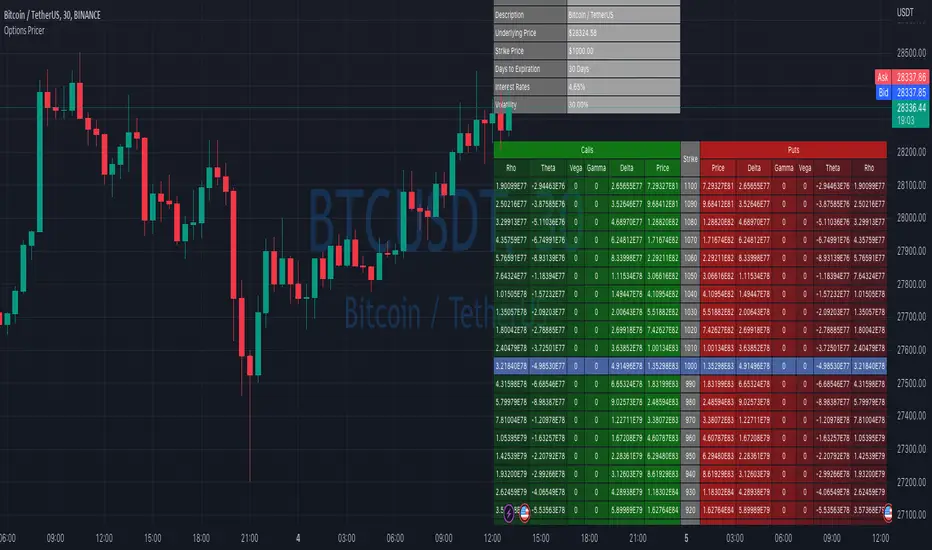
Options Price CalculatorIn the team, we continue to explore and expand the boundaries of TradingView.
For now, there is not much an options trader can do with options in TradingView.
We wanted to change that and created a simple option pricer.
You can set up in parameters a set of strikes, implied volatility, and days to expiry.
The indicators will take a risk-free rate from US01Y and the underlying price from your current chart.
It will compute prices and greeks for both put and call options.
Thanks to @MUQWISHI for helping code it.
Disclaimer
Please remember that past performance may not indicate future results.
Due to various factors, including changing market conditions, the strategy may no longer perform as well as in historical backtesting.
This post and the script don’t provide any financial advice.
Correlation AnalysisAs the name suggests, this indicator is a market correlation analysis tool.
It contains two main features:
- The Curve: represents the historic correlation coefficient between the current chart and the “Reference Market” input from the settings menu. It aims to give more depth to the current correlation values found in the second feature.
- The Screener: this second feature displays all correlation coefficient values between the (max) 20 markets inputs. You can use it to create several screeners for several market types (crypto, forex, metals, etc.) or even replicate your current portfolio of investments and gauge the correlation of its components.
Aside from these two previous features, you can visually plot the variation rate from one bar to another along with the covariance coefficient (both used in the correlation calculation). Finally, a simple “signal” moving average can be applied to the correlation coefficient .
I might add alerts to this script or even turn it into a strategy to do some backtesting. Do not hesitate to contact me or comment below if this is something you would be interested in or if you have any suggestions for improvement.
Enjoy!!

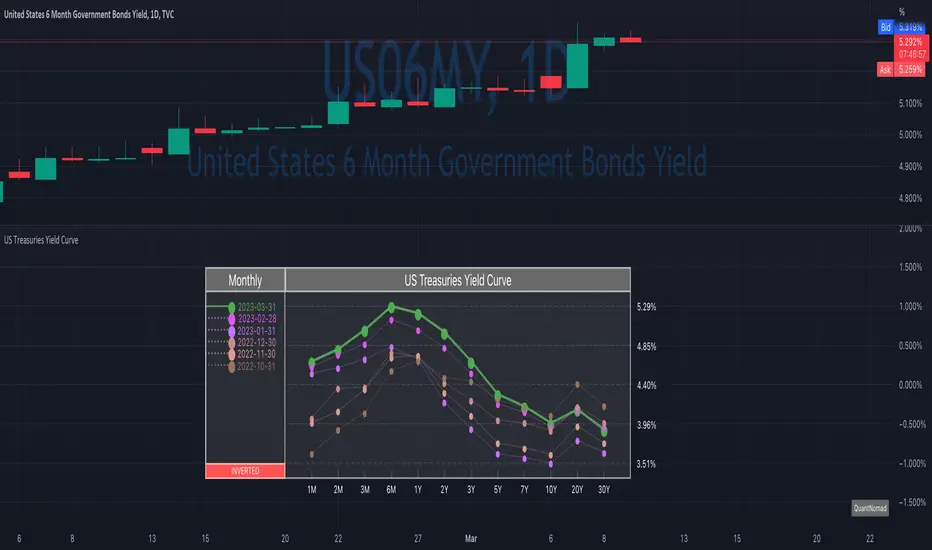
US Treasuries Yield CurveNews about the yield curve became pretty crucial for all the trades in the last year.
So in the team, we decided to implement a nice widget that will allow you to track the current yield curve in your chart directly.
It's possible to compare the current yield curve with past yield curves. You can choose to display the number of curves weeks, months, and years ago. So you can see the dynamics of the yield curve change.
When the Y2 > Y10 curve is considered invested, so you'll see an "Inverted" notification on the chart.
Thanks to @MUQWISHI for helping code it.
Disclaimer
Please remember that past performance may not indicate future results.
Due to various factors, including changing market conditions, the strategy may no longer perform as well as in historical backtesting.
This post and the script don’t provide any financial advice.
MFE & MAE ToolThis is a simple implementation of the MFE/MAE Tool for TradingView.
It's a quite powerful tool and pretty useful in systematic trading, but I don't see many trader using it these days.
It's created for EMA cross, but you can easily change it to use your own signals.
What is MAE/MFE Tool
MAE stands for Maximum Adverse Excursion - Worst P&L during the trade
MFE stands for Maximum Favorable Excursion - Best P&L during the trade
The idea is pretty simple. We take only signals without any position management or exits and measure the best/worst P&L for the next X bars after the signal was.
The primary use case for it is to understand how good your signals are .
If you'll add complicated money management tools, exits, and SL/PT to your strategy, it brings quite a lot of noise. After that, it's pretty tricky to understand if your signals bring much information about future price movements. In other words, bad money management can ruin good signals, and you might discard the entire strategy without knowing that. So this is why I think it's important to check the quality of your signals separately.
Another simple way to use it is to estimate where to put SL/PT
In this example, we're computing MAE/MFE in percent. We're plotting it both on the chart and computing some statistics based on it. This is why it's pretty easy to get a quick understanding of what is your SL/PT should be.
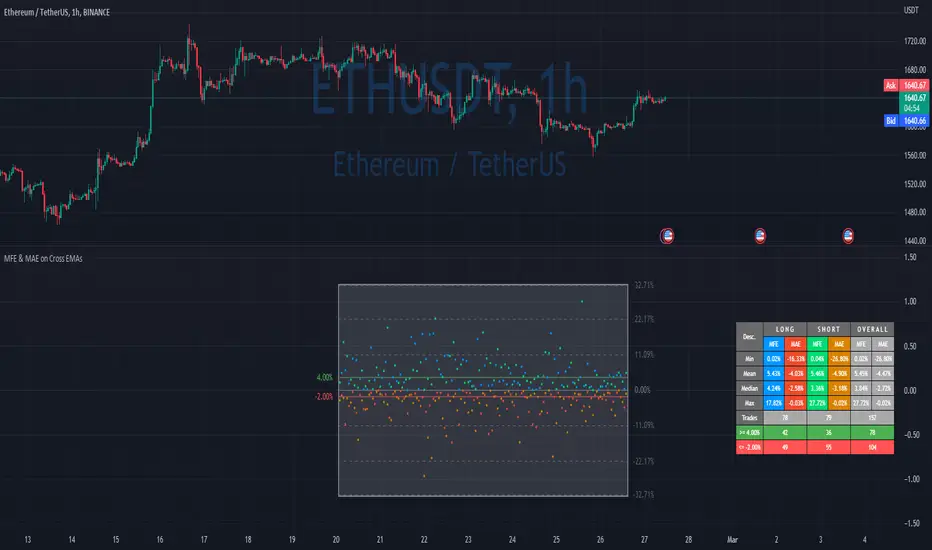
MAE/MFE tool consists of a:
Chart - it displays a point for every signal. Long/Short trades can have different colors. On hover you'll see details for this signal.
Table with stats - we're computing basic metrics for these Signals like average/min/median/max MAE/MFE, number of trades, and how many trades hit selected SL and PT. Stats are also separated by the side so you can see performance separately for longs and shorts.
The indicator is highly customizable, you can configure:
Bars you want to use to compute MAE/MFE
Side selection
SL and R:R
Styling of the chart
Position and style of the table
Parameters for the EMA
EMA cross and its parameter were selected randomly, so don't estimate to see a great performance here.
MFE/MAE tool is a pretty powerful concept. At some point, I'll create an entire article in my blog with more examples and descriptions.
Thanks to @MUQWISHI for helping code it.
Disclaimer
Please remember that past performance may not indicate future results.
Due to various factors, including changing market conditions, the strategy may no longer perform as well as in historical backtesting.
This post and the script don’t provide any financial advice.
smplondonclinic StrategyHello my friend! I'm uploading the code for your strategy. I have included a feature in the settings menu called "Entry Direction" that you can use to isolate only longs, only shorts or have both directions at the same time for the backtesting. I have set the strategy to only open 1 position at a time, it will not open a new position unless the previous position is closed. If you want to remove that just let me know. The green/red triangles that you will see plotting on the chart are the potential entry signals, you can turn them off from the style panel in the settings menu. In the inputs tab besides the strategy settings you also have all the relevant parameters for the three indicators used.

High/Low VolumeIn this indicator, I show you a better way to define high/low values of volume (or any other indicator).
Quite often, I get requests from my clients that an indicator level should be “high” or that it should be above a certain absolute level.
The first request is hard to interpret mathematically, but traders can easily spot it on the chart. The second one is not flexible, and it might not make sense in another market regime.
To solve that, you can compute dynamic high/low levels that represent unexpected extreme values that are adaptable to recent conditions.
There are two pretty simple methods I’m using quite often in my scripts percentiles and sigma (standard deviations).
Percentile looks back at X bars and computes the value under which a certain % of data points are located. So, for example, if we’re computing 90%tile and we’re looking at 100 bars, we’ll get a value under which we have values of precisely 90 bars for this indicator. It’s a good idea to use something like 5%tile for low level and 95%tile for high level.
Sigma(σ) is related to standard deviation. If we assume that our data is normally distributed, then 68% of data points should be in the range of mean +-1σ, 95% → mean +-2σ. So we can assume that something above 2σ is a pretty rare and extreme event.
In this script, I give you an example of how to compute both on volume, but you can easily change this to another indicator.
The issue with volume is that it’s not normally distributed, and your low level will be quite often too low to detect any low levels. Ideally, we have to use a more sophisticated formula that fits volume distribution better.
In this indicator, you can set the following parameters:
Choose type: Percentile or Sigma
Lookback Period
High/Low Percentiles
Sigmas #
You can also receive alerts for high/low volume events.
Disclaimer
Please remember that past performance may not indicate future results.
Due to various factors, including changing market conditions, the strategy may no longer perform as well as in historical backtesting.
This post and the script don’t provide any financial advice.
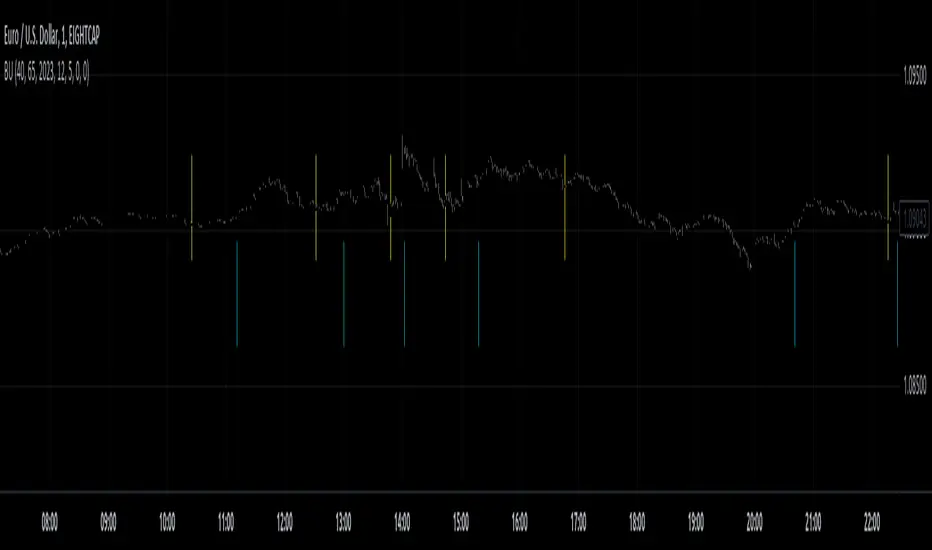
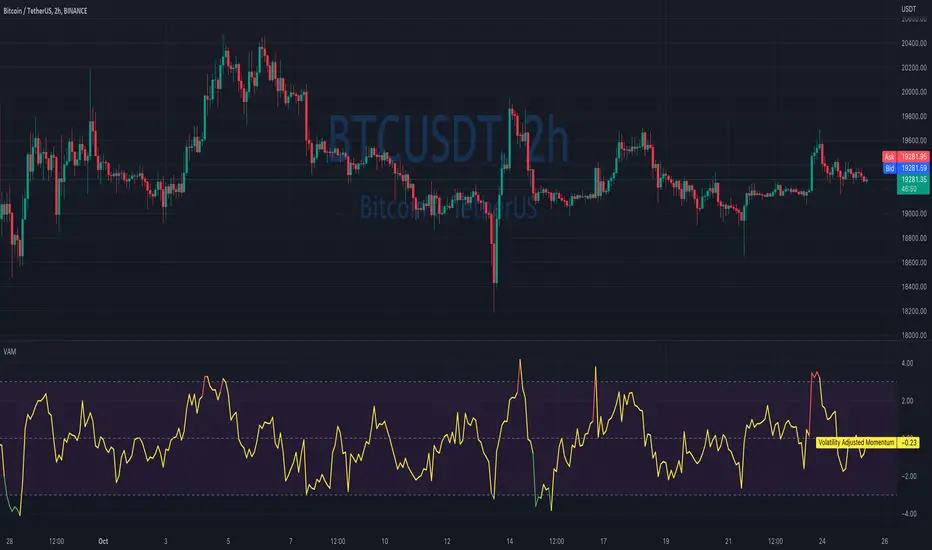
Volatility Adjusted MomentumIt's a script that computes volatility-adjusted momentum indicators.
The problem with the momentum indicator is that it's absolute and it's hard to interpret its value. For example, if you'll change the timeframe or instrument value of Momentum will be very different.
We tried to solve that by expressing momentum in volatility. This way you can easier spot overbought/oversold values.
You can choose to use Standard Deviation or ATR for adjustments.
Thanks to @MUQWISHI for helping me code it.
Disclaimer
Please remember that past performance may not be indicative of future results.
Due to various factors, including changing market conditions, the strategy may no longer perform as well as in historical backtesting.
This post and the script don’t provide any financial advice.
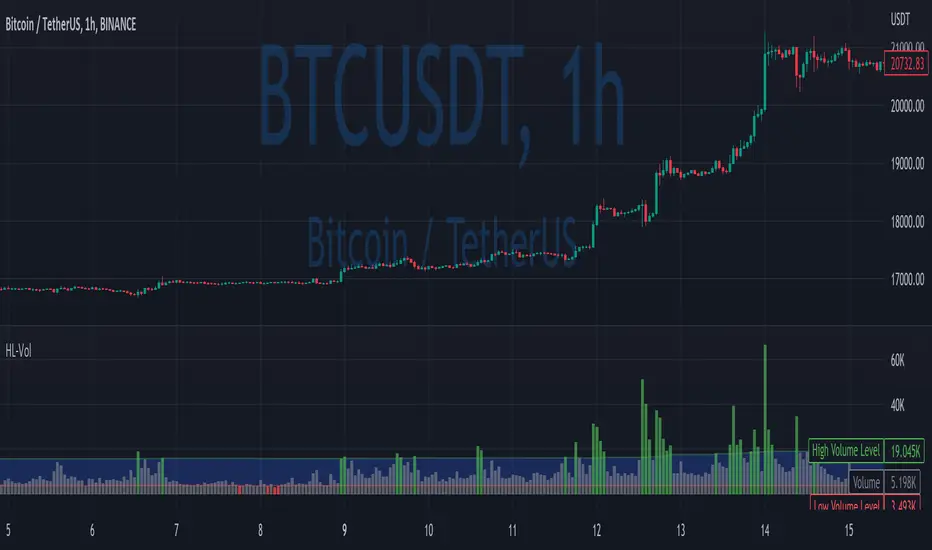
SuperTrend Multi Time Frame Long and Short Trading Strategy
Hello All
This is non-repainting Supertrend Multi Time Frame script, I got so many request on Supertrend with Multi Time Frame. This is for all of them ..I am making it open for all so you can change its coding according to your need.
How the Basic Indicator works
SuperTrend is one of the most common ATR based trailing stop indicators.
In this version you can change the ATR calculation method from the settings. Default method is RMA.
The indicator is easy to use and gives an accurate reading about an ongoing trend. It is constructed with two parameters, namely period and multiplier. The default values used while constructing a Supertrend indicator are 10 for average true range or trading period and three for its multiplier.
The average true range (ATR) plays an important role in 'Supertrend' as the indicator uses ATR to calculate its value. The ATR indicator signals the degree of price volatility .
The buy and sell signals are generated when the indicator starts plotting either on top of the closing price or below the closing price. A buy signal is generated when the ‘Supertrend’ closes above the price and a sell signal is generated when it closes below the closing price.
It also suggests that the trend is shifting from descending mode to ascending mode. Contrary to this, when a ‘Supertrend’ closes above the price, it generates a sell signal as the colour of the indicator changes into red.
A ‘Supertrend’ indicator can be used on spot, futures, options or forex, or even crypto markets and also on daily, weekly and hourly charts as well, but generally, it fails in a sideways-moving market.
How the Strategy works
This is developed based on SuperTrend.
Use two time frame for confirm all entry signals.
Two time frame SuperTrend works as Trailing stop for both long and short positions.
More securely execute orders, because it is wait until confine two time frames(example : daily and 30min)
Each time frame developed as customisable for user to any timeframe.
User can choose trading position side from Long, Short, and Both.
Custom Stop Loss level, user can enter Stop Loss percentage based on timeframe using.
Multiple Take Profit levels with customisable TP price percentage and position size.
Back-testing with custom time frame.
This strategy is develop for specially for automation purpose.
The strategy includes:
Entry for Long and Short.
Take Profit.
Stop Loss.
Trailing Stop Loss.
Position Size.
Exit Signal.
Risk Management Feature.
Backtesting.
Trading Alerts.
Use the strategy with alerts
This strategy is alert-ready. All you have to do is:
Go on a pair you would like to trade
Create an alert
Select the strategy as a Trigger
Wait for new orders to be sent to you
This is develop for specially for automating trading on any exchange, if you need to get that automating service for this strategy or any Tradingview strategy or indicator please contact me I am have 8 year experience on that field.
I hope you enjoy it!
Thanks,
Ranga
