TrendSync Pro (SMC)📊 TrendSync Pro (SMC) – Advanced Trend-Following Strategy with HTF Alignment
Created by Shubham Singh
🔍 Strategy Overview
TrendSync Pro (SMC) is a precision-based smart trend-following strategy inspired by Smart Money Concepts (SMC). It combines: Real-time pivot-based trendline detection
Higher Time Frame (HTF) filtering to align trades with dominant trend
Risk management via adjustable Stop Loss (SL) and Take Profit (TP)
Directional control — trade only bullish, bearish, or both setups
Realistic backtesting using commissions and slippage
Pre-optimized profiles for scalpers, intraday, swing, and long-term traders
🧠 How It Works:
🔧 Strategy Settings Image:
beeimg.com
The strategy dynamically identifies trend direction by using swing high/low pivots. When a new pivot forms: It draws a trendline from the last significant pivot
Detects whether the trend is up (based on pivot lows) or down (based on pivot highs)
Waits for price to break above/below the trendline
Confirms with HTF price direction (HTF close > previous HTF close = bullish)
Only then it triggers a long or short trade
It exits either at TP, SL, or a manual trendline break
🛠️ Adjustable Parameters:
Trend Period: Length for pivot detection (affects sensitivity of trendlines)
HTF Timeframe: Aligns lower timeframe entries with higher timeframe direction
SL% and TP%: Customize your risk-reward profile
Commission & Slippage: Make backtests more realistic
Trade Direction: Choose to trade: Long only, Short only, or Both
🎛️ Trade Direction Control:
In settings, you can choose: Bullish Only: Executes only long entries
Bearish Only: Executes only short entries
Both: Executes both long and short entries when conditions are met
This allows you to align trades with your own market bias or external analysis.
📈 Entry Logic: Long Entry:
• Price crosses above trendline
• HTF is bullish (HTF close > previous close)
• Latest pivot is a low (trend is considered up)
Short Entry:
• Price crosses below trendline
• HTF is bearish (HTF close < previous close)
• Latest pivot is a high (trend is considered down)
📉 Exit Logic: Hit Take Profit or Stop Loss
Manual trendline invalidation: If price crosses opposite of the trend direction
⏰ Best Timeframes & Recommended Settings:
Scalping (1m to 5m):
HTF = 15m | Trend Period = 7
SL = 0.5% | TP = 1% to 2%
Intraday (15m to 30m):
HTF = 1H | Trend Period = 10–14
SL = 0.75% | TP = 2% to 3%
6 Hour Trading (30m to 1H):
HTF = 4H | Trend Period = 20
SL = 1% | TP = 4% to 6%
Swing Trading (4H to 1D):
HTF = 1D | Trend Period = 35
SL = 2% | TP = 8% to 12%
Long-Term Investing (1D+):
HTF = 1W | Trend Period = 50
SL = 3% | TP = 15%+
Note: These are recommended base settings. Adjust based on volatility, asset class, or personal trading style.
📸 Testing Note:
beeimg.com
TradingView limits test length to 20k bars (~40 trades on smaller timeframes). To show long-term results: Test on higher timeframes (e.g., 1H, 4H, 1D)
Share images of backtest result in description
Host longer test result screenshots on Imgur or any public drive
📍 Asset Behavior Insight:
This strategy works on multiple assets, including BTC, ETH, etc.
Performance varies by trend strength:
Sometimes BTC performs better than ETH
Other times ETH gives better results
That’s normal as both assets follow different volatility and trend behavior
It’s a trend-following setup. Longer and clearer the trend → better the results.
✅ Best Practices: Avoid ranging markets
Use proper SL/TP for each timeframe
Use directional filter if you already have a directional bias
Always forward test before going live
⚠️ Trading Disclaimer:
This script is for educational and backtesting purposes only. Trading involves risk. Always use risk management and never invest more than you can afford to lose.
Wyszukaj w skryptach "backtest"

Multi-Timeframe MACD Strategy ver 1.0Multi-Timeframe MACD Strategy: Enhanced Trend Trading with Customizable Entry and Trailing Stop
This strategy utilizes the Moving Average Convergence Divergence (MACD) indicator across multiple timeframes to identify strong trends, generate precise entry and exit signals, and manage risk with an optional trailing stop loss. By combining the insights of both the current chart's timeframe and a user-defined higher timeframe, this strategy aims to improve trade accuracy, reduce exposure to false signals, and capture larger market moves.
Key Features:
Dual Timeframe Analysis: Calculates and analyzes the MACD on both the current chart's timeframe and a user-selected higher timeframe (e.g., Daily MACD on a 1-hour chart). This provides a broader market context, helping to confirm trends and filter out short-term noise.
Configurable MACD: Fine-tune the MACD calculation with adjustable Fast Length, Slow Length, and Signal Length parameters. Optimize the indicator's sensitivity to match your trading style and the volatility of the asset.
Flexible Entry Options: Choose between three distinct entry types:
Crossover: Enters trades when the MACD line crosses above (long) or below (short) the Signal line.
Zero Cross: Enters trades when the MACD line crosses above (long) or below (short) the zero line.
Both: Combines both Crossover and Zero Cross signals, providing more potential entry opportunities.
Independent Timeframe Control: Display and trade based on the current timeframe MACD, the higher timeframe MACD, or both. This allows you to focus on the information most relevant to your analysis.
Optional Trailing Stop Loss: Implements a configurable trailing stop loss to protect profits and limit potential losses. The trailing stop is adjusted dynamically as the price moves in your favor, based on a user-defined percentage.
No Repainting: Employs lookahead=barmerge.lookahead_off in the request.security() function to prevent data leakage and ensure accurate backtesting and real-time signals.
Clear Visual Signals (Optional): Includes optional plotting of the MACD and Signal lines for both timeframes, with distinct colors for easy visual identification. These plots are for visual confirmation and are not required for the strategy's logic.
Suitable for Various Trading Styles: Adaptable to swing trading, day trading, and trend-following strategies across diverse markets (stocks, forex, cryptocurrencies, etc.).
Fully Customizable: All parameters are adjustable, including timeframes, MACD Settings, Entry signal type and trailing stop settings.
How it Works:
MACD Calculation: The strategy calculates the MACD (using the standard formula) for both the current chart's timeframe and the specified higher timeframe.
Trend Identification: The relationship between the MACD line, Signal line, and zero line is used to determine the current trend for each timeframe.
Entry Signals: Buy/sell signals are generated based on the selected "Entry Type":
Crossover: A long signal is generated when the MACD line crosses above the Signal line, and both timeframes are in agreement (if both are enabled). A short signal is generated when the MACD line crosses below the Signal line, and both timeframes are in agreement.
Zero Cross: A long signal is generated when the MACD line crosses above the zero line, and both timeframes agree. A short signal is generated when the MACD line crosses below the zero line and both timeframes agree.
Both: Combines Crossover and Zero Cross signals.
Trailing Stop Loss (Optional): If enabled, a trailing stop loss is set at a specified percentage below (for long positions) or above (for short positions) the entry price. The stop-loss is automatically adjusted as the price moves favorably.
Exit Signals:
Without Trailing Stop: Positions are closed when the MACD signals reverse according to the selected "Entry Type" (e.g., a long position is closed when the MACD line crosses below the Signal line if using "Crossover" entries).
With Trailing Stop: Positions are closed if the price hits the trailing stop loss.
Backtesting and Optimization: The strategy automatically backtests on the chart's historical data, allowing you to assess its performance and optimize parameters for different assets and timeframes.
Example Use Cases:
Confirming Trend Strength: A trader on a 1-hour chart sees a bullish MACD crossover on the current timeframe. They check the MTF MACD strategy and see that the Daily MACD is also bullish, confirming the strength of the uptrend.
Filtering Noise: A trader using a 15-minute chart wants to avoid false signals from short-term volatility. They use the strategy with a 4-hour higher timeframe to filter out noise and only trade in the direction of the dominant trend.
Dynamic Risk Management: A trader enters a long position and enables the trailing stop loss. As the price rises, the trailing stop is automatically adjusted upwards, protecting profits. The trade is exited either when the MACD reverses or when the price hits the trailing stop.
Disclaimer:
The MACD is a lagging indicator and can produce false signals, especially in ranging markets. This strategy is for educational and informational purposes only and should not be considered financial advice. Backtest and optimize the strategy thoroughly, combine it with other technical analysis tools, and always implement sound risk management practices before using it with real capital. Past performance is not indicative of future results. Conduct your own due diligence and consider your risk tolerance before making any trading decisions.

Premium Signal Strategy [BRTLab]🔍 Overview
BRTLab Premium Signal Strategy is a comprehensive multi-indicator trading strategy based on the integration of key technical indicators such as ADX, RSX, CAND, V9, PP, MA, and LVL. The strategy allows users to flexibly adjust the parameters of each indicator to optimize for specific market conditions, making it effective for both trending markets and for identifying reversals and breakouts.
🌟 What makes this strategy unique is its seamless compatibility with the BRT Premium Signals tool, allowing traders not only to receive real-time signals but also to conduct robust backtests. This feature enables users to fine-tune the best parameter settings or even test out their own trading ideas through historical data analysis. The ability to backtest empowers traders to validate strategies before going live, significantly improving the chances of success by offering data-driven insights.
💡 Signal Logic:
ADX
The ADX-based signals reflect the strength of market trends. Bullish or bearish signals are generated when directional indicators (+DI or -DI) show increasing strength relative to one another, indicating the start or continuation of a strong trend.
RSX
These signals focus on divergences within RSI, identifying potential reversals by detecting either classic or hidden divergences when the market is overbought or oversold.
V9
Signals are generated when the price interacts with a dynamic threshold, indicating trend continuation or reversal. Additional filters can be applied to refine these signals further, enhancing the dashboard's overall effectiveness.
CAND
Candlestick-based signals are triggered by key patterns such as bullish or bearish engulfing formations. These signals are cross-checked with other conditions, such as RSI levels and candle stability, making them especially useful for short-term trading.
PP (Pivot Points)
Pivot Point signals reinforce candlestick patterns by aligning with key support or resistance levels, suggesting potential reversals or continuation opportunities at significant price points.
MA (Moving Average)
MA signals help identify trends by analyzing price action relative to a moving average. Optional filters like ADX add an additional layer of validation, ensuring only high-confidence signals are displayed on the dashboard.
LVL (Levels)
These signals are based on shifts in RSI and help traders spot potential breakouts or reversals. The dashboard integrates these signals alongside MA and ADX filters to enhance their accuracy.
📊 Risk Management
This strategy includes built-in risk management features to help minimize losses:
Initial Capital: The user can set the initial capital (default is 10000), adjusting the strategy to their financial goals.
Position Size: Set the position size (default is 1000), allowing better risk management and controlling potential losses.
Stop-Loss: Multiple stop-loss methods are available, including ATR-based, fixed percentage, or prior high/low levels.
Take-Profit: Users can configure take-profit settings (default is 1.3%) to lock in gains while managing risk effectively.
⚠️ RISK DISCLAIMER
Trading involves significant risks, and most day traders experience losses. All content, tools, scripts, and educational materials from BRTLab are provided for informational and educational purposes only. Past performance is not a guarantee of future results. Please ensure you use realistic backtesting settings, including proper account size, commission, and slippage, to reflect market conditions.
⚡ CONCLUSION
We believe that successful trading comes from using indicators as supportive tools rather than relying on them for guaranteed success. The BRTLab Premium Signal Strategy is designed to be a comprehensive, customizable toolset that helps traders understand and interpret technical indicators more effectively.
By leveraging the power of backtesting and indicator optimization, traders can make well-informed decisions and develop a deeper understanding of market dynamics. Use this strategy to build a trading framework that aligns with your personal goals and trading style.
Follow the author’s instructions below to access the BRTLab Premium suite and unlock the full potential of this strategy.

Ichimoku Breakout Kumo SWING TRADER (By Insert Cheese)A simple strategy for long spot or long futures (swing traders) based on a basic method of Ichimoku Kinko Hyo strategies.
The strategy is simple:
- Buy when the price breaks the cloud
- Close the trade when the price closes again inside the cloud.
The parameters that work best on this strategy are 10,30,60,30 and 1 for Senkou-Span A
but you can try classic Ichimoku parameters (9,26,52,26,26) or whatever you want like (7,22,44,22,22), (10,30,60,30,30) and others.
-1D chart
I have removed everything from the interface except the cloud to make it visually more aesthetic :D (but if you want to see all the ichimoku indicator you can put in again into the chart)
I have also added several functions for you to do your own backtesting:
- Date range
- TP AND SL method
- Includes long or short trades
The strategy starts with 500 $ and use 100% for trade to make the power of the compounding :P
Remember that this is for only educational porpouse and you must to do your own research and backtested on your usually market..
I hope you like it enjoy and support this indicator :)
Donate (BEP20) 0xC118f1ffB3ac40875C13B3823C182eA2Af344c6d

Ranged Volume DCA Strategy - R3c0nTraderUpdate: Republishing this as Public Open-Source script.
Credits:
Thank you "EvoCrypto" for granting me permission to use "Ranged Volume" to create this strategy.
Thank you "junyou0424" for granting me permission to use "DCA Bot with SuperTrend Emulator" which I used for adding bot inputs, calculations, and strategy
What does this do?
This script is mainly used for backtesting a Ranged Volume strategy to see how a 3Commas bot would perform.
I created this script out of necessity and I wanted a way to test a 3Commas DCA bot with a strategy based on “Volume.”
I came across "EvoCrypto’s" "Ranged Volume" study and strategy in TradingView and I liked it. I wanted to configure it so it can be used for DCA bot backtesting. I used parts from "junyou0424’s" "DCA Bot with SuperTrend Emulator" to add the following:
1. The Start Time and End Time
2. Price deviation to open safety orders (%)
3. Target Take Profit (%)
4. Trailing deviation
5. Base Order and Safety Order
6. Safety order volume scale
7. Safety order step scale
8. Max safety orders
In addition to the above, I also added chart indicators for "Take Profit" as well as "Safety Order"
Pre-requisites:
You can use this script without a 3Commas account and see how 3Commas DCA Bot and Ranged Volume strategy would perform vs. a non-DCA strategy. However, I highly recommend signing up for their free account and going through their training. This would give you a base understanding on the settings you will see in this strategy and why you will need to know them.
That said these are the pre-requisites I suggest you have:
1. Base Knowledge of 3Commas DCA bots
2. Base knowledge of settings such as “Max safety trades count”, “safety order volume scale” and “safety order step scale”. If these are alien to you, I suggest you read up on these.
3. Knowledge of setting up a Single-pair 3Commas bot for receiving custom TradingView signal.
4. A paper-bot to test your ideas. (Do not use a real money bot until you have tested it sufficiently with a paper-bot. You alone are responsible for your results!)
5. Add the study I created called "R3c0nTrader’s Ranged Volume Study” which adds a separate chart in its own pane showing the volume spikes. It will also generate the “buy” signals for your bot. NOTE: The study also has the same color scheme as this strategy and having the colors in both the strategy and the study will make things easier to see. If you use EvoCrypto’s Ranged Volume Study instead, just keep in mind that the colors won’t match, and you will have to manually match them.
6. Make your buy signals from your strategy are the same as in your study! To do this, use the same “Volume Range Length” you entered in the STRATEGY and enter that value for the “Volume Range Length” in the STUDY. Also ensure you have the same settings for “Heikin Ashi” (On or Off).
Comparisons of Ranged Volume Strategy vs Ranged Volume DCA Strategy
BTCUSD
Beware of Strategies that claim super high profits. This can easily be done by lowering the initial capital to something unrealistic. If I did that with this strategy and set the initial capital $100 and base order size to $100, I get a net profit of 2,864% which is not realistic.
How to Use
1. On the “Inputs” tab:
a. Set your Start and End Time to backtest against.
b. Set your “Volume Range Length” (number of bars to look back)
c. “Heikin Ashi Colors” – Usually I leave this enabled
d. “Show Bar Colors” – Leave enabled
e. “Show Break-Out” – Leave enabled
f. “Show Range” – Leave enabled
g. Set your other inputs which are those settings you would find in your 3Commas bot that you want to test (e.g., Price deviation to open safety orders, Target Take Profit, Base order, Safety order, etc.).
h. Quick Example for BTCUSD on 2hr chart:
i. Price deviation to open safety orders (%) = 6
ii. Target Take Profit (%) = 14
iii. Trailing deviation = 0
iv. Base order = 100
v. Safety order = 200
vi. Safety order volume scale = 2
vii. Safety order step scale = 1.4
viii. Max safety order = 5
2. On the “Properties” tab, set your initial capital, base currency, etc.
a. Initial capital – Default is 10,000 (Please use realistic values here. The amount here should be able to cover ALL your safety orders if they were triggered. Ideally, you should have funds left over and not use all trade capital.)
b. Base currency – Select your currency
c. Order Size - Not used. Use the “Inputs” tab to change your base order size.
d. Leave “Pyramiding” set to 999. This acts as a ceiling to the “Max safety orders” on the “Inputs” tab. It must always be higher than your “Max safety orders.” For example, if you set your “Max safety orders” to “4” and “Pyramiding” to “4” then it effectively means you have “3” “Max safety orders” and not “4” because it is counting each successive entry including the initial order.
e. “Commission” - Optional
f. “Verify price for limit orders” – Leave at zero. This does not change anything that I can tell.
g. Optional - Enter a value for “Commission”
h. Slippage – Optional. Slippage does not occur in backtesting but does occur in real trading but it can be simulated. Example use case for tracking performance of a real money bot: You enter the start date and time of your bot’s trade into this strategy and you notice some values are a little off due to slippage (average price, take profit, safety orders are not lining up) then you would go back here and increase the slippage until those lines up close enough with your actuals.
i. Margin for long positions – I don’t use this honestly.
j. Margin for short positions – I don’t use this honestly.
k. Recalculate “After order is filled” and “On every tick” – I don’t use this honestly.
3. “Style” tab
a. Ranged Volume Bar Coloring - You must disable bar coloring in any studies you added or this may not work properly
i. Color 0 – Default Yellow; appears when a volume breakout occurs
ii. Color 1 – Default Red; appears when a volume breakdown occurs
iii. Color 2 – Light Blue; appears when Close is higher than the Open
iv. Color 3 – Dark Blue; appears when the Close is lower than the Open
b. Take profit – Default Green; take profit line
c. Safety order – Default Light Blue; safety order line
d. No Safety Orders left – Default Red; when a trade runs out of safety orders, the line turns red and there is no safety orders left underneath to catch any further falling price movements.
e. Avg Position Price – Default Orange; your average position price for any given trade.
f. Take Profit Plot Area – Default Green; creates a highlighted area for your take profit
g. SO Plot Area – Default Light Blue; creates a highlighted area for your safety orders
h. Trades on chart – Show or hide your trades on the chart
i. Signal labels – Show or hide the trade signal labels on the chart
j. Quantity – Show or hide the trade quantity on the chart
Explanation of Chart lines and colors on chart

Ichimoku Cloud Strategy Long Only [Bitduke]Slightly modificated and optimized for Pine Script 4.0, Ichimoku Cloud Strategy which, suddenly, good suitable for the several crypto assets.
Details:
Enter position when conversion line crosses base line up, and close it when the opposite happens.
Additional condition for open / close the trade is lagging span, it should be higher than cloud to open position and below - to close it.
Backtesting:
Backtested on SOLUSDT ( FTX, Binance )
+150% for 2021 year, 8% dd
+191% for all time, 32% dd
Disadvantages:
- Small number of trades
- Need to vary parameters for different coins (not very robust)
Should be tested carefully for other coins / stock market. Different parameters could be needed or even algo modifications.
Strategy doesn't repaint.

TradingView Alerts to MT4 MT5 - Forex, indices, commoditiesHowdy Algo-Traders! This example script has been created for educational purposes - to present how to use and automatically execute TradingView Alerts on real markets.
I'm posting this script today for a reason. TradingView has just released a new feature of the PineScript language - ALERT() function. Why is it important? It is finally possible to set alerts inside PineScript strategy-type script, without the need to convert the script into study-type. You may say triggering alerts straight from strategies was possible in PineScript before (since June 2020), but it had its limitations. Starting today you can attach alert to any custom event you might want to include in your PineScript code.
With the new feature, it is easier not only to execute strategies, but to maintain codebase - having to update 2 versions of the code with each single modification was... ahem... inconvenient. Moreover, the need to convert strategy into study also meant it was required to rip the code from all strategy...() calls, which carried a lot of useful information, like entry price, position size, and more, definitely influencing results calculated by strategy backtest. So the strategy without these features very likely produced different results than with them. While it was possible to convert these features into study with some advanced "coding gymnastics", it was also quite difficult to test whether those gymnastics didn't introduce serious, bankrupting bugs.
//////
How does this new feature work? It is really simple. On your custom events in the code like "GoLong" or "GoShort", create a string variable containing all the values you need inside your alert and this string variable will be your alert's message. Then, invoke brand new alert() function and that's it (see lines 67 onwards in the script). Set it up in CreateAlert popup and enjoy. Alerts will trigger on candle close as freq= parameter specifies. Detailed specification of the new alert() function can be found in TradingView's PineScript Reference (www.tradingview.com), but there's nothing more than message= and freq= parameters. Nothing else is needed, it is very simple. Yet powerful :)
//////
Alert syntax in this script is prepared to work with TradingConnector. Strategy here is not too complex, but also not the most basic one: it includes full exits, partial exits, stop-losses and it also utilizes dynamic variables calculated by the code (such as stop-loss price). This is only an example use case, because you could handle variety of other functionalities as well: conditional entries, pending entries, pyramiding, hedging, moving stop-loss to break-even, delivering alerts to multiple brokers and more.
//////
This script is a spin-off from my previous work, posted over a year ago here: Some comments on strategy parameters have been discussed there, but let me copy-paste most important points:
* Commission is taken into consideration.
* Slippage is intentionally left at 0. Due to shorter than 1 second delivery time of TradingConnector, slippage is practically non-existing.
* This strategy is NON-REPAINTING and uses NO TRAILING-STOP or any other feature known to be causing problems.
* The strategy was backtested on EURUSD 6h timeframe, will perform differently on other markets and timeframes.
Despite the fact this strategy seems to be still profitable, it is not guaranteed it will continue to perform well in the future. Remember the no.1 rule of backtesting - no matter how profitable and good looking a script is, it only tells about the past. There is zero guarantee the same strategy will get similar results in the future.
Full specs of TradingView alerts and how to set them up can be found here: www.tradingview.com

Gap Trading Strategy: CME BitcoinI created a strategy which finds gaps on CME Futures market for Bitcoin, BTC1! and opens a long or short position on the crypto exchange depending on what kind of gap was found (up or down) on CME.
Up gap: today open price > previous day high price
Down gap: today open price < previous day low price
Two lines below the main chart show when gaps appear. The green line represents the size of up gaps, when it crosses zero it gives a long signal. The red line - represents the size of down gaps, when it crosses zero - short signal.
Instead of having to look between multiple charts, this simply overlays the past weeks open and close should a gap appear.
Usage:
Strategy flips long / short depending of indicator signals. It could cut the position by stop loss or take profit.
Features:
ability to set stop loss and take profit in %
ability to set delta for gaps (if you want to filter small ones)
ability to choose strategy type. Standart: Long Up/Short Down || Inverse: Short Up/Long Down.
Backtesting:
Backtested on BTCPERP ( FTX ) and XBTUSD (Bitmex).
It shows a low drawdown, a small number of trades and 50% of profit for the 2020.
For example, I set high delta for down gaps to filter small ones
Strategy doesn't repaint.

KDH v2.0 (English) Trading Strategy Indicator# KDH Diamond Strategy v3.3 - TradingView Description
---
## 🇬🇧 ENGLISH VERSION
### 📊 KDH Diamond Strategy v3.3
**Professional High-Leverage Futures Trading System**
---
#### 🎯 Overview
KDH Diamond is an advanced algorithmic trading strategy specifically optimized for **1-hour timeframe futures trading** with high-leverage environments. Built on proven institutional concepts including Fair Value Gaps (FVG), Volume Profile analysis, and multi-layered confirmation filters, this strategy delivers consistent results without repainting.
---
#### ✨ Key Features
**🔥 Optimized for 1H Timeframe**
- Extensively backtested across multiple markets
- Highest profit rate achieved on 1-hour charts
- Perfect for swing traders and active position management
**🎨 No Repainting - 100% Reliable Signals**
- All signals are confirmed and locked on bar close
- What you see in backtest is what you get in real-time
- Complete transparency with `calc_on_order_fills=true`
**💎 Automated Risk Management**
- Automatic Stop Loss and Take Profit calculation
- Intelligent SL/TP placement based on market structure
- Built-in position sizing controls (adjustable % per trade)
**🚀 High-Leverage Futures Optimized**
- Designed specifically for leveraged futures trading
- Risk-reward ratios calibrated for 10-20x leverage environments
- Precision entry timing to maximize profit potential
**🔄 Advanced Position Management**
- Automatic reversal entries at TP levels
- Multiple re-entry opportunities per signal
- Dynamic trade management based on market conditions
**🎛️ Multi-Layer Confirmation System**
- **SMA50 Filter (1H)**: Trend alignment confirmation
- **Momentum Filter**: KAMA-based directional strength
- **RSI Divergence Filter**: Reversal detection at extremes
- **Volume Profile Filter**: Order flow and liquidity analysis
---
#### 📈 How It Works
**Signal Generation**
The strategy identifies **Inverted Fair Value Gaps (IFVG)** - institutional order blocks that signal high-probability reversal or continuation zones. Each signal is validated through multiple confirmation filters before execution.
**Entry Logic**
- Limit orders placed at optimal price levels within FVG zones
- Price must touch the midline and close in favorable direction
- All filters must align for signal activation
**Exit Strategy**
- Stop Loss: Placed at the next opposing FVG level
- Take Profit: Calculated using nearest FVG in profit direction
- Automatic reversal entry option at TP levels
**Visual System**
- Color-coded boxes show FVG zones (green/red)
- Real-time position tracking with entry, SL, and TP lines
- Comprehensive dashboard displaying filter status and P&L
---
#### 🎯 Who Is This For?
✅ **Perfect For:**
- Futures traders using 10-20x leverage
- Traders seeking systematic, rule-based strategies
- Those who want automated SL/TP management
- 1-hour chart swing traders
- Traders familiar with institutional concepts (FVG, order flow)
❌ **Not Ideal For:**
- Scalpers (designed for 1H timeframe)
- Spot-only traders (optimized for leveraged futures)
- Beginners unfamiliar with leverage risks
- Set-and-forget automated trading (requires monitoring)
---
#### 📊 What You Get
**Strategy Features:**
- Complete FVG detection and inversion system
- 4 professional-grade confirmation filters
- Automated SL/TP calculation and placement
- TP reversal entry system
- Volume Profile sentiment analysis
- Real-time position tracking dashboard
- Webhook alert support for automation
- Clean, organized code with detailed comments
**Visual Components:**
- FVG boxes with inversion coloring
- Volume Profile sentiment boxes (optional)
- Entry, SL, and TP lines for each position
- Position status table with live P&L
- Filter status dashboard
---
#### ⚙️ Customization Options
**Adjustable Filters (User Control):**
- SMA50 Filter (1H) - Trend alignment ON/OFF
- Momentum Filter - Directional strength ON/OFF
- RSI Divergence Filter - Reversal detection ON/OFF
- Volume Profile Filter - Order flow analysis ON/OFF
**Fixed Parameters (Optimized):**
- All core parameters are pre-optimized for 1H timeframe
- Ensures consistent performance without overwhelming options
- Prevents parameter over-fitting by users
---
#### ⚠️ Important Disclaimers
**Risk Warning:**
This strategy is designed for leveraged futures trading, which carries substantial risk. High leverage (10-20x) can result in rapid losses. Only trade with capital you can afford to lose.
**Performance:**
Past performance does not guarantee future results. Always backtest on your specific market and timeframe before live trading.
**Usage:**
This is a trading tool, not financial advice. Users are responsible for their own trading decisions and risk management.
**Requirements:**
- Understanding of futures trading and leverage
- Familiarity with Fair Value Gaps and institutional concepts
- Ability to monitor positions (not fully automated)
- Proper risk management discipline
---
#### 🔧 Technical Specifications
- **Platform:** TradingView Pine Script v5
- **Type:** Strategy (with backtesting capabilities)
- **Timeframe:** Optimized for 1H (works on other timeframes)
- **Markets:** Any futures market (crypto, stocks, indices, forex)
- **Repainting:** NO - All signals are final on bar close
- **Alerts:** Full webhook support for automation
- **Default Settings:** 10% position size, pyramiding enabled (max 10 positions)
---
#### 📞 Support
Questions about setup or usage? Contact the author through TradingView messages.
**Note:** This indicator is for educational and trading tool purposes only. The author is not responsible for trading losses. Trade responsibly and within your risk tolerance.

Supertrend Strategy with ATR TP and SLSupertrend Strategy with ATR TP and SL
Overview
The Supertrend strategy is a trend-following trading system that utilizes the Average True Range (ATR) to determine the market's volatility and to set dynamic support and resistance levels. This strategy employs the Supertrend indicator to identify entry and exit points for trades, specifically focusing on long and short positions in the market.
Key Components
Inputs
ATR Period: This defines the lookback period for calculating the ATR, which helps in understanding market volatility. The default value is set to 10.
Supertrend Multiplier: This multiplier adjusts the sensitivity of the Supertrend indicator. A value of 3 is used, affecting the upper and lower bands of the Supertrend calculation.
TP (Take Profit) ATR Multiplier: This multiplier is used to calculate the take profit level based on the ATR (default value is 3).
SL (Stop Loss) ATR Multiplier: This multiplier dictates the stop loss distance from the entry point concerning the ATR, set to a value of 1.5.
Number of Bars to Use for Backtest: This setting determines how many bars are analyzed during testing, set to a default of 240.
Trading Mode: Options are provided to choose whether to take only long positions or only short positions.
ATR Calculation
The ATR is computed using a specified period, allowing traders to gauge market volatility effectively. This is crucial for setting appropriate stop loss and take profit levels.
Supertrend Calculation
The Supertrend indicator is calculated using the ATR and the multiplier to derive upper and lower bands. The current market price is compared against these bands to determine the trend direction.
Trade Signals
Buy Signal: Generated when the price closes above the Supertrend line, indicating a potential upward trend.
Sell Signal: Generated when the price closes below the Supertrend line, indicating a potential downward trend.
Entry and Exit Strategies
When a buy signal is triggered, the strategy will enter a long position while setting the take profit and stop loss based on the ATR values.
Conversely, if a sell signal occurs, a short position is opened with respective take profit and stop loss levels.
Alert Conditions
Alerts are set up for both buy and sell signals, allowing users to be notified when trade opportunities arise.
Visualization
The Supertrend line is plotted on the chart, along with take profit and stop loss levels for each trade. Labels indicate entry points to facilitate easy tracking of trades.
Conclusion
This Supertrend strategy is designed to simplify trading decisions by automating the entry and exit points based on well-defined market conditions. By utilizing the ATR for dynamic risk management, traders can adapt their approach according to market volatility. This strategy is suitable for many trading styles and can be backtested to assess its performance across different market conditions.
Usage
To use this strategy, simply apply the script in TradingView and adjust the input parameters based on your trading preferences. The strategy can be modified further to enhance its performance according to specific market scenarios.
TheHorsyAlgoPROThe Horsy algo is an automated strategy that uses any minute Higher timeframe range as reference and search for a purge of liquidity on the HTF high or low where buyside or sell side liquidity is, the algo only search this at specific desired times that can be configured according to the time you usually trade, the strategy is known as Turtle soup purge and reverse or lately as CRT.
Why is useful?
The purpose of this Algorithm is to help turtle soup traders to quickly identify when the market is likely to reverse the algo evaluates if the opportunity is worth it, base on risk reward and other desired filters. Also this strategy can help to quickly backtest the trader strategy it can be configured in different timeframes and adapt to the trader personality, they can easily see the results and statistics and notice if its profitable or not.
This algo is useful for intraday traders looking for a purge and reverse at a key times and at key HTF price levels this only looks the previous HTF highs and lows but is important to also monitor Order blocks, FVGs, gaps, or wicks to have the best results.
How it works and how it does it?
The Horsy algo simply Jumps from one type of liquidity to another one buyside to sell side or vice versa. In order for the algo to trigger an entry it has to meet these conditions
1. Take HTF liquidity, trade above a HTF high or below a HTF low in the selected time window
2. Make a change in the state of delivery with a close below the previous candle low for shorts and close above previous candle high for longs.
3. Allow for a reasonable risk reward, it will use the highest high for shorts and the lowest low for longs. The default take profit is the opposite side of the range.
4. Validate others user filters this include enter only trades aligned with the HTF bias, or trades aligned with the LTF bias or booth. The algo have the option to enter only premium and discount entries. And finally, an option to allow for different contract sizes depending of the maximum percent of the account we want to risk default is 1%. For this last option is important to check the initial balance and leverage are configured correctly, is disable by default because it requires more capital to perform well.
We can see the algo performing in the picture below with a short trade, notice there are some white lines, they are the high or the low of HTF candle that start generating inside candles in the HTF meaning a possible consolidation. The algo plots the HTF ranges in a shaded boxes as you can see below
The HTF bias as you can see in the picture is calculated based on the last close of the HTF meaning close above previous HTF high is bullish close below previous HTF low is bearish. This HTF bias level is also the last HTF mid-price or 50%. By default, this line is enabled.
The LTF bias is calculated based on the range created from the expansion outside the previous HTF range is also the mid-price. If the LTF close above previous HTF high is bullish and if the LTF close below previous HTF low is bearish. By default this LTF bias line is disable.
This strategy includes an original and personal developed code that uses dealing ranges to recognize if the market is expanding, retracing, reversing or consolidating. This allow the algo to exit the position when it detects a retracement or at the end of the expansion. This is the default exit type.
You can monitor the previous dealing ranges created in history with an option than can be enable, by default is disable, this ranges are created after price takes buyside and then sell side or vice versa. So this dealing ranges can be useful also to identify minor pools of liquidity and premium and discount in the lower timeframe.
The picture below is a long example, the exit in this case is just at the high of the range. The normal take profit is in a blue line for longs.
How to use it?
First select the desired HTF timeframe recommended is from 30min to 240min then you setup the chart on the lower timeframe you want to trade recommended is from 1min to 15min to enter. By default This strategy is designed to work for intraday during key times when price take stops and then moves quickly away from them. You can select as much as 6 different times or just one. After you select the desired time window where the algo will look for the purge and reverse, They are highlighted in the candles that change colors excluding the gray ones that indicates consolidation.
Then the Algo allow to performs several additional filters in the entries you can select if you want to trade only longs or shorts trades, you can select when to move the stop loss to Break even. In deviations of the risk or you can just select to remove risk when price hits the 50% of previous HTF range.
You can select the minimum desired risk reward of the trade before is allow to be taken. Once is configured correctly the algo should trigger signals with a triangle up or down plus the strategy entry.
At the beginning of the picture there are some blue lines in the HTF high low and close, this is to easily identify that the market is in the Asia session, the time can be configured by the user, these lines are normally gray.
On the right top of the screen you can see some statistics about the strategy how many trades it took, ARR is an approximated value of the accumulated total risk reward of all the trades when they get closed in the simulation.
Profit factor and percent profitable are also shown should be green it means that the strategy makes money over time. But apart from that is important to notice how it makes money it is stable over time? it is a roller coaster? that why I Include this other measurements MxcsTps is the maximum consecutives take profits and Mxcsls is the maximum consecutive stop losses it takes, the slash number after it is the consecutive Break evens. So this way you know what to expect and what is normal in the strategy.
The algo shows all the times the stop loss, take profit and break even level if enable in the colored red lines for short and blue lines for longs. You can also select how price will manage the profit or stoploss point meaning that you can choose to wait for the candle to close to invalidate your idea or to take profit. This is good to avoid liquidity sweeps but can also lead to mayor loses if the idea is wrong. The default setting is to close the trade when price takes the high or low where the stoploss is, the take profit is taken after a retracement to allow to profit on expansions. You can select also to exit on a reversal if you want to ride all the move. This last option has to be used with caution because sometimes price just retrace or reverse very fast decreasing the trade profit and overall strategy performance.
The algo have the option to use standard deviation from the normal risk if you prefer to prevent liquidity sweeps near the stop level this make wider stops but can lead to increased loses so it has to be used carefully.
Below is a picture that show the entry stop and take profit levels with an exit on a retracement activated.
Strategy Results
The backtesting results are obtained simulating a 2000usd account in the Micro Nasdaq using 1 contract per trade. Commission are set to 2usd per contract, slippage to 1tick. You can see in list of trades we are not risking more than 1 % percent of the account. The backtested range is from august to November 2024. This strategy doesn’t generate too much trades because of the time filters and conditions that has to be meet to take an entry but you can see the results of the last 4months with the available data that are around 32 trades.
The default settings for this strategy is HTF as 240min designed to work on a LTF 5min chart, the default purge times are 245-300, 745-800, 845-900, 1045-1100 and 1245-1300 UTC-4, the algo will look for shorts or longs, with a minimum risk reward of 2.0. With an additional filter of the HTFBias. The take profit is by default taken on the first retracement after hitting the target. The default settings are optimized to work on the Nasdaq or Spy, but can also perform well in other assets with the correct adjustments.
Remember entries constitute only a small component of a complete winning strategy. Other factors like risk management, position-sizing, trading frequency, trading fees, and many others must also be properly managed to achieve profitability. Past performance doesn’t guarantee future results. To really take advantage of this strategy you have to study turtle soup and the HTF key levels use this only as a confirmation that your overall idea will play out and use it to backtest your model.
Summary of features
·Adaptable strategy to different HTF timeframes from 1-1440min
· Select up to 6 different purge time windows UTC-4, UTC-5
· Choose desired Risk Reward per trade
· Easily see the HTF high low close and 50% key levels in the LTF
· Identify HTF consolidations that generate key major liquidity pools
· HTF/LTF bias filters to trade in favor of the big trend or in sync
· Shaded boxes that indicate if the market is bullish, bearish or consolidating
· See the current midpoint of the last expansion move
· Optimal trade entry filter to trade only in a discount or premium
· Customizable trade management take profit, stop, breakeven level
· Option to exit on a close, retracement or reversal after hitting the take profit level
· Option to exit on a close or reversal after hitting stop loss
· Configurable breakeven point with standard deviations or at 50% of the HTF
· Calculate different contract sizes depending of a percentage of the initial balance
· Standard deviations from normal risk can be used to prevent liquidity sweeps
· See dealing ranges history to check minor pools of liquidity and premium or discount
· Dashboard with instant statistics about the strategy current settings

Single Swing Strategy (SSS)Introduction
The Single Swing Strategy (SSS) is a trading strategy designed for assets that trend. It utilises a single technical indicator to identify potential buying opportunities in upward-trending markets. The strategy focuses on moments when the price of an asset breaks out to a new high, suggesting a strong upward momentum.
Components
1. Exponential Moving Averages (EMAs): SSS uses two EMAs to evaluate the overall asset trend. SSS describes an uptrend as identified, when the fast EMA crosses above the slow EMA and vice versa for a downtrend.
2. Breakout: The strategy validates the trend identified by the EMAs through breakouts in the price action of the asset over a specified lookback period. No indicator is required for this step.
3. Average Directional Index (ADX): The ADX is used to measure the strength of a trend. It does not indicate the trend's direction but rather its strength, whether it's an uptrend or downtrend. A high ADX value (typically above 25) suggests a strong trend, either up or down while a low ADX value (typically below 20) indicates a weak or non-trending market. The ADX itself is a moving average of the expanding range between the +DI and -DI.
4. Positive Directional Indicator (DI+): DI+ helps identify the presence and strength of uptrends. It is calculated based on the upward price movement between current and previous highs. A rising DI+ alongside a rising ADX suggests a strengthening uptrend. When DI+ crosses above DI-, it's often interpreted as a bullish signal.
5. Negative Directional Indicator (DI-): DI- is used to detect the presence and strength of downtrends.It is derived from the downward price movement between current and previous lows. An increasing DI- along with a rising ADX indicates a strengthening downtrend while a crossover of DI- above DI+ is typically seen as a bearish signal.
How it works
1. Regime filter with ADX, DI+, and DI-: The first step in taking a trade is to determine the direction of the trend using the +DI. If in an uptrend, the strategy checks if the ADX is above 25 to confirm a strong uptrend. -DI is not used since the strategy is long only. If in an uptrend and the trend is strong, trades can be opened.
2. Trend Identification with EMAs: Initially, the strategy uses two Exponential Moving Averages (fast and slow) to determine the asset trend. A fast EMA crossing above the slow EMA signifies an uptrend, and vice versa for a downtrend. This is the Entry signal to open a long position.
3. Trend Confirmation with Breakout: The strategy confirms the EMA-indicated trend through price breakouts over a specified lookback period. An EMA crossover without a price action breakout does not lead to an entry signal
4. Trade Management: After entering a trade, the strategy uses predefined levels for taking profit and setting stop losses. Trades are closed either when the price reaches the take-profit level or falls to the stop-loss level. Hence, risk management is built in.
Results
The backtest results can be found below. Initial capital of 10000 was used, this is a convenient amount for most retail traders, commission of $3 per order, position size of 3% of initial capital and slippage of 3 ticks. These are all representative of real world retail trading conditions.
Originality
The Single Swing Strategy (SSS)'s originality is in its blending of classical technical analysis; Trend Analysis through EMAs and Price Action through Breakout, into an innovative trading logic.
1. The Essence of Trend and Breakout in SSS
(i) Trend Recognition: At the heart of SSS is the Exponential Moving Averages (EMAs). While the use of EMAs is common, SSS employs them for trend analysis so an entry decision can be made. The strategy's core algorithm assesses the inception of an upward trend by observing a specific crossing pattern of the EMAs, a moment where the asset's momentum shifts, offering a strategic advantage.
(ii) Breakout Significance: The strategy's reliance on price breakouts isn't just about identifying a new high; it's about understanding market psychology. A breakout beyond a previous high signals not only momentum but also a collective market sentiment that favors upward movement. SSS attempts to capture this momentum, translating it into a tangible trading opportunity.
(iii)Strength of trend: The ADX and +DI double checks the trend is in the right direction and checks to see if the trend is strong enough hence, it prevents trading when the trend is not supportive.
2. Simplicity as a Cornerstone
(i) Clarity and Efficiency: In the realm of algorithmic trading, complexity isn't always synonymous with effectiveness. SSS' simplicity ensures its logic is transparent and its execution, efficient. This simplicity is a strategic choice, designed to reduce overfitting to past data and improve adaptability to real-market conditions.
(ii) Ease of Use and Decision Making: The straightforward nature of SSS may empower traders to make informed decisions without being overwhelmed by convoluted indicators. This is particularly useful because of the embedding of risk management using defined exit points after entry through a Take Profit and Stop Loss. This hardcodes a 3:1 risk reward ratio into every trade.
3. Positive Expectancy
(i) Performance Metrics: The SSS strategy shows its edge in its backtesting results. A 62% win rate, a profit factor of 1.7, profit ratio of 1.05 and an average trade gain of 4.7% are not just numbers; they show the mathematical edge over the backtest period, especially considering the high commissions and slippage factored into its design.
Trading
The SSS strategy has been backtested on the 1D timeframe of BTCUSD but users are encouraged to try it on other assets such as SPXL (5min), AAPL (5min) and others but the appropriate timeframe and trading costs may vary.
NOTE
Like any trading strategy, SSS does not guarantee profits. It's a tool to assist in decision-making, not a foolproof solution. Trading involves risks, particularly in volatile markets. Users should trade responsibly, considering their risk tolerance and financial situation. While SSS automates some aspects of trading, it requires continuous monitoring and does not replace the need for sound judgement and decision-making by the trader.

Premium VWAP Trendfollow Strategy [wbburgin]This is a strongly-revised version of my VWAP Trendfollow Strategy, which follows a substantial reworking to address various structural inefficiencies with the script, such as the narrowing of the standard deviation band upon anchor reset. I will continue updating the original script with planned adjustments, this is a different proof-of-concept that builds off of the original script thesis with a different calculation method and execution.
This strategy is not built for any specific asset or timeframe, and has been backtested on crypto and equities from 1 min-1 day. The previous experimental strategy was heavily-correlated with the actual movement of the asset, which added unpalatable risk to the strategy and increased drawdown. This revised form has a more stable backtesting curve, but I want to heavily emphasize that I cannot guarantee that the strategy will be profitable for your circumstances. Backtesting only goes so far and every exchange has a different fee schedule, which can substantially eat into your profits. At the bottom I will explain the parameters behind the strategy results.
**********
The VWAP Trendfollow Strategy begins with a simple premise: to enter long when the price breaks above the upper standard deviation of a VWAP, and to close the position when the price breaks below the lower standard deviation of the VWAP. This is more effective than initiating the same strategy for a VWMA because the VWAP resets its anchor depending on your chosen anchor period, and the act of resetting its anchor also resets its standard deviation value. As a consequence, in sustained uptrends, the standard deviation is pulled upward to meet the price when the anchor resets, instead of requiring the price to fall all the way back down, as in the lower standard deviation band of the VWMA. This essentially acts as the VWAP itself raising the stop loss at each anchor period, which works well for the overall trend-following strategy.
However, this narrowing can still have consequences for a simple breakout strategy; as the price gradually oscillates towards above or below its standard deviation band, it may cross over the other and produce false signals. This oscillation is worrisome especially when fees are taken into account.
Thus, the premium VWAP Trendfollow strategy has a variable width which detects abnormal narrowing of the band, and adjusts it until it is reasonable to close the variability period. Additionally, a filter is added to the open/close signals to soften the frequency of signals without impacting performance significantly.
This script contains an ATR stop loss and an ATR take profit (which is also a difference between it and the original experimental script), with customizable inputs. The strategy results shown below are with initial capital of $1000, qty entry of 10%, and commissions of 0.06%. It works best on 24/7 instruments, like crypto, but I have found it also works with FAANG stocks or other high volatility / high volume assets. The issue with stocks, however, is that the price can jump/plummet because of abnormal events after-hours, which the strategy cannot pick up on until pre-trading begins the next morning. For that reason I suggest it be used on crypto and, because of its low % profitable (but high average winning trade in relation to its average losing trade), be used on an exchange that has minimal fees or volume-based discounts. In the unfortunate case that you cannot find a minimal fee or volume-discounted fee exchange (such as fellow Americans following the liquidity-retreat on Binance.US), I encourage you to test out the higher anchor periods for the higher timeframes, which will reduce the number of trades and increase the average % per trade.
Additionally, this is a long-term strategy used best for accumulation. It is currently long-only; that may change based off of user input.
**********
Disclaimer
Copyright by wbburgin.
The information contained in my Scripts/Indicators/Algorithms does not constitute financial advice or a solicitation to buy or sell any securities of any type. I will not accept liability for any loss or damage, including without limitation any loss of profit, which may arise directly or indirectly from the use of or reliance on such information.
All investments involve risk, and the past performance of a security, industry, sector, market, financial product, trading strategy, backtest, or individual's trading does not guarantee future results or returns. Investors are fully responsible for any investment decisions they make. Such decisions should be based solely on an evaluation of their financial circumstances, investment objectives, risk tolerance, and liquidity needs.

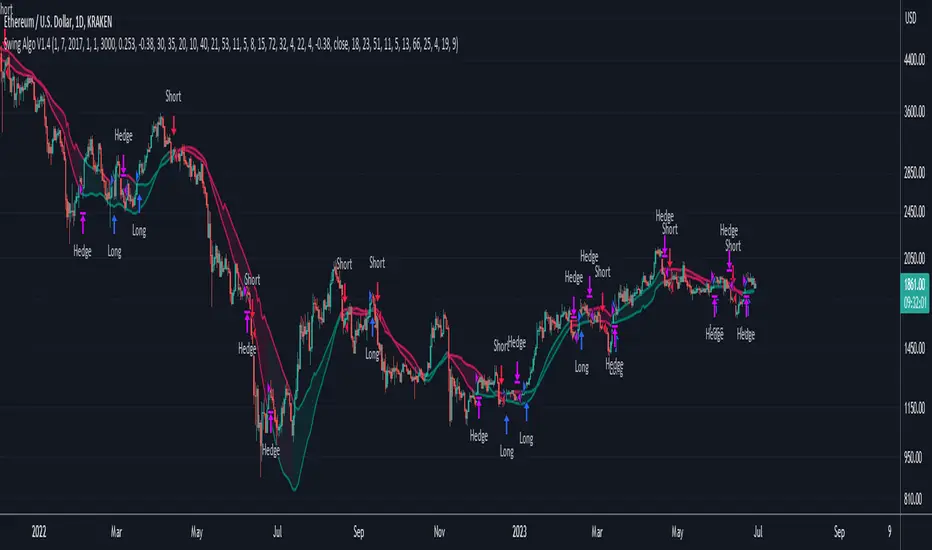
Swing Algo V1.4◆ Introduction
The latest version of the Swing Algo features a complementary system consisting of two internal swing trading logics: an enhanced Swing Algo V1.3 and a secondary control engine to stabilize the overall strategy behaviour in times of increased market chop. Both algorithms feature different averaging lines as well as oscillators, leading to a higher strategy diversification for swing trading as well as a reduced maximum drawdown in comparison to each stand-alone strategy.
While the Swing Algo V1.x series so far featured a single trend-following swing algorithm for each release, where one just switches between Long and Short trades based on one general logic, here two strategies, which act independently of each other, are applied. Due to this, we introduce a third position a trader can be in: the Hedge. The overall logic is as follows:
When both sub-logics are Long, the overall strategy is Long.
When both sub-logics are Short, the overall strategy is Short.
When one sub-logic is Long and the other is Short, the overall strategy is in a Hedge position. It doesn't matter which component is Short and which is Long.
As PineScript doesn't currently offer a real steady hedging-function for two competing swing trading sub-logics (in the sense of a continuously applied Hedge state after hedging conditions are met at least once for an entry), a workaround via position closes was created for this release. For each new internal sub-signal, the overall strategy changes its state (Long/Short/Hedge) visibly on the chart, and the trader can adjust their position accordingly.
For detailed differences to previous Swing Algo V1.x releases, see further below.
◆ Purpose of this Script
This indicator will give Long, Short and Hedge signals on the chart that can be used for e.g. swing trading. Each of the aforementioned sub-logics uses a combination of several (custom) functions and rules to find good entry points for trend trading. After many iterations and tests I came up with this particular setup, which is highly optimized for the ETH/USD trading pair on the daily (D) timeframe.
Attention was also paid to stability, as all parameters are set onto plateaus, so that smaller changes in the characteristic price action should not affect the efficiancy too much, done as an attempt to reduce overfitting as much as possible. Additionally this dual algorithm system is specifically designed to have a safety net: should for the unlikely scenario one swing trading algorithm not trigger at a certain mid-term reversal point, the probability is high that the other will trigger, resulting in an overall hedged position (so that no money is lost in the meantime) until the first algorithm can rejoin at the next mid-term trend change.
For other assets and/or timeframes it is in principle possible to change algorithmic parameters within the indicator settings to tune the swing algorithms, though it is strongly recommended to use the standard asset and timeframe mentioned above.
◆ Viability
For the here presented backtest data, we omitted the biggest portion of the cryptocurrency bullrun in 2017 (starting only at 1st July 2017) so that the results become more realistic for long-term swing traders (investing at least 2-4 years into trading) if such large runs do not happen again. As cryptocurrencies like Ethereum are still to this date capable of doing comparatively smaller runs of about 2-3x in a few weeks/months during accumulation phases (as witnessed e.g. in 2020 and more recently in 2023) and bigger runs during bullmarkets (as witnessed in 2021), the quality of the shown results is still realistic for long-term trend trading efforts over several years, Note that very conservative trading parameters as mentioned below in "Forwardtesting and Backtesting" are used here.
Generally do not expect results in a matter of days or weeks, and of course as with any trading strategy past performances are not indicative of future results.
◆ Forwardtesting and Backtesting
The individual components have been back- and partially forwardtested: The first sub-logic is an advancement of Swing Algo V1.3, with which we have extensive experience running back to October 2020 for its release, while the secondary control strategy, which was privately published for DeanTrader members as a stand-alone script on TradingView in June 2022 and was running in the background since then, is showing good & expected behaviour so far.
While this does not mean that fowardtesting was performed specifically for the combined Swing Algo V1.4 system we have now (which cannot be done realistically considering the timeframes used, i.e. months and especially years), we can at least look at some considerable experience with the individual components. Then again, as I have implemented an exact hedging-function so that both sub-algorithms run independently from each other, it is not likely to see any unexpected behaviour resulting purely from the combination into one script.
For strategy backtesting you can choose the backtest time interval to test the performance of this algorithm for different time windows and different trading pairs. Here various backtesting parameters (e.g. trading fees) can be customized. Default settings for the shown backtest are a starting balance of $1000, a slippage of 20 ticks (= $0.20) and a trading fee of 0.05 % (which is the worst taker fee on the Kraken Pro futures exchange) to have realistic settings. However as we do not conduct many trades with this strategy, fees should not impact our performance too much. As long-term swing traders, we at DeanTrader generally devote one initial portion of our portfolio to swing trading and from then on always use 100% of this portion for the next trade to get the compounding starting. This is in difference to other trading styles which use various, often very small, percentage values for their short- or mid-term trades. Please note that for the here presented backtest only 10% of compounded equity is used for each successive trade to show an estimation for a lower risk & lower reward approach . Keep this in mind when evaluating the backtest data. You can set appropriate values for each backtest parameter in the "Properties" setting menu of the strategy, including the order size percentage of equity value for your trades. Also note that due to the small number of trades the statistical significance is low. It is not possible to gather an abundance of long-term trend signals in the order of hundreds or thousands trades, as much more time would have to pass for this in the case of rather new assets like Ethereum.
Additionally to the TradingView Strategy Tester you can also plot your equity directly on the chart to get a sense for the performance. For this you can also scale the equity graph to e.g. match the starting point of your equity with some price point on the chart to get a direct comparison to 'Buy & Hold' strategies over time.
This indicator (and all other content I provide) is no financial advice. If you use this indicator you agree to my Terms and Conditions which can be found on my website linked on my TradingView profile or in my signature.
◆ Visual Representation on the Chart
Shown below is a screenshot of how the chart looks like when the strategy is applied. Here we can see two different averaging lines, where each line belongs to one of the two sub-logics respectively. Note that this is not a MA-crossover strategy, and the crossing of the lines is not accounted for in the code at all and therefore has no effect on the strategy's signal output. Also note that the price scale is set on logarithmic.
The space between the lines is filled with a faint background color as a rough visual indicator. Magenta-colored fills indicate zones where only Short or Hedge signals can appear, while green-colored fills indicate zones where only Long or Hedge signals can appear. Gray-colored fills mark zones where only Hedge signals can appear, which also means that Hedge signals can appear in any zone. So treat those background fills more as a visual aid to roughly know what can happen next, but pay most attention to the actual signals (with arrows) that appear on the chart.
◆ Differences to Other Versions
Consists now of two competing sub-algorithms instead of just one algorithm. The new system outputs Long, Short and Hedge signals instead of just Long and Short signals.
The first sub-logic is the spiritual successor of the original Swing Algo V1.3 release, with a modified oscillator part.
The second sub-logic serves as a control algorithm (while still having equal rights in terms of strategy impact), newly introduced to the Swing Algo series, but already forwardtested for roughly a year at time of release.
Lowers risk significantly by diversifying swing trading strategies, so that for the rare scenario of a missed trend on one sub-algorithm, losses are prevented as the overall strategy is hedged during that time.
Lowers risk further as the maximum drawdown of the combined strategy is reduced by roughly 1/3 in comparison to each stand-alone strategy while almost retaining the same net profit over a 6-year backtest compared to the first, leading sub-logic.
No guesswork anymore when to use which short leverage (1x corresponding to a Hedge, or 2x corresponding to a Short with an asset-value-change-to-gain-proportionality of -1) as it is clearly defined within the trading system via the displayed signals. In earlier Swing Algo versions, the short leverage for any particular Short signal had to be chosen by hand dependent on market sentiment, which required further market analysis, or was fixed at 2x, leading to less flexibility.
◆ Access
For access please contact me via DM on TradingView or via other channels (linked on my TradingView profile and in my signature).
Premium Volatility Breakout Strategy [wbburgin]This the premium version of my Volatility Breakout strategy, which improves significantly on the original strategy (publicly available on my profile). Improvements are below. A note about any of my premium scripts: I will continue updating and improving the original (public) versions.
This strategy is not built for any specific asset or timeframe, and has been backtested on crypto, equities, and forex from 1min - 1day. However, I recommend using it on more volatile assets because it is a breakout strategy.
********** My Background
I am an investor, trader, and entrepreneur with 10 years of cryptocurrency and equity trading experience and founder of two fintech startups. I am a graduate of a prestigious university in the United States and carry broad and inclusive interests in mathematical finance, computer science, machine learning / artificial intelligence, as well as other fields.
**********
Improvements over the original Volatility Breakout strategy include:
Faster Trend Detection → The Premium Volatility Breakout strategy will catch trends faster by using adaptive volatility-weighted bands instead of standard-width volatility-weighted bands. This can improve win size and has performed well in my backtesting.
ADX Filter → False breakouts dampen the overall results of the original script, as well as the % profitable,so an ADX filter has been programmed into the script (toggle on/off in settings). This filter will only enter long and short trades when the ADX is above a certain threshold. This is by default toggled off because in most instances it will not be necessary, but in certain environments may be useful.
MA Configuration → Different types of moving averages and weights are now configurable in the settings. These can change the responsiveness of the strategy.
External Trend Filter → I use this strategy as a filter for some of my low-timeframe algorithms. I have added an external trend filter (a plot only displayed in the data window) that will return “1” when the trend is long and “-1” when the trend is short (displayed on-chart with red and green trend curves).
Customizable Alert Messages In-Strategy → In the settings, there will be text boxes where you can create your own alerts. All you will need to do is create an alert in the alert panel on TradingView and leave the message box blank - if you fill out the alert boxes in the settings, these will automatically populate into your alerts. There are in total four different customizable alerts messages: Entry and Exit alerts for both Long and Short sides. If you disable stop loss and/or take profit, these alerts will also be disabled. Similarly, if you disable shorts, all short alerts will be disabled.
About stop losses: This strategy does not come with a stop loss because the moving average acts as a stop loss / trade exit for both long and short entries.
**********
Display
You can turn off highlighting or barcolor in the settings. Additionally, future updates may include a color scheme for users using a light-themed window.
**********
Configuring Alerts
In TradingView desktop, go to the ‘Alerts’ tab on the right panel. Click the “+” button to create a new alert. Select this strategy for the condition and one of the two options that includes alert() function calls. Name the alert what you wish and clear the default message, because your text in the settings will replace this message.
Now that the alert is configured, you can go to the settings of the strategy and fill in your chosen text for the specific alert condition. You will need to check “Long and Short” in the “Trade Direction” setting in order for any Short Alerts to become active.
**********
Disclaimer
Copyright by wbburgin.
The information contained in my Scripts/Indicators/Algorithms does not constitute financial advice or a solicitation to buy or sell any securities of any type. I will not accept liability for any loss or damage, including without limitation any loss of profit, which may arise directly or indirectly from the use of or reliance on such information.
All investments involve risk, and the past performance of a security, industry, sector, market, financial product, trading strategy, backtest, or individual's trading does not guarantee future results or returns. Investors are fully responsible for any investment decisions they make. Such decisions should be based solely on an evaluation of their financial circumstances, investment objectives, risk tolerance, and liquidity needs.

nOI + Funding + CVD • strategynOI + Funding + CVD Strategy
Overview
This strategy is designed for cryptocurrency trading on platforms like TradingView, focusing on perpetual futures markets. It combines three key indicators—Normalized Open Interest (nOI), Funding Rate, and Cumulative Volume Delta (CVD)—to generate buy and sell signals for long and short positions. The strategy aims to capitalize on market imbalances, such as overextended open interest, funding rate extremes, and volume deltas, which often signal potential reversals or continuations in trending markets.
The script supports pyramiding (up to 10 positions), uses percentage-based position sizing (default 10% of equity per trade), and allows customization of trade directions (longs and shorts can be enabled/disabled independently). It includes multiple signal systems for entries, various exit mechanisms (including stop-loss, take-profit, time-based exits, and conditional closes based on indicators), a Martingale add-on system for averaging positions during drawdowns, and handling of opposite signals (ignore, close, or reverse).
This strategy is not financial advice; backtest thoroughly and use at your own risk. It requires data sources for Open Interest (OI) and Funding Rates, which are fetched via TradingView's security functions (e.g., from Binance for funding premiums).
Key Indicators
1. Normalized Open Interest (nOI)
Group: Open Interest
Purpose: Measures the relative level of open interest over a lookback window to identify overbought (high OI) or oversold (low OI) conditions, which can indicate potential exhaustion in trends.
Calculation:
Fetches OI data (close) from the symbol's standard ticker (e.g., "{symbol}_OI").
Normalizes OI within a user-defined window (default: 500 bars) using min-max scaling: (OI - min_OI) / (max_OI - min_OI) * 100.
Upper threshold (default: 70%): Signals potential short opportunities when crossed from above.
Lower threshold (default: 30%): Signals potential long opportunities when crossed from below.
Visualization: Plotted as a line (teal above upper, red below lower, gray in between). Horizontal lines at upper, mid (50%), lower, and a separator at 102%.
Notes: Handles non-crypto symbols by adjusting timeframe to daily if intraday. Errors if no OI data available.
2. Funding Rate
Group: Funding Rate
Purpose: Tracks the average funding rate (premium index) to detect market sentiment extremes. Positive funding suggests bull bias (longs pay shorts), negative suggests bear bias.
Calculation:
Fetches premium index data from Binance (e.g., "binance:{base}usdt_premium").
Supports lower timeframe aggregation (default: enabled, using 1-min TF) for smoother data.
Averages open and close premiums, clamps values, and scales/shifts for plotting (base: 150, scale: 1000x).
Upper threshold (default: 1.0%): Overheat for shorts.
Lower threshold (default: 1.0%): Overcool for longs.
Ultra level (default: 1.8%): Extreme for additional short signals.
Smoothing: Uses inverse weighted moving average (IWMA) or lower-TF aggregation to reduce noise.
Visualization: Shifted plot (green positive, red negative) with filled areas. Horizontal lines for overheat, overcool, base (0%), and ultra.
Notes: Custom ticker option for non-standard symbols.
3. Cumulative Volume Delta (CVD)
Group: CVD (Cumulative Volume Delta)
Purpose: Measures net buying/selling pressure via volume delta, normalized to identify divergences or confirmations with price.
Calculation:
Delta: +volume if close > open, -volume if close < open.
Cumulative: Rolling cumsum over a window (default: 500 bars), smoothed with EMA (default: 20).
Normalized: Scaled by absolute max in window (-1 to 1 range).
Scaled/shifted for plotting (base: 300 or 0 if anchored, scale: 120x).
Upper threshold (default: 1.0%): Over for shorts.
Lower threshold (default: 1.0%): Under for longs.
Visualization: Shifted plot (aqua positive, purple negative) with filled areas. Horizontal lines for over, under, and separator (default: 252).
Filter Options (for Signal A):
Enable filter (default: false).
Require sign match (Long ≥0, Short ≤0).
Require extreme zones.
Require momentum (rising/falling over N bars, default: 3).
Signal Logics for Entries
Entries are triggered by buy/sell signals from multiple systems (A, B, C, D), filtered by direction toggles and entry conditions.
Signal System A: OI + Funding (with optional CVD filter)
Enabled: Default true.
Sell (Short): nOI > upper threshold, falling over N bars (default: 3), delta ≥ threshold (default: 3%), funding > overheat, and CVD filter OK.
Buy (Long): nOI < lower threshold, rising over N bars (default: 3), delta ≥ threshold (default: 3%), funding < overcool, and CVD filter OK.
Signal System B: Short - Funding Crossunder + Filters
Enabled: Default true.
Sell (Short): Funding crosses under overheat level, optional: CVD > over, nOI < upper.
Signal System C: Short - Ultra Funding
Enabled: Default false.
Sell (Short): Funding crosses ultra level (up or down, both default true).
Signal System D: Long - Funding Crossover + Filters
Enabled: Default true.
Buy (Long): Funding crosses over overcool level, optional: CVD < under, nOI > lower.
Combined: Sell if A/B/C active; Buy if A/D active.
Entry Filters
Cooldown: Optional pause between entries (default: false, 3 bars).
Max Entries: Limit pyramiding (default: true, 6 max).
Entries only if both filters pass and direction allowed.
Opposite Signal Handling
Mode: Ignore (default), Reverse (close and enter opposite), or Close (exit only).
Processed before regular entries.
Position Management
Martingale (3 Steps):
Enabled per step (default: all true).
Triggers add-ons at loss levels (defaults: 5%, 8%, 11%) by adding % to position (default: 100% each).
Resets on position close.
Break Even:
Enabled (default: true).
Activates at profit threshold (default: 5%), sets SL better by offset (default: 0.1%).
Exit Systems
Multiple exits checked in sequence.
Exit 1: SL/TP
Enabled: Separate for long/short (default: true).
SL: % from avg price (defaults: 1% long/short).
TP: % from avg price (defaults: 2% long/short).
Exit 2: Funding
Enabled: Separate for long (up) / short (down) (default: true).
Long Exit: Funding > upper exit threshold (default: 0.8%).
Short Exit: Funding < lower exit threshold (default: 0.8%).
Exit 3: nOI
Enabled: Separate for long (up) / short (down) (default: true).
Long Exit: nOI > upper exit (default: 85%).
Short Exit: nOI < lower exit (default: 15%).
Exit 4: Global SL
Enabled: Default true.
Exit: If position loss ≥ % (default: 7%).
Exit 5: Break Even (integrated in position block)
Exit 6: Time Limit
Enabled: Separate for long/short (default: true).
Exit: After N bars in trade (defaults: 30 each).
Timer updates on add-ons if enabled (default: true).
Visual Elements
Buy/Sell Labels: Small labels ("BUY"/"SELL") on bars with signals, limited to last 30.
All indicators plotted on a separate pane (overlay=false).
Usage Notes
Backtesting: Adjust parameters based on asset/timeframe. Test on historical data.
Data Requirements: Works best on crypto perps with OI and funding data.
Risk Management: Incorporates SL/TP and global SL; monitor drawdowns with Martingale.
Customization: All thresholds, enables, and scales are inputs for fine-tuning.
Version: Pine Script v6.
For questions or improvements, contact the author. Happy trading!

Candle Breakout StrategyShort description (one-liner)
Candle Breakout Strategy — identifies a user-specified candle (UTC time), draws its high/low range, then enters on breakouts with configurable stop-loss, take-profit (via Risk:Reward) and optional alerts.
Full description (ready-to-paste)
Candle Breakout Strategy
Version 1.0 — Strategy script (Pine v5)
Overview
The Candle Breakout Strategy automatically captures a single "range candle" at a user-specified UTC time, draws its high/low as a visible box and dashed level lines, and waits for a breakout. When price closes above the range high it enters a Long; when price closes below the range low it enters a Short. Stop-loss is placed at the opposite range boundary and take-profit is calculated with a user-configurable Risk:Reward multiplier. Alerts for entries can be enabled.
This strategy is intended for breakout style trading where a clearly defined intraday range is established at a fixed time. It is simple, transparent and easy to adapt to multiple symbols and timeframes.
How it works (step-by-step)
On every bar the script checks the current UTC time.
When the first bar that matches the configured Target Hour:Target Minute (UTC) appears, the script records that candle’s high and low. This defines the breakout range.
A box and dashed lines are drawn on the chart to display the range and extended to the right while the range is active.
The script then waits for price to close outside the box:
Close > Range High → Long entry
Close < Range Low → Short entry
When an entry triggers:
Stop-loss = opposite range boundary (range low for longs, range high for shorts).
Take-profit = entry ± (risk × Risk:Reward). Risk is computed as the distance between entry price and stop-loss.
After entry the range becomes inactive (waitingForBreakout = false) until the next configured target time.
Inputs / Parameters
Target Hour (UTC) — the hour (0–23) in UTC when the range candle is detected.
Target Minute — minute (0–59) of the target candle.
Risk:Reward Ratio — multiplier for computing take profit from risk (0.5–10). Example: 2 means TP = entry + 2×risk.
Enable Alerts — turn on/off entry alerts (string message sent once per bar when an entry occurs).
Show Last Box Only (internal behavior) — when enabled the previous box is deleted at the next range creation so only the most recent range is visible (default behavior in the script).
Visuals & On-chart Info
A semi-transparent blue box shows the recorded range and extends to the right while active.
Dashed horizontal lines mark the range high and low.
On-chart shapes: green triangle below bar for Long signals, red triangle above bar for Short signals.
An information table (top-right) displays:
Target Time (UTC)
Active Range (Yes / No)
Range High
Range Low
Risk:Reward
Alerts
If Enable Alerts is on, the script sends an alert with the following formats when an entry occurs:
Long alert:
🟢 LONG SIGNAL
Entry Price:
Stop Loss:
Take Profit:
Short alert:
🔴 SHORT SIGNAL
Entry Price:
Stop Loss:
Take Profit:
Use TradingView's alert dialog to create alerts based on the script — select the script’s alert condition or use the alert() messages.
Recommended usage & tips
Timeframe: This strategy works on any timeframe but the definition of "candle at target time" depends on the chart timeframe. For intraday breakout styles, use 1m — 60m charts depending on the session you want to capture.
Target Time: Choose a time that is meaningful for the instrument (e.g., market open, economic release, session overlap). All times are handled in UTC.
Position Sizing: The script’s example uses strategy.percent_of_equity with 100% default — change default_qty_value or strategy settings to suit your risk management.
Filtering: Consider combining this breakout with trend filters (EMA, ADX, etc.) to reduce false breakouts.
Backtesting: Always backtest over a sufficiently large and recent sample. Pay attention to slippage and commission settings in TradingView’s strategy tester.
Known behavior & limitations
The script registers the breakout on close outside the recorded range. If you prefer intrabar breakout rules (e.g., high/low breach without close), you must adjust the condition accordingly.
The recorded range is taken from a single candle at the exact configured UTC time. If there are missing bars or the chart timeframe doesn't align, the intended candle may differ — choose the target time and chart timeframe consistently.
Only a single active position is allowed at a time (the script checks strategy.position_size == 0 before entries).
Example setups
EURUSD (Forex): Target Time 07:00 UTC — captures London open range.
Nifty / Index: Target Time 09:15 UTC — captures local session open range.
Crypto: Target Time 00:00 UTC — captures daily reset candle for breakout.
Risk disclaimer
This script is educational and provided as-is. Past performance is not indicative of future results. Use proper risk management, test on historical data, and consider slippage and commissions. Do not trade real capital without sufficient testing.
Change log
v1.0 — Initial release: range capture, box and level drawing, long/short entry by close breakout, SL at opposite boundary, TP via Risk:Reward, alerts, info table.
If you want, I can also:
Provide a short README version (2–3 lines) for the TradingView “Short description” field.
Add a couple of suggested alert templates for the TradingView alert dialog (if you want alerts that include variable placeholders).
Convert the disclaimer into multiple language versions.

AltCoin & MemeCoin Index Correlation [Eddie_Bitcoin]🧠 Philosophy of the Strategy
The AltCoin & MemeCoin Index Correlation Strategy by Eddie_Bitcoin is a carefully engineered trend-following system built specifically for the highly volatile and sentiment-driven world of altcoins and memecoins.
This strategy recognizes that crypto markets—especially niche sectors like memecoins—are not only influenced by individual price action but also by the relative strength or weakness of their broader sector. Hence, it attempts to improve the reliability of trading signals by requiring alignment between a specific coin’s trend and its sector-wide index trend.
Rather than treating each crypto asset in isolation, this strategy dynamically incorporates real-time dominance metrics from custom indices (OTHERS.D and MEME.D) and combines them with local price action through dual exponential moving average (EMA) crossovers. Only when both the asset and its sector are moving in the same direction does it allow for trade entries—making it a confluence-based system rather than a single-signal strategy.
It supports risk-aware capital allocation, partial exits, configurable stop loss and take profit levels, and a scalable equity-compounding model.
✅ Why did I choose OTHERS.D and MEME.D as reference indices?
I selected OTHERS.D and MEME.D because they offer a sector-focused view of crypto market dynamics, especially relevant when trading altcoins and memecoins.
🔹 OTHERS.D tracks the market dominance of all cryptocurrencies outside the top 10 by market cap.
This excludes not only BTC and ETH, but also major stablecoins like USDT and USDC, making it a cleaner indicator of risk appetite across true altcoins.
🔹 This is particularly useful for detecting "Altcoin Season"—periods where capital rotates away from Bitcoin and flows into smaller-cap coins.
A rising OTHERS.D often signals the start of broader altcoin rallies.
🔹 MEME.D, on the other hand, captures the speculative behavior of memecoin segments, which are often driven by retail hype and social media activity.
It's perfect for timing momentum shifts in high-risk, high-reward tokens.
By using these indices, the strategy aligns entries with broader sector trends, filtering out noise and increasing the probability of catching true directional moves, especially in phases of capital rotation and altcoin risk-on behavior.
📐 How It Works — Core Logic and Execution Model
At its heart, this strategy employs dual EMA crossover detection—one pair for the asset being traded and one pair for the selected market index.
A trade is only executed when both EMA crossovers agree on the direction. For example:
Long Entry: Coin's fast EMA > slow EMA and Index's fast EMA > slow EMA
Short Entry: Coin's fast EMA < slow EMA and Index's fast EMA < slow EMA
You can disable the index filter and trade solely based on the asset’s trend just to make a comparison and see if improves a classic EMA crossover strategy.
Additionally, the strategy includes:
- Adaptive position sizing, based on fixed capital or current equity (compound mode)
- Take Profit and Stop Loss in percentage terms
- Smart partial exits when trend momentum fades
- Date filtering for precise backtesting over specific timeframes
- Real-time performance stats, equity tracking, and visual cues on chart
⚙️ Parameters & Customization
🔁 EMA Settings
Each EMA pair is customizable:
Coin Fast EMA: Default = 47
Coin Slow EMA: Default = 50
Index Fast EMA: Default = 47
Index Slow EMA: Default = 50
These control the sensitivity of the trend detection. A wider spread gives smoother, slower entries; a narrower spread makes it more responsive.
🧭 Index Reference
The correlation mechanism uses CryptoCap sector dominance indexes:
OTHERS.D: Dominance of all coins EXCLUDING Top 10 ones
MEME.D: Dominance of all Meme coins
These are dynamically calculated using:
OTHERS_D = OTHERS_cap / TOTAL_cap * 100
MEME_D = MEME_cap / TOTAL_cap * 100
You can select:
Reference Index: OTHERS.D or MEME.D
Or disable the index reference completely (Don't Use Index Reference)
💰 Position Sizing & Risk Management
Two capital allocation models are supported:
- Fixed % of initial capital (default)
- Compound profits, which scales positions as equity grows
Settings:
- Compound profits?: true/false
- % of equity: Between 1% and 200% (default = 10%)
This is critical for users who want to balance growth with risk.
🎯 Take Profit / Stop Loss
Customizable thresholds determine automatic exits:
- TakeProfit: Default = 99999 (disabled)
- StopLoss: Default = 5 (%)
These exits are percentage-based and operate off the entry price vs. current close.
📉 Trend Weakening Exit (Scale Out)
If the position is in profit but the trend weakens (e.g., EMA color signals trend loss), the strategy can partially close a configurable portion of the position:
- Scale Position on Weak Trend?: true/false
- Scaled Percentage: % to close (default = 65%)
This feature is useful for preserving profits without exiting completely.
📆 Date Filter
Useful for segmenting performance over specific timeframes (e.g., bull vs bear markets):
- Filter Date Range of Backtest: ON/OFF
- Start Date and End Date: Custom time range
OTHER PARAMETERS EXPLANATION (Strategy "Properties" Tab):
- Initial Capital is set to 100 USD
- Commission is set to 0.055% (The ones I have on Bybit)
- Slippage is set to 3 ticks
- Margin (short and long) are set to 0.001% to avoid "overspending" your initial capital allocation
📊 Visual Feedback and Debug Tools
📈 EMA Trend Visualization
The slow EMA line is dynamically color-coded to visually display the alignment between the asset trend and the index trend:
Lime: Coin and index both bullish
Teal: Only coin bullish
Maroon: Only index bullish
Red: Both bearish
This allows for immediate visual confirmation of current trend strength.
💬 Real-Time PnL Labels
When a trade closes, a label shows:
Previous trade return in % (first value is the effective PL)
Green background for profit, Red for losses.
📑 Summary Table Overlay
This table appears in a corner of the chart (user-defined) and shows live performance data including:
Trade direction (yellow long, purple short)
Emojis: 💚 for current profit, 😡 for current loss
Total number of trades
Win rate
Max drawdown
Duration in days
Current trade profit/loss (absolute and %)
Cumulative PnL (absolute and %)
APR (Annualized Percentage Return)
Each metric is color-coded:
Green for strong results
Yellow/orange for average
Red/maroon for poor performance
You can select where this appears:
Top Left
Top Right
Bottom Left
Bottom Right (default)
📚 Interpretation of Key Metrics
Equity Multiplier: How many times initial capital has grown (e.g., “1.75x”)
Net Profit: Total gains including open positions
Max Drawdown: Largest peak-to-valley drop in strategy equity
APR: Annualized return calculated based on equity growth and days elapsed
Win Rate: % of profitable trades
PnL %: Percentage profit on the most recent trade
🧠 Advanced Logic & Safety Features
🛑 “Don’t Re-Enter” Filter
If a trade is closed due to StopLoss without a confirmed reversal, the strategy avoids re-entering in that same direction until conditions improve. This prevents false reversals and repetitive losses in sideways markets.
🧷 Equity Protection
No new trades are initiated if equity falls below initial_capital / 30. This avoids overleveraging or continuing to trade when capital preservation is critical.
Keep in mind that past results in no way guarantee future performance.
Eddie Bitcoin

Multi-Timeframe MACD/RSI Pro StrategyKey Features: Pine Script v5 Structure:
Multi-Timeframe Analysis: for higher timeframe data
MACD, RSI, and ATR calculated on higher timeframe
EMA50 on current timeframe
Risk Management:
1:2.5 risk-reward ratio enforced
Stop loss based on 1.5x ATR
Position sizing (10% of equity per trade)
Profit Tracking:
Real-time performance metrics
Win rate calculation
ROI percentage display
Alert for 17% profit target
Visualization:
EMA50 plot on chart
Entry markers (triangles)
Performance table in top-right corner
Usage Instructions:
Apply to any TradingView chart
Default settings:
Higher timeframe: 4H
Risk/Reward: 1:2.5
Position size: 10% of equity
Commission: 0.1%
Monitor performance table for:
Total trades
Win rate percentage
Net profit
ROI percentage
To Verify 17% Profit Target:
Run backtest over significant historical data
Check ROI percentage in performance table
The alert will trigger automatically when 17% profit is reached
Note: For accurate backtesting:
Use at least 2 years of historical data
Test across multiple instruments
Adjust timeframe settings to match your trading style
Optimize ATR multiplier and risk/reward ratio for specific markets

EXODUS EXODUS by (DAFE) Trading Systems
EXODUS is a sophisticated trading algorithm built by Dskyz (DAFE) Trading Systems for competitive and competition purposes, designed to identify high-probability trades with robust risk management. this strategy leverages a multi-signal voting system, combining three core components—SPR, VWMO, and VEI—alongside ADX, choppiness filters, and ATR-based volatility gates to ensure trades are taken only in favorable market conditions. the algo uses a take-profit to stop-loss ratio, dynamic position sizing, and a strict voting mechanism requiring all signals to align before entering a trade.
EXODUS was not overfitted for any specific symbol. instead, it uses a generic tuned setting, making it versatile across various markets. while it can trade futures, it’s not currently set up for it but has the potential to do more with further development. visuals are intentionally minimal due to its competition focus, prioritizing performance over aesthetics. a more visually stunning version may be released in the future with enhanced graphics.
The Unique Core Components Developed for EXODUS
SPR (Session Price Recalibration)
SPR measures momentum during regular trading hours (RTH, 0930-1600, America/New_York) to catch session-specific trends.
spr_lookback = input.int(15, "SPR Lookback") this sets how many bars back SPR looks to calculate momentum (default 15 bars). it compares the current session’s price-volume score to the score 15 bars ago to gauge momentum strength.
how it works: a longer lookback smooths out the signal, focusing on bigger trends. a shorter one makes SPR more sensitive to recent moves.
how to adjust: on a 1-hour chart, 15 bars is 15 hours (about 2 trading days). if you’re on a shorter timeframe like 5 minutes, 15 bars is just 75 minutes, so you might want to increase it to 50 or 100 to capture more meaningful trends. if you’re trading a choppy stock, a shorter lookback (like 5) can help catch quick moves, but it might give more false signals.
spr_threshold = input.float (0.7, "SPR Threshold")
this is the cutoff for SPR to vote for a trade (default 0.7). if SPR’s normalized value is above 0.7, it votes for a long; below -0.7, it votes for a short.
how it works: SPR normalizes its momentum score by ATR, so this threshold ensures only strong moves count. a higher threshold means fewer trades but higher conviction.
how to adjust: if you’re getting too few trades, lower it to 0.5 to let more signals through. if you’re seeing too many false entries, raise it to 1.0 for stricter filtering. test on your chart to find a balance.
spr_atr_length = input.int(21, "SPR ATR Length") this sets the ATR period (default 21 bars) used to normalize SPR’s momentum score. ATR measures volatility, so this makes SPR’s signal relative to market conditions.
how it works: a longer ATR period (like 21) smooths out volatility, making SPR less jumpy. a shorter one makes it more reactive.
how to adjust: if you’re trading a volatile stock like TSLA, a longer period (30 or 50) can help avoid noise. for a calmer stock, try 10 to make SPR more responsive. match this to your timeframe—shorter timeframes might need a shorter ATR.
rth_session = input.session("0930-1600","SPR: RTH Sess.") rth_timezone = "America/New_York" this defines the session SPR uses (0930-1600, New York time). SPR only calculates momentum during these hours to focus on RTH activity.
how it works: it ignores pre-market or after-hours noise, ensuring SPR captures the main market action.
how to adjust: if you trade a different session (like London hours, 0300-1200 EST), change the session to match. you can also adjust the timezone if you’re in a different region, like "Europe/London". just make sure your chart’s timezone aligns with this setting.
VWMO (Volume-Weighted Momentum Oscillator)
VWMO measures momentum weighted by volume to spot sustained, high-conviction moves.
vwmo_momlen = input.int(21, "VWMO Momentum Length") this sets how many bars back VWMO looks to calculate price momentum (default 21 bars). it takes the price change (close minus close 21 bars ago).
how it works: a longer period captures bigger trends, while a shorter one reacts to recent swings.
how to adjust: on a daily chart, 21 bars is about a month—good for trend trading. on a 5-minute chart, it’s just 105 minutes, so you might bump it to 50 or 100 for more meaningful moves. if you want faster signals, drop it to 10, but expect more noise.
vwmo_volback = input.int(30, "VWMO Volume Lookback") this sets the period for calculating average volume (default 30 bars). VWMO weights momentum by volume divided by this average.
how it works: it compares current volume to the average to see if a move has strong participation. a longer lookback smooths the average, while a shorter one makes it more sensitive.
how to adjust: for stocks with spiky volume (like NVDA on earnings), a longer lookback (50 or 100) avoids overreacting to one-off spikes. for steady volume stocks, try 20. match this to your timeframe—shorter timeframes might need a shorter lookback.
vwmo_smooth = input.int(9, "VWMO Smoothing")
this sets the SMA period to smooth VWMO’s raw momentum (default 9 bars).
how it works: smoothing reduces noise in the signal, making VWMO more reliable for voting. a longer smoothing period cuts more noise but adds lag.
how to adjust: if VWMO is too jumpy (lots of false votes), increase to 15. if it’s too slow and missing trades, drop to 5. test on your chart to see what keeps the signal clean but responsive.
vwmo_threshold = input.float(10, "VWMO Threshold") this is the cutoff for VWMO to vote for a trade (default 10). above 10, it votes for a long; below -10, a short.
how it works: it ensures only strong momentum signals count. a higher threshold means fewer but stronger trades.
how to adjust: if you want more trades, lower it to 5. if you’re getting too many weak signals, raise it to 15. this depends on your market—volatile stocks might need a higher threshold to filter noise.
VEI (Velocity Efficiency Index)
VEI measures market efficiency and velocity to filter out choppy moves and focus on strong trends.
vei_eflen = input.int(14, "VEI Efficiency Smoothing") this sets the EMA period for smoothing VEI’s efficiency calc (bar range / volume, default 14 bars).
how it works: efficiency is how much price moves per unit of volume. smoothing it with an EMA reduces noise, focusing on consistent efficiency. a longer period smooths more but adds lag.
how to adjust: for choppy markets, increase to 20 to filter out noise. for faster markets, drop to 10 for quicker signals. this should match your timeframe—shorter timeframes might need a shorter period.
vei_momlen = input.int(8, "VEI Momentum Length") this sets how many bars back VEI looks to calculate momentum in efficiency (default 8 bars).
how it works: it measures the change in smoothed efficiency over 8 bars, then adjusts for inertia (volume-to-range). a longer period captures bigger shifts, while a shorter one reacts faster.
how to adjust: if VEI is missing quick reversals, drop to 5. if it’s too noisy, raise to 12. test on your chart to see what catches the right moves without too many false signals.
vei_threshold = input.float(4.5, "VEI Threshold") this is the cutoff for VEI to vote for a trade (default 4.5). above 4.5, it votes for a long; below -4.5, a short.
how it works: it ensures only strong, efficient moves count. a higher threshold means fewer trades but higher quality.
how to adjust: if you’re not getting enough trades, lower to 3. if you’re seeing too many false entries, raise to 6. this depends on your market—fast stocks like NQ1 might need a lower threshold.
Features
Multi-Signal Voting: requires all three signals (SPR, VWMO, VEI) to align for a trade, ensuring high-probability setups.
Risk Management: uses ATR-based stops (2.1x) and take-profits (4.1x), with dynamic position sizing based on a risk percentage (default 0.4%).
Market Filters: ADX (default 27) ensures trending conditions, choppiness index (default 54.5) avoids sideways markets, and ATR expansion (default 1.12) confirms volatility.
Dashboard: provides real-time stats like SPR, VWMO, VEI values, net P/L, win rate, and streak, with a clean, functional design.
Visuals
EXODUS prioritizes performance over visuals, as it was built for competitive and competition purposes. entry/exit signals are marked with simple labels and shapes, and a basic heatmap highlights market regimes. a more visually stunning update may be released later, with enhanced graphics and overlays.
Usage
EXODUS is designed for stocks and ETFs but can be adapted for futures with adjustments. it performs best in trending markets with sufficient volatility, as confirmed by its generic tuning across symbols like TSLA, AMD, NVDA, and NQ1. adjust inputs like SPR threshold, VWMO smoothing, or VEI momentum length to suit specific assets or timeframes.
Setting I used: (Again, these are a generic setting, each security needs to be fine tuned)
SPR LB = 19 SPR TH = 0.5 SPR ATR L= 21 SPR RTH Sess: 9:30 – 16:00
VWMO L = 21 VWMO LB = 18 VWMO S = 6 VWMO T = 8
VEI ES = 14 VEI ML = 21 VEI T = 4
R % = 0.4
ATR L = 21 ATR M (S) =1.1 TP Multi = 2.1 ATR min mult = 0.8 ATR Expansion = 1.02
ADX L = 21 Min ADX = 25
Choppiness Index = 14 Chop. Max T = 55.5
Backtesting: TSLA
Frame: Jan 02, 2018, 08:00 — May 01, 2025, 09:00
Slippage: 3
Commission .01
Disclaimer
this strategy is for educational purposes. past performance is not indicative of future results. trading involves significant risk, and you should only trade with capital you can afford to lose. always backtest and validate any strategy before using it in live markets.
(This publishing will most likely be taken down do to some miscellaneous rule about properly displaying charting symbols, or whatever. Once I've identified what part of the publishing they want to pick on, I'll adjust and repost.)
About the Author
Dskyz (DAFE) Trading Systems is dedicated to building high-performance trading algorithms. EXODUS is a product of rigorous research and development, aimed at delivering consistent, and data-driven trading solutions.
Use it with discipline. Use it with clarity. Trade smarter.
**I will continue to release incredible strategies and indicators until I turn this into a brand or until someone offers me a contract.
2025 Created by Dskyz, powered by DAFE Trading Systems. Trade smart, trade bold.

Scalping Strategy Signal v2 by [INFINITYTRADER]Overview
This Pine Script (v6) implements a scalping strategy that uses higher timeframe data (default: 4H) to generate entry and exit signals, originally designed for the 15-minute timeframe with an option for 30-minute charts. The "Scalping Strategy Signal v2 by " integrates moving averages, RSI, volume, ATR, and candlestick patterns to identify trading opportunities. It features adjustable risk management with ATR-based stop-loss, take-profit, and trailing stops, plus dynamic position sizing based on user-set capital. Trades trigger only on the higher timeframe candle close (e.g., 4H) to limit activity within the same period. This closed-source script offers a structured scalping approach, blending multiple entry methods and risk controls for adaptability across market conditions.
What Makes It Unique
Unlike typical scalping scripts relying on single-indicator triggers (e.g., RSI alone or basic MA crossovers), this strategy combines four distinct entry methods—standard MA crossovers, RSI-based momentum shifts, trend-following shorts, and candlestick pattern logic—evaluated on a 4H timeframe for confirmation. This multi-layered design, paired with re-entry logic after losses and a mix of manual, ATR-based, and trailing exits, aims to balance trade frequency and reliability. The higher timeframe filter adds precision not commonly found in simpler scalping tools, while the 30-minute option enhances consistency by reducing noise.
How It Works
Timeframe Logic
Runs on a base timeframe (designed for 15-minute charts, with a 30-minute option) while pulling data from a user-chosen higher timeframe (default: 4H) for signal accuracy.
Limits entries to the close of each 4H candle, ensuring one trade per period to avoid over-trading in volatile conditions.
Indicators and Data
Moving Averages : Employs 21-period and 50-period simple moving averages on the higher timeframe to detect trends and signal entries/exits.
Volume : Requires volume to exceed 70% of its 20-period average on the higher timeframe for momentum confirmation.
RSI : Uses a 14-period RSI for overbought/oversold filtering and a 6-period RSI for precise entry timing.
ATR : Applies a 14-period Average True Range on the higher timeframe to set adaptive stop-loss and take-profit levels.
Candlestick Patterns : Analyzes consecutive green or red 4H bars for trend continuation signals.
Why These Indicators
The blend of moving averages, RSI, volume, ATR, and candlestick patterns forms a robust scalping framework. Moving averages establish trend context, RSI filters momentum and avoids extremes, volume confirms market activity, ATR adjusts risk to volatility, and candlestick patterns enhance entry timing with price action insights. Together, they target small, frequent moves in flat or trending markets, with the 4H filter reducing false signals common in lower-timeframe scalping.
Entry Conditions
Four entry methods are evaluated at the 4H candle close:
Standard Long Entry: Price crosses above the 21-period moving average, volume exceeds 70% of its 20-period average, and the 1H 14-period RSI is below 70—confirms uptrend momentum.
Special Long Entry: The 6-period RSI crosses above 23, price is more than 1.5 times the ATR from the 21-period moving average, and price exceeds its prior close—targets oversold bounces with a stop-loss at the 4H candle’s low.
Short Entries:
- RSI-Based: The 6-period RSI crosses below 68 with volume support—catches overbought pullbacks.
- Trend-Based: Price crosses below the 21-period moving average, volume is above 70% of its average, and the 1H 14-period RSI is above 30—confirms downtrends.
Red/Green Bar Logic: Two consecutive green 4H bars for longs or red 4H bars for shorts—uses candlestick patterns for continuation, with a tight stop-loss from the base timeframe candle.
Re-Entry Logic
Long : After a losing special long, triggers when the 6-period RSI crosses 27 and price crosses the 21-period moving average.
Short : After a losing short, triggers when the 6-period RSI crosses 50 and price crosses below the 21-period moving average.
Purpose: Offers recovery opportunities with stricter conditions.
Exit Conditions
Manual Exits: Longs close if the 21-period MA crosses below the 50-period MA or the 1H 14-period RSI exceeds 68; shorts close if the 21-period MA crosses above the 50-period MA or RSI drops below 25.
ATR-Based TP/SL: Stop-loss is entry price ± ATR × 1.5 (default); take-profit is ± ATR × 4 (default), checked at 4H close.
Trailing Stop: Adjusts ±6x ATR from peak/trough, closing if price retraces within 1x ATR.
Special/Tight SL: Special longs exit if price opens below the 4H candle’s low; 4th method entries use the base timeframe candle’s low/high, checked every bar.
Position Sizing
Bases trade value on user-set capital (default: 100 USDT), dividing by the higher timeframe close price for dynamic sizing.
Visualization
Displays a table at the bottom-right with current/previous signals, TP/SL levels, equity, trading pair, and trade size—color-coded for clarity (green for buy, red for sell).
Inputs
Initial Capital (USDT): Sets trade value (default: 100, min: 1).
ATR Stop-Loss Multiplier: Adjusts SL distance (default: 1.5, min: 1).
ATR Take-Profit Multiplier: Adjusts TP distance (default: 4, min: 1).
Higher Timeframe: Selects analysis timeframe (options: 1m, 5m, 15m, 30m, 1H, 4H, D, W; default: 4H).
Usage Notes
Intended Timeframe: Designed for 15-minute charts with 4H confirmation for precision and frequency; 30-minute charts improve consistency by reducing noise.
Backtesting: Adjust ATR multipliers and capital to match your asset’s volatility and risk tolerance.
Risk Management: Combines manual, ATR, and trailing exits—monitor to avoid overexposure.
Limitations: 4H candle-close dependency may delay entries in fast markets; RSI/volume filters can reduce trades in low-momentum periods.
Backtest Observations
Tested on BTC/USDT (4H higher timeframe, default settings: Initial Capital: 100 USDT, ATR SL: 1.5x, ATR TP: 4x) across market conditions, comparing 15-minute and 30-minute charts:
Bull Market (Jul 2023 - Dec 2023):
15-Minute: 277 long, 219 short; Win Rate: 42.74%; P&L: 108%; Drawdown: 1.99%; Profit Factor: 3.074.
30-Minute: 257 long, 215 short; Win Rate: 49.58%; P&L: 116.85%; Drawdown: 2.34%; Profit Factor: 3.14.
Notes: Moving average crossovers and green bar patterns suited this bullish phase; 30-minute improved win rate and P&L by filtering weaker signals.
Bear Market (Jan 2022 - Jun 2022):
15-Minute: 262 long, 211 short; Win Rate: 44.4%; P&L: 239.80%; Drawdown: 3.74%; Profit Factor: 3.419.
30-Minute: 250 long, 200 short; Win Rate: 52.22%; P&L: 258.77%; Drawdown: 5.34%; Profit Factor: 3.461.
Notes: Red bar patterns and RSI shorts thrived in the downtrend; 30-minute cut choppy reversals for better consistency.
Flat Market (Jan 2021 - Jun 2021):
15-Minute: 280 long, 208 short; Win Rate: 51.84%; P&L: 340.33%; Drawdown: 9.59%; Profit Factor: 2.924.
30-Minute: 270 long, 209 short; Win Rate: 55.11%; P&L: 315.42%; Drawdown: 7.21%; Profit Factor: 2.598.
Notes: High trade frequency and P&L showed strength in ranges; 30-minute lowered drawdown for better risk control.
Results reflect historical performance on BTC/USDT with default settings—users should test on their assets and timeframes. Past performance does not guarantee future results and is shared only to illustrate the strategy’s behavior.
Why It Works Well in Flat Markets
A "flat market" lacks strong directional trends, with price oscillating around moving averages, as in Jan 2021 - Jun 2021 for BTC/USDT. This strategy excels here because its crossover-based entries trigger frequently in tight ranges. In trending markets, an exit might not be followed by a new entry without a pullback, but flat markets produce multiple crossovers, enabling more trades. ATR-based TP/SL and trailing stops capture these small swings, while RSI and volume filters ensure momentum, driving high P&L and win rates.
Technical Details
Built in Pine Script v6 for TradingView compatibility.
Prevents overlapping trades with long/short checks.
Handles edge cases like zero division and auto-detects the trading pair’s base currency (e.g., BTC from BTCUSDT).
This strategy suits scalpers seeking structured entries and risk management. Test on 15-minute or 30-minute charts to match your style and market conditions.

RSI Pro+ (Bear market, financial crisis and so on EditionIn markets defined by volatility, fear, and uncertainty – the battlegrounds of bear markets and financial crises – you need tools forged in resilience. Introducing RSI Pro+, a strategy built upon a legendary indicator born in 1978, yet engineered with modern visual clarity to remain devastatingly effective even in the chaotic financial landscapes of 3078.
This isn't about complex algorithms predicting the unpredictable. It's about harnessing the raw, time-tested power of the Relative Strength Index (RSI) to identify potential exhaustion points and capitalize on oversold conditions. RSI Pro+ cuts through the noise, providing clear, actionable signals when markets might be poised for a relief bounce or reversal.
Core Technology (The 1978 Engine):
RSI Crossover Entry: The strategy initiates a LONG position when the RSI (default period 11) crosses above a user-defined low threshold (default 30). This classic technique aims to enter when selling pressure may be waning, offering potential entry points during sharp downturns or periods of consolidation after a fall.
Modern Enhancements (The 3078 Cockpit):
RSI Pro+ isn't just about the signal; it's about providing a professional-grade visual experience directly on your chart:
Entry Bar Highlight: A subtle background flash on the chart signals the exact bar where the RSI crossover condition is met, alerting you to potential entry opportunities.
Trade Bar Coloring: Once a trade is active, the price bars are subtly colored, giving you immediate visual confirmation that the strategy is live in the market.
Entry Price Line: A clear, persistent line marks your exact average entry price for the duration of the trade, serving as a crucial visual anchor.
Take Profit Line: Your calculated Take Profit target is plotted as a distinct line, keeping your objective clearly in sight.
Custom Entry Marker: A precise shape (▲) appears below the bar where the trade entry was actually executed, pinpointing the start of the position.
On-Chart Info Table (HUD): A clean, customizable Heads-Up Display appears when a trade is active, showing vital information at a glance:
Entry Price: Your position's average cost basis.
TP Target: The calculated price level for your Take Profit exit.
Current PnL%: Real-time Profit/Loss percentage for the open trade.
Full Customization: Nearly every aspect is configurable via the settings menu:
RSI Period & Crossover Level
Take Profit Percentage
Toggle ALL visual enhancements on/off individually
Position the Info Table wherever you prefer on the chart.
How to Use RSI Pro+:
Add to Chart: Apply the "RSI Pro+ (Bear market...)" strategy to your TradingView chart. Ensure any previous versions are removed.
Access Settings: Click the cogwheel icon (⚙️) next to the strategy name on your chart.
Configure Inputs (Crucial Step):
RSI Crossover Level: This is key. The default (30) targets standard oversold conditions. In severe downturns, you might experiment with lower levels (e.g., 25, 20) or higher ones (e.g., 40) depending on the asset and timeframe. Observe where RSI(11) typically bottoms out on your chart.
Take Profit Percentage (%): Define your desired profit target per trade (e.g., enter 0.5 for 0.5%, 1.0 for 1%). The default is a very small 0.11%.
RSI Period: While default is 11, you can adjust this (e.g., the standard 14).
Visual Enhancements: Enable or disable the visual features (background highlights, bar coloring, lines, markers, table) according to your preference using the checkboxes. Adjust table position.
Observe & Backtest: Watch how the strategy behaves on your chosen asset and timeframe. Use TradingView's Strategy Tester to analyze historical performance based on your settings. No strategy works perfectly everywhere; testing is essential.
Important Considerations:
Risk Management: This specific script version focuses on a Take Profit exit. It does not include an explicit Stop Loss. You MUST manage risk through appropriate position sizing, potentially adding a Stop Loss manually, or by modifying the script.
Oversold ≠ Reversal: An RSI crossover is an indicator of potential exhaustion, not a guarantee of a price reversal.
Fixed TP: A fixed percentage TP ensures small wins but may exit before larger potential moves.
Backtesting Limitations: Past performance does not guarantee future results.
RSI Pro+ strips away complexity to focus on a robust, time-honored principle, enhanced with modern visuals for the discerning trader navigating today's (and tomorrow's) challenging markets

Sunil High-Frequency Strategy with Simple MACD & RSISunil High-Frequency Strategy with Simple MACD & RSI
This high-frequency trading strategy uses a combination of MACD and RSI to identify quick market opportunities. By leveraging these indicators, combined with dynamic risk management using ATR, it aims to capture small but frequent price movements while ensuring tight control over risk.
Key Features:
Indicators Used:
MACD (Moving Average Convergence Divergence): The strategy uses a shorter MACD configuration (Fast Length of 6 and Slow Length of 12) to capture quick price momentum shifts. A MACD crossover above the signal line triggers a buy signal, while a crossover below the signal line triggers a sell signal.
RSI (Relative Strength Index): A shorter RSI length of 7 is used to gauge overbought and oversold market conditions. The strategy looks for RSI confirmation, with a long trade initiated when RSI is below the overbought level (70) and a short trade initiated when RSI is above the oversold level (30).
Risk Management:
Dynamic Stop Loss and Take Profit: The strategy uses ATR (Average True Range) to calculate dynamic stop loss and take profit levels based on market volatility.
Stop Loss is set at 0.5x ATR to limit risk.
Take Profit is set at 1.5x ATR to capture reasonable price moves.
Trailing Stop: As the market moves in the strategy’s favor, the position is protected by a trailing stop set at 0.5x ATR, allowing the strategy to lock in profits as the price moves further.
Entry & Exit Signals:
Long Entry: Triggered when the MACD crosses above the signal line (bullish crossover) and RSI is below the overbought level (70).
Short Entry: Triggered when the MACD crosses below the signal line (bearish crossover) and RSI is above the oversold level (30).
Exit Conditions: The strategy exits long or short positions based on the stop loss, take profit, or trailing stop activation.
Frequent Trades:
This strategy is designed for high-frequency trading, with trade signals occurring frequently as the MACD and RSI indicators react quickly to price movements. It works best on lower timeframes such as 1-minute, 5-minute, or 15-minute charts, but can be adjusted for different timeframes based on the asset’s volatility.
Customizable Parameters:
MACD Settings: Adjust the Fast Length, Slow Length, and Signal Length to tune the MACD’s sensitivity.
RSI Settings: Customize the RSI Length, Overbought, and Oversold levels to better match your trading style.
ATR Settings: Modify the ATR Length and multipliers for Stop Loss, Take Profit, and Trailing Stop to optimize risk management according to market volatility.
Important Notes:
Market Conditions: This strategy is designed to capture smaller, quicker moves in trending markets. It may not perform well during choppy or sideways markets.
Optimizing for Asset Volatility: Adjust the ATR multipliers based on the asset’s volatility to suit the risk-reward profile that fits your trading goals.
Backtesting: It's recommended to backtest the strategy on different assets and timeframes to ensure optimal performance.
Summary:
The Sunil High-Frequency Strategy leverages a simple combination of MACD and RSI with dynamic risk management (using ATR) to trade small but frequent price movements. The strategy ensures tight stop losses and reasonable take profits, with trailing stops to lock in profits as the price moves in favor of the trade. It is ideal for scalping or intraday trading on lower timeframes, aiming for quick entries and exits with controlled risk.
