Missing Candle AnalyzerMissing Candle Analyzer: Purpose and Importance
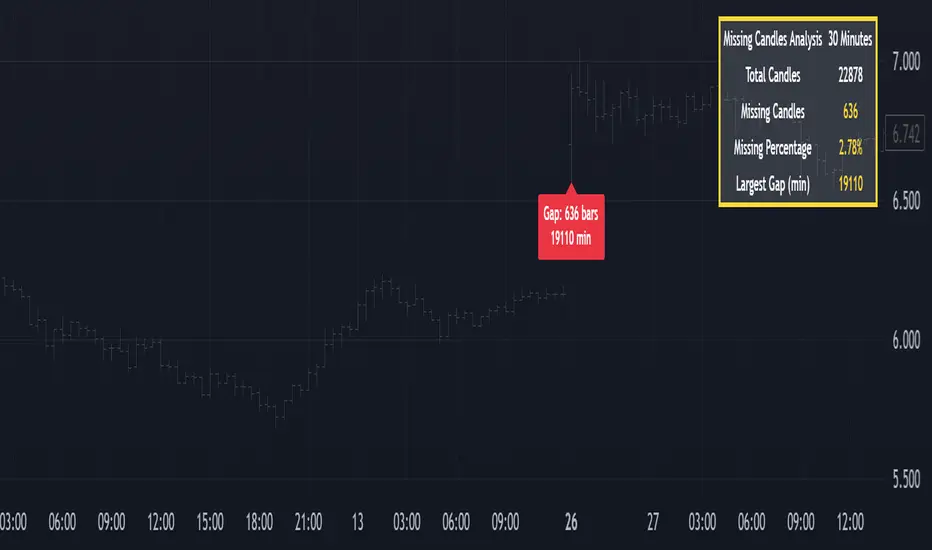
Overview The Missing Candle Analyzer is a Pine Script tool developed to detect and analyze gaps in candlestick data, specifically for cryptocurrency trading. In cryptocurrency markets, it is not uncommon to observe missing candles—time periods where no price data is recorded. These gaps can occur due to low liquidity, exchange downtime, or data feed issues.
Purpose The primary purpose of this tool is to identify missing candles in a given timeframe and provide detailed statistics about these gaps. Missing candles can introduce significant errors in trading strategies, particularly those relying on continuous price data for technical analysis, backtesting, or automated trading. By detecting and quantifying these gaps, traders can: Assess the reliability of the price data. Adjust their strategies to account for incomplete data. Avoid potential miscalculations in indicators or trade signals that assume continuous candlestick data.
Why It Matters In cryptocurrency trading, where volatility is high and trading decisions are often made in real-time, missing candles can lead to: Inaccurate Technical Indicators : Indicators like moving averages, RSI, or MACD may produce misleading signals if candles are missing. Faulty Backtesting : Historical data with gaps can skew backtest results, leading to over-optimistic or unreliable strategy performance. Execution Errors : Automated trading systems may misinterpret gaps, resulting in unintended trades or missed opportunities.
By using the Missing Candle Analyzer, traders gain visibility into the integrity of their data, enabling them to make informed decisions and refine their strategies to handle such anomalies.
Functionality
The script performs the following tasks: Gap Detection : Identifies time gaps between candles that exceed the expected timeframe duration (with a configurable multiplier for tolerance). Statistics Calculation : Tracks total candles, missing candles, missing percentage, and the largest gap duration. Visualization : Displays a table with analysis results and optional markers on the chart to highlight gaps. User Customization : Allows users to adjust font size, table position, and whether to show gap markers.
Conclusion The Missing Candle Analyzer is a critical tool for cryptocurrency traders who need to ensure the accuracy and completeness of their price data. By highlighting missing candles and providing actionable insights, it helps traders mitigate risks and build more robust trading strategies. This tool is especially valuable in the volatile and often unpredictable cryptocurrency market, where data integrity can directly impact trading outcomes.
Wyszukaj w skryptach "backtest"
RSI + MACD + Liquidity FinderLiquidity Finder: The liquidity zones are heuristic and based on volume and swing points. You may need to tweak the volumeThreshold and lookback to match the asset's volatility and timeframe.
Timeframe: This script works on any timeframe, but signals may vary in reliability (e.g., higher timeframes like 4H or 1D may reduce noise).
Customization: You can modify signal conditions (e.g., require only RSI or MACD) or add filters like trend direction using moving averages.
Backtesting: Use TradingView's strategy tester to evaluate performance by converting the indicator to a strategy (replace plotshape with strategy.entry/strategy.close).

QuantumSync Pulse [ w.aritas ]QuantumSync Pulse (QSP) is an advanced technical indicator crafted for traders seeking a dynamic and adaptable tool to analyze diverse market conditions. By integrating momentum, mean reversion, and regime detection with quantum-inspired calculations and entropy analysis, QSP offers a powerful histogram that reflects trend strength and market uncertainty. With multi-timeframe synchronization, adaptive filtering, and customizable visualization, it’s a versatile addition to any trading strategy.
Key Features
Hybrid Signals: Combines momentum and mean reversion, dynamically weighted by market regime.
Quantum Tunneling: Enhances responsiveness in volatile markets using volatility-adjusted calculations.
3-State Entropy: Assesses market uncertainty across up, down, and neutral states.
Regime Detection: Adapts signal weights with Hurst exponent and volatility ROC.
Multi-Timeframe Alignment: Syncs with higher timeframe trends for context.
Customizable Histogram: Displays trend strength with ADX-based visuals and flexible styling.
How to Use and Interpret
Histogram Interpretation
Positive (Above Zero): Bullish momentum; color intensity shows trend strength.
Negative (Below Zero): Bearish momentum; gradients indicate weakness.
Overlaps: Alignment of final_z (signal) and ohlc4 (price) histograms highlights key price levels or turning points.
Regime Visualization
Green Background: Trending market; prioritize momentum signals.
Red Background: Mean-reverting market; focus on reversion signals.
Blue Background: Neutral state; balance both signal types.
Trading Signals
Buy: Histogram crosses above zero or shows positive divergence between histograms.
Sell: Histogram crosses below zero or exhibits negative divergence.
Confirmation: Match signals with regime background—green for trends, red for ranges.
Customization
Tweak Momentum Length, Entropy Lookback, and Hurst Exponent Lookback for sensitivity.
Adjust color themes and transparency to suit your charts.
Tips for Optimal Use
Timeframes: Use higher timeframes (1h, 4h) for trend context and lower (5m, 15m) for entries.
Pairing: Combine with RSI, MACD, or volume indicators for confirmation.
Backtesting: Test settings on historical data for asset-specific optimization.
Overlaps: Watch for histogram overlaps to identify support, resistance, or reversals.
Simulated Performance
Trending Markets: Histogram stays above/below zero, with overlaps at retracements for entries.
Range-Bound Markets: Oscillates around zero; overlaps signal reversals in red regimes.
Volatile Markets: Quantum tunneling ensures quick reactions, with filters reducing noise.
Elevate your trading with QuantumSync Pulse—a sophisticated tool that adapts to the market’s rhythm and your unique style.

Express Generator StrategyExpress Generator Strategy
Pine Script™ v6
The Express Generator Strategy is an algorithmic trading system that harnesses confluence from multiple technical indicators to optimize trade entries and dynamic risk management. Developed in Pine Script v6, it is designed to operate within a user-defined backtesting period—ensuring that trades are executed only during chosen historical windows for targeted analysis.
How It Works:
- Entry Conditions:
The strategy relies on a dual confirmation approach:- A moving average crossover system where a fast (default 9-period SMA) crossing above or below a slower (default 21-period SMA) average signals a potential trend reversal.
- MACD confirmation; trades are only initiated when the MACD line crosses its signal line in the direction of the moving average signal.
- An RSI filter refines these signals by preventing entries when the market might be overextended—ensuring that long entries only occur when the RSI is below an overbought level (default 70) and short entries when above an oversold level (default 30).
- Risk Management & Dynamic Position Sizing:
The strategy takes a calculated approach to risk by enabling the adjustment of position sizes using:- A pre-defined percentage of equity risk per trade (default 1%, adjustable between 0.5% to 3%).
- A stop-loss set in pips (default 100 pips, with customizable ranges), which is then adjusted by market volatility measured through the ATR.
- Trailing stops (default 50 pips) to help protect profits as the market moves favorably.
This combination of volatility-adjusted risk and equity-based position sizing aims to harmonize trade exposure with prevailing market conditions.
- Backtest Period Flexibility:
Users can define the start and end dates for backtesting (e.g., January 1, 2020 to December 31, 2025). This ensures that the strategy only opens trades within the intended analysis window. Moreover, if the strategy is still holding a position outside this period, it automatically closes all trades to prevent unwanted exposure.
- Visual Insights:
For clarity, the strategy plots the fast (blue) and slow (red) moving averages directly on the chart, allowing for visual confirmation of crossovers and trend shifts.
By integrating multiple technical indicators with robust risk management and adaptable position sizing, the Express Generator Strategy provides a comprehensive framework for capturing trending moves while prudently managing downside risk. It’s ideally suited for traders looking to combine systematic entries with a disciplined and dynamic risk approach.

Green*DiamondGreen*Diamond (GD1)
Unleash Dynamic Trading Signals with Volatility and Momentum
Overview
GreenDiamond is a versatile overlay indicator designed for traders seeking actionable buy and sell signals across various markets and timeframes. Combining Volatility Bands (VB) bands, Consolidation Detection, MACD, RSI, and a unique Ribbon Wave, it highlights high-probability setups while filtering out noise. With customizable signals like Green-Yellow Buy, Pullback Sell, and Inverse Pullback Buy, plus vibrant candle and volume visuals, GreenDiamond adapts to your trading style—whether you’re scalping, day trading, or swing trading.
Key Features
Volatility Bands (VB): Plots dynamic upper and lower bands to identify breakouts or reversals, with toggleable buy/sell signals outside consolidation zones.
Consolidation Detection: Marks low-range periods to avoid choppy markets, ensuring signals fire during trending conditions.
MACD Signals: Offers flexible buy/sell conditions (e.g., cross above signal, above zero, histogram up) with RSI divergence integration for precision.
RSI Filter: Enhances signals with customizable levels (midline, oversold/overbought) and bullish divergence detection.
Ribbon Wave: Visualizes trend strength using three EMAs, colored by MACD and RSI for intuitive momentum cues.
Custom Signals: Includes Green-Yellow Buy, Pullback Sell, and Inverse Pullback Buy, with limits on consecutive signals to prevent overtrading.
Candle & Volume Styling: Blends MACD/RSI colors on candles and scales volume bars to highlight momentum spikes.
Alerts: Set up alerts for VB signals, MACD crosses, Green*Diamond signals, and custom conditions to stay on top of opportunities.
How It Works
Green*Diamond integrates multiple indicators to generate signals:
Volatility Bands: Calculates bands using a pivot SMA and standard deviation. Buy signals trigger on crossovers above the lower band, sell signals on crossunders below the upper band (if enabled).
Consolidation Filter: Suppresses signals when candle ranges are below a threshold, keeping you out of flat markets.
MACD & RSI: Combines MACD conditions (e.g., cross above signal) with RSI filters (e.g., above midline) and optional volume spikes for robust signals.
Custom Logic: Green-Yellow Buy uses MACD bullishness, Pullback Sell targets retracements, and Inverse Pullback Buy catches reversals after downmoves—all filtered to avoid consolidation.
Visuals: Ribbon Wave shows trend direction, candles blend momentum colors, and volume bars scale dynamically to confirm signals.
Settings
Volatility Bands Settings:
VB Lookback Period (20): Adjust to 10–15 for faster markets (e.g., 1-minute scalping) or 25–30 for daily charts.
Upper/Lower Band Multiplier (1.0): Increase to 1.5–2.0 for wider bands in volatile stocks like AEHL; decrease to 0.5 for calmer markets.
Show Volatility Bands: Toggle off to reduce chart clutter.
Use VB Signals: Enable for breakout-focused trades; disable to focus on Green*Diamond signals.
Consolidation Settings:
Consolidation Lookback (14): Set to 5–10 for small caps (e.g., AEHL) to catch quick consolidations; 20 for higher timeframes.
Range Threshold (0.5): Lower to 0.3 for stricter filtering in choppy markets; raise to 0.7 for looser signals.
MACD Settings:
Fast/Slow Length (12/26): Shorten to 8/21 for scalping; extend to 15/34 for swing trading.
Signal Smoothing (9): Reduce to 5 for faster signals; increase to 12 for smoother trends.
Buy/Sell Signal Options: Choose “Cross Above Signal” for classic MACD; “Histogram Up” for momentum plays.
Use RSI Div + MACD Cross: Enable for high-probability reversal signals.
RSI Settings:
RSI Period (14): Drop to 10 for 1-minute charts; raise to 20 for daily.
Filter Level (50): Set to 55 for stricter buys; 45 for sells.
Overbought/Oversold (70/30): Tighten to 65/35 for small caps; widen to 75/25 for indices.
RSI Buy/Sell Options: Select “Bullish Divergence” for reversals; “Cross Above Oversold” for momentum.
Color Settings:
Adjust bullish/bearish colors for visibility (e.g., brighter green/red for dark themes).
Border Thickness (1): Increase to 2–3 for clearer candle outlines.
Volume Settings:
Volume Average Length (20): Shorten to 10 for scalping; extend to 30 for swing trades.
Volume Multiplier (2.0): Raise to 3.0 for AEHL’s volume surges; lower to 1.5 for steady stocks.
Bar Height (10%): Increase to 15% for prominent bars; decrease to 5% to reduce clutter.
Ribbon Settings:
EMA Periods (10/20/30): Tighten to 5/10/15 for scalping; widen to 20/40/60 for trends.
Color by MACD/RSI: Disable for simpler visuals; enable for dynamic momentum cues.
Gradient Fill: Toggle on for trend clarity; off for minimalism.
Custom Signals:
Enable Green-Yellow Buy: Use for momentum confirmation; limit to 1–2 signals to avoid spam.
Pullback/Inverse Pullback % (50): Set to 30–40% for small caps; 60–70% for indices.
Max Buy Signals (1): Increase to 2–3 for active markets; keep at 1 for discipline.
Tips and Tricks
Scalping Small Caps (e.g., AEHL):
Use 1-minute charts with VB Lookback = 10, Consolidation Lookback = 5, and Volume Multiplier = 3.0 to catch $0.10–$0.20 moves.
Enable Green-Yellow Buy and Inverse Pullback Buy for quick entries; disable VB Signals to focus on Green*Diamond logic.
Pair with SMC+ green boxes (if you use them) for reversal confirmation.
Day Trading:
Try 5-minute charts with MACD Fast/Slow = 8/21 and RSI Period = 10.
Enable RSI Divergence + MACD Cross for high-probability setups; set Max Buy Signals = 2.
Watch for volume bars turning yellow to confirm entries.
Swing Trading:
Use daily charts with VB Lookback = 30, Ribbon EMAs = 20/40/60.
Enable Pullback Sell (60%) to exit after rallies; disable RSI Color for cleaner candles.
Check Ribbon Wave gradient for trend strength—bright green signals strong bulls.
Avoiding Noise:
Increase Consolidation Threshold to 0.7 on volatile days to skip false breakouts.
Disable Ribbon Wave or Volume Bars if the chart feels crowded.
Limit Max Buy Signals to 1 for disciplined trading.
Alert Setup:
In TradingView’s Alerts panel, select:
“GD Buy Signal” for standard entries.
“RSI Div + MACD Cross Buy” for reversals.
“VB Buy Signal” for breakout plays.
Set to “Once Per Bar Close” for confirmed signals; “Once Per Bar” for scalping.
Backtesting:
Replay on small caps ( Float < 5M, Price $0.50–$5) to test signals.
Focus on “GD Buy Signal” with yellow volume bars and green Ribbon Wave.
Avoid signals during gray consolidation squares unless paired with RSI Divergence.
Usage Notes
Markets: Works on stocks, forex, crypto, and indices. Best for volatile assets (e.g., small-cap stocks, BTCUSD).
Timeframes: Scalping (1–5 minutes), day trading (15–60 minutes), or swing trading (daily). Adjust settings per timeframe.
Risk Management: Combine with stop-losses (e.g., 1% risk, $0.05 below AEHL entry) and take-profits (3–5%).
Customization: Tweak inputs to match your strategy—experiment in replay to find your sweet spot.
Disclaimer
Green*Diamond is a technical tool to assist with trade identification, not a guarantee of profits. Trading involves risks, and past performance doesn’t predict future results. Always conduct your own analysis, manage risk, and test settings before live trading.
Feedback
Love Green*Diamond? Found a killer setup?

EMA & MA Crossover StrategyGuys, you asked, we did. Strategy for crossing moving averages .
The Moving Average Crossover trading strategy is possibly the most popular
trading strategy in the world of trading. First of them were written in the
middle of XX century, when commodities trading strategies became popular.
This strategy is a good example of so-called traditional strategies.
Traditional strategies are always long or short. That means they are never
out of the market. The concept of having a strategy that is always long or
short may be scary, particularly in today’s market where you don’t know what
is going to happen as far as risk on any one market. But a lot of traders
believe that the concept is still valid, especially for those of traders who
do their own research or their own discretionary trading.
This version uses crossover of moving average and its exponential moving average.
Strategy parameters:
Take Profit % - when it receives the opposite signal
Stop Loss % - when it receives the opposite signal
Current Backtest:
Account: 1000$
Trading size: 0.01
Commission: 0.05%
WARNING:
- For purpose educate only
- This script to change bars colors.
Dow Theory Trend StrategyDow Theory Trend Strategy (Pine Script)
Overview
This Pine Script implements a trading strategy based on the core principles of Dow Theory. It visually identifies trends (uptrend, downtrend) by analyzing pivot highs and lows and executes trades when the trend direction changes. This script is an improved version that features refined trend determination logic and strategy implementation.
Core Concept: Dow Theory
The script uses a fundamental Dow Theory concept for trend identification:
Uptrend: Characterized by a series of Higher Highs (HH) and Higher Lows (HL).
Downtrend: Characterized by a series of Lower Highs (LH) and Lower Lows (LL).
How it Works
Pivot Point Detection:
It uses the built-in ta.pivothigh() and ta.pivotlow() functions to identify significant swing points (potential highs and lows) in the price action.
The pivotLookback input determines the number of bars to the left and right required to confirm a pivot. Note that this introduces a natural lag (equal to pivotLookback bars) before a pivot is confirmed.
Improved Trend Determination:
The script stores the last two confirmed pivot highs and the last two confirmed pivot lows.
An Uptrend (trendDirection = 1) is confirmed only when the latest pivot high is higher than the previous one (HH) AND the latest pivot low is higher than the previous one (HL).
A Downtrend (trendDirection = -1) is confirmed only when the latest pivot high is lower than the previous one (LH) AND the latest pivot low is lower than the previous one (LL).
Key Improvement: If neither a clear uptrend nor a clear downtrend is confirmed based on the latest pivots, the script maintains the previous trend state (trendDirection := trendDirection ). This differs from simpler implementations that might switch to a neutral/range state (e.g., trendDirection = 0) more frequently. This approach aims for smoother trend following, acknowledging that trends often persist through periods without immediate new HH/HL or LH/LL confirmations.
Trend Change Detection:
The script monitors changes in the trendDirection variable.
changedToUp becomes true when the trend shifts to an Uptrend (from Downtrend or initial state).
changedToDown becomes true when the trend shifts to a Downtrend (from Uptrend or initial state).
Visualizations
Background Color: The chart background is colored to reflect the currently identified trend:
Blue: Uptrend (trendDirection == 1)
Red: Downtrend (trendDirection == -1)
Gray: Initial state or undetermined (trendDirection == 0)
Pivot Points (Optional): Small triangles (shape.triangledown/shape.triangleup) can be displayed above pivot highs and below pivot lows if showPivotPoints is enabled.
Trend Change Signals (Optional): Labels ("▲ UP" / "▼ DOWN") can be displayed when a trend change is confirmed (changedToUp / changedToDown) if showTrendChange is enabled. These visually mark the potential entry points for the strategy.
Strategy Logic
Entry Conditions:
Enters a long position (strategy.long) using strategy.entry("L", ...) when changedToUp becomes true.
Enters a short position (strategy.short) using strategy.entry("S", ...) when changedToDown becomes true.
Position Management: The script uses strategy.entry(), which automatically handles position reversal. If the strategy is long and a short signal occurs, strategy.entry() will close the long position and open a new short one (and vice-versa).
Inputs
pivotLookback: The number of bars on each side to confirm a pivot high/low. Higher values mean pivots are confirmed later but may be more significant.
showPivotPoints: Toggle visibility of pivot point markers.
showTrendChange: Toggle visibility of the trend change labels ("▲ UP" / "▼ DOWN").
Key Improvements from Original
Smoother Trend Logic: The trend state persists unless a confirmed reversal pattern (opposite HH/HL or LH/LL) occurs, reducing potential whipsaws in choppy markets compared to logic that frequently resets to neutral.
Strategy Implementation: Converted from a pure indicator to a strategy capable of executing backtests and potentially live trades based on the Dow Theory trend changes.
Disclaimer
Dow Theory signals are inherently lagging due to the nature of pivot confirmation.
The effectiveness of the strategy depends heavily on the market conditions and the chosen pivotLookback setting.
This script serves as a basic template. Always perform thorough backtesting and implement proper risk management (e.g., stop-loss, take-profit, position sizing) before considering any live trading.

Dynamic Trend Indicator (DTI) - VWAP FilterThe Dynamic Trend Indicator (DTI) with VWAP Filter is a trend-following indicator.
It aims to identify and follow market trends while minimizing false signals in choppy or ranging markets.
The DTI combines a dynamically adjusted Exponential Moving Average (EMA) with a daily Volume Weighted Average Price (VWAP) confirmation filter and a cooldown mechanism to enhance signal reliability. This indicator is particularly useful for traders on intraday timeframes (e.g., 4-hour charts) who want to align their trades with the broader daily trend while avoiding whipsaws.
Key Features:
Dynamic Trend Line:
The core of the DTI is a trend line calculated using a custom EMA that adjusts its period dynamically based on market conditions.
The period of the EMA is determined by a combination of volatility (measured via ATR) and trend strength (measured via price momentum). In strong trends, the period shortens for faster responsiveness; in weak or ranging markets, it lengthens to reduce noise.
An optional smoothing EMA can be applied to the dynamic trend line to further reduce noise, with a user-defined smoothing length.
Daily VWAP Confirmation Filter:
A daily VWAP is calculated to provide a higher-timeframe trend bias. VWAP represents the average price paid for an asset during the day, weighted by volume, and is often used as a benchmark by institutional traders.
Buy signals are only generated when the price is above the daily VWAP (indicating a bullish daily bias), and sell signals are only generated when the price is below the VWAP (indicating a bearish daily bias).
The VWAP resets at the start of each day, ensuring it reflects the current day’s trading activity.
Cooldown Mechanism:
To prevent rapid signal reversals (whipsaws), the indicator includes a cooldown period between signals. After a buy or sell signal is generated, no new signals can be generated for a user-defined number of bars (default: 5 bars).
This helps filter out noise in choppy markets, ensuring signals are spaced out and more likely to align with significant trend changes.
Visual Elements:
Trend Line: Plotted on the chart, colored green when the price is above (uptrend) and red when below (downtrend). A gray color indicates a neutral trend.
Buy/Sell Signals: Displayed as green triangles below the bar for buy signals and red triangles above the bar for sell signals.
Background Coloring: The chart background is shaded green during uptrends and red during downtrends, providing a quick visual cue of the trend direction.
Daily VWAP Line: Optionally plotted as a purple step line, allowing traders to see the VWAP level and its relationship to the price.
Alerts:
The indicator includes built-in alerts for buy and sell signals, triggered when the price crosses the trend line and satisfies the VWAP filter and cooldown conditions.
Alert messages specify whether the signal is a buy or sell and confirm that the VWAP condition was met (e.g., "DTI Buy Signal: Price crossed above trend line and VWAP").
Input Parameters
Base Length (default: 14): The base period for calculating volatility and trend strength, used to adjust the dynamic EMA period.
Volatility Multiplier (default: 1.5): Adjusts the sensitivity of the dynamic period to market volatility (via ATR).
Trend Threshold (default: 0.5): Controls the sensitivity of the dynamic period to trend strength (via price momentum).
Use Smoothing (default: true): Enables/disables smoothing of the trend line with an additional EMA.
Smoothing Length (default: 3): The period for the smoothing EMA, if enabled.
Cooldown Bars (default: 5): The minimum number of bars between consecutive signals, reducing signal frequency in choppy markets.
Show Daily VWAP (default: true): Toggles the display of the daily VWAP line on the chart.
How It Works
Dynamic Trend Line Calculation:
Volatility is measured using the Average True Range (ATR) over the base length, scaled by the volatility multiplier.
Trend strength is calculated as the absolute price momentum (change in price over the base length) divided by the volatility factor.
The dynamic EMA period is adjusted based on the trend strength: stronger trends result in a shorter period (faster response), while weaker trends result in a longer period (more stability). The period is constrained between 5 and 50 to avoid extreme values.
A custom EMA function is used to handle the dynamic period, as Pine Script’s built-in ta.ema() requires a fixed length. The trend line is optionally smoothed with a secondary EMA.
Signal Generation:
A buy signal is generated when the price crosses above the trend line, the price is above the daily VWAP, and the cooldown period has elapsed.
A sell signal is generated when the price crosses below the trend line, the price is below the daily VWAP, and the cooldown period has elapsed.
The cooldown mechanism ensures that signals are not generated too frequently, reducing false signals in ranging markets.
Daily VWAP Calculation:
The VWAP is calculated by accumulating the price-volume product (close * volume) and total volume for the day, resetting at the start of each new day.
The VWAP is then computed as the cumulative price-volume divided by the cumulative volume, providing a volume-weighted average price for the day.
Usage
Timeframe: Best suited for intraday timeframes (e.g., 1-hour, 4-hour) where the daily VWAP provides a higher-timeframe trend bias. It can also be used on daily charts with adjustments to the cooldown period.
Markets: Works well in trending markets (e.g., forex, crypto, stocks) where the dynamic trend line can capture sustained price movements. The VWAP filter helps align signals with the daily trend, making it effective for assets with clear daily biases.
Trading Strategy:
Buy: Enter a long position when a green triangle (buy signal) appears, indicating the price has crossed above the trend line and is above the daily VWAP.
Sell: Enter a short position (or exit a long) when a red triangle (sell signal) appears, indicating the price has crossed below the trend line and is below the daily VWAP.
Use the trend line and VWAP as dynamic support/resistance levels to set stop-losses or take-profit targets.
Backtesting: Use TradingView’s strategy tester to evaluate the indicator’s performance on your chosen market and timeframe, adjusting parameters like cooldown_bars and volatility_mult to optimize for profitability.
Example
On a 4-hour SOLUSDT chart, the DTI with VWAP Filter might show:
An uptrend with the price above the green trend line and above the daily VWAP, generating buy signals as the price continues to rise.
A downtrend where the price falls below the red trend line and the daily VWAP, generating sell signals that align with the bearish daily bias.
During choppy periods, the cooldown mechanism and VWAP filter reduce false signals, ensuring trades are taken only when the price aligns with the daily trend.
Limitations
Lagging Nature: Like all trend-following indicators, the DTI may lag during sharp price reversals, as the dynamic EMA needs time to adjust.
Ranging Markets: While the VWAP filter and cooldown mechanism reduce whipsaws, the indicator may still generate some false signals in strongly ranging markets. Combining it with a trend strength filter (e.g., ADX) can help.
VWAP Dependency: The effectiveness of the VWAP filter depends on the market’s respect for the daily VWAP as a support/resistance level. In markets with low volume or erratic price action, the VWAP may be less reliable.
Potential Improvements
VWAP Buffer: Add a percentage buffer around the VWAP (e.g., require the price to be 1% above/below) to further reduce noise.
Multi-Timeframe VWAP: Incorporate a weekly VWAP for additional trend confirmation on longer timeframes.
Trend Strength Filter: Add an ADX filter to ensure signals are generated only during strong trends (e.g., ADX > 25).

Nef33-Volume Footprint ApproximationDescription of the "Volume Footprint Approximation" Indicator
Purpose
The "Volume Footprint Approximation" indicator is a tool designed to assist traders in analyzing market volume dynamics and anticipating potential trend changes in price. It is inspired by the concept of a volume footprint chart, which visualizes the distribution of trading volume across different price levels. However, since TradingView does not provide detailed intrabar data for all users, this indicator approximates the behavior of a footprint chart by using available volume and price data (open, close, volume) to classify volume as buy or sell, calculate volume delta, detect imbalances, and generate trend change signals.
The indicator is particularly useful for identifying areas of high buying or selling activity, imbalances between supply and demand, delta divergences, and potential reversal points in the market. It provides specific signals for bullish and bearish trend changes, making it suitable for traders looking to trade reversals or confirm trends.
How It Works
The indicator uses volume and price data from each candlestick to perform the following calculations:
Volume Classification:
Classifies the volume of each candlestick as "buy" or "sell" based on price movement:
If the closing price is higher than the opening price (close > open), the volume is classified as "buy."
If the closing price is lower than the opening price (close < open), the volume is classified as "sell."
If the closing price equals the opening price (close == open), it compares with the previous close to determine the direction:
If the current close is higher than the previous close, it is classified as "buy."
If the current close is lower than the previous close, it is classified as "sell."
If the current close equals the previous close, the classification from the previous bar is used.
Delta Calculation:
Calculates the volume delta as the difference between buy volume and sell volume (buyVolume - sellVolume).
A positive delta indicates more buy volume; a negative delta indicates more sell volume.
Imbalance Detection:
Identifies imbalances between buy and sell volume:
A buy imbalance occurs when buy volume exceeds sell volume by a defined percentage (default is 300%).
A sell imbalance occurs when sell volume exceeds buy volume by the same percentage.
Delta Divergence Detection:
Positive Delta Divergence: Occurs when the price is falling (for at least 2 bars) but the delta is increasing or becomes positive, indicating that buyers are entering despite the price decline.
Negative Delta Divergence: Occurs when the price is rising (for at least 2 bars) but the delta is decreasing or becomes negative, indicating that sellers are entering despite the price increase.
Trend Change Signals:
Bullish Signal (trendChangeBullish): Generated when the following conditions are met:
There is a positive delta divergence.
The delta has moved from a negative value (e.g., -500) to a positive value (e.g., +200) over the last 3 bars.
There is a buy imbalance.
The price is near a historical support level (approximated as the lowest low of the last 50 bars).
Bearish Signal (trendChangeBearish): Generated when the following conditions are met:
There is a negative delta divergence.
The delta has moved from a positive value (e.g., +500) to a negative value (e.g., -200) over the last 3 bars.
There is a sell imbalance.
The price is near a historical resistance level (approximated as the highest high of the last 50 bars).
Visual Elements
The indicator is displayed in a separate panel below the price chart (overlay=false) and includes the following elements:
Volume Histograms:
Buy Volume: Represented by a green histogram. Shows the volume classified as "buy."
Sell Volume: Represented by a red histogram. Shows the volume classified as "sell."
Note: The histograms overlap, and the last plotted histogram (red) takes visual precedence, meaning the sell volume may cover the buy volume if it is larger.
Delta Line:
Delta Volume: Represented by a blue line. Shows the difference between buy and sell volume.
A line above zero indicates more buy volume; a line below zero indicates more sell volume.
A dashed gray horizontal line marks the zero level for easier interpretation.
Imbalance Backgrounds:
Buy Imbalance: Light green background when buy volume exceeds sell volume by the defined percentage.
Sell Imbalance: Light red background when sell volume exceeds buy volume by the defined percentage.
Divergence Backgrounds:
Positive Delta Divergence: Lime green background when a positive delta divergence is detected.
Negative Delta Divergence: Fuchsia background when a negative delta divergence is detected.
Trend Change Signals:
Bullish Signal: Green label with the text "Bullish Trend Change" when the conditions for a bullish trend change are met.
Bearish Signal: Red label with the text "Bearish Trend Change" when the conditions for a bearish trend change are met.
Information Labels:
Below each bar, a label displays:
Total Vol: The total volume of the bar.
Delta: The delta volume value.
Alerts
The indicator generates the following alerts:
Positive Delta Divergence: "Positive Delta Divergence Detected! Price is falling, but delta is increasing."
Negative Delta Divergence: "Negative Delta Divergence Detected! Price is rising, but delta is decreasing."
Bullish Trend Change Signal: "Bullish Trend Change Signal! Positive Delta Divergence, Delta Rise, Buy Imbalance, and Near Support."
Bearish Trend Change Signal: "Bearish Trend Change Signal! Negative Delta Divergence, Delta Drop, Sell Imbalance, and Near Resistance."
These alerts can be configured in TradingView to receive real-time notifications.
Adjustable Parameters
The indicator allows customization of the following parameters:
Imbalance Threshold (%): The percentage required to detect an imbalance between buy and sell volume (default is 300%).
Lookback Period for Divergence: Number of bars to look back for detecting price and delta trends (default is 2 bars).
Support/Resistance Lookback Period: Number of bars to look back for identifying historical support and resistance levels (default is 50 bars).
Delta High Threshold (Bearish): Minimum delta value 2 bars ago for the bearish signal (default is +500).
Delta Low Threshold (Bearish): Maximum delta value in the current bar for the bearish signal (default is -200).
Delta Low Threshold (Bullish): Maximum delta value 2 bars ago for the bullish signal (default is -500).
Delta High Threshold (Bullish): Minimum delta value in the current bar for the bullish signal (default is +200).
Practical Use
The indicator is useful for the following purposes:
Identifying Trend Changes:
The trend change signals (trendChangeBullish and trendChangeBearish) indicate potential price reversals. For example, a bullish signal near a support level may be an opportunity to enter a long position.
Detecting Divergences:
Delta divergences (positive and negative) can anticipate trend changes by showing a disagreement between price movement and underlying buying/selling pressure.
Finding Key Levels:
Imbalances (green and red backgrounds) often coincide with support and resistance levels, helping to identify areas where the market might react.
Confirming Trends:
A consistently positive delta in an uptrend or a negative delta in a downtrend can confirm the strength of the trend.
Identifying Failed Auctions:
Although not detected automatically, you can manually identify failed auctions by observing a price move to new highs/lows with decreasing volume in the direction of the move.
Limitations
Intrabar Data: It does not use detailed intrabar data, making it less precise than a native footprint chart.
Approximations: Volume classification and support/resistance detection are approximations, which may lead to false signals.
Volume Dependency: It requires reliable volume data, so it may be less effective on assets with inaccurate volume data (e.g., some forex pairs).
False Signals: Divergences and imbalances do not always indicate a trend change, especially in strongly trending markets.
Recommendations
Combine with Other Indicators: Use tools like RSI, MACD, support/resistance levels, or candlestick patterns to confirm signals.
Trade on Higher Timeframes: Signals are more reliable on higher timeframes like 1-hour or 4-hour charts.
Perform Backtesting: Evaluate the indicator's accuracy on historical data to adjust parameters and improve effectiveness.
Adjust Parameters: Modify thresholds (e.g., imbalanceThreshold or supportResistanceLookback) based on the asset and timeframe you are trading.
Conclusion
The "Volume Footprint Approximation" indicator is a powerful tool for analyzing volume dynamics and anticipating price trend changes. By classifying volume, calculating delta, detecting imbalances and divergences, and generating trend change signals, it provides traders with valuable insights into market buying and selling pressure. While it has limitations due to the lack of intrabar data, it can be highly effective when used in combination with other technical analysis tools and on assets with reliable volume data.

Adaptive Regression Channel [MissouriTim]The Adaptive Regression Channel (ARC) is a technical indicator designed to empower traders with a clear, adaptable, and precise view of market trends and price boundaries. By blending advanced statistical techniques with real-time market data, ARC delivers a comprehensive tool that dynamically adjusts to price action, volatility, volume, and momentum. Whether you’re navigating the fast-paced world of cryptocurrencies, the steady trends of stocks, or the intricate movements of FOREX pairs, ARC provides a robust framework for identifying opportunities and managing risk.
Core Components
1. Color-Coded Regression Line
ARC’s centerpiece is a linear regression line derived from a Weighted Moving Average (WMA) of closing prices. This line adapts its calculation period based on market volatility (via ATR) and is capped between a minimum of 20 bars and a maximum of 1.5 times the user-defined base length (default 100). Visually, it shifts colors to reflect trend direction: green for an upward slope (bullish) and red for a downward slope (bearish), offering an instant snapshot of market sentiment.
2. Dynamic Residual Channels
Surrounding the regression line are upper (red) and lower (green) channels, calculated using the standard deviation of residuals—the difference between actual closing prices and the regression line. This approach ensures the channels precisely track how closely prices follow the trend, rather than relying solely on overall price volatility. The channel width is dynamically adjusted by a multiplier that factors in:
Volatility: Measured through the Average True Range (ATR), widening channels during turbulent markets.
Trend Strength: Based on the regression slope, expanding channels in strong trends and contracting them in consolidation phases.
3. Volume-Weighted Moving Average (VWMA)
Plotted in orange, the VWMA overlays a volume-weighted price trend, emphasizing movements backed by significant trading activity. This complements the regression line, providing additional confirmation of trend validity and potential breakout strength.
4. Scaled RSI Overlay
ARC features a Relative Strength Index (RSI) overlay, plotted in purple and scaled to hover closely around the regression line. This compact display reflects momentum shifts within the trend’s context, keeping RSI visible on the price chart without excessive swings. User-defined overbought (default 70) and oversold (default 30) levels offer reference points for momentum analysis."
Technical Highlights
ARC leverages a volatility-adjusted lookback period, residual-based channel construction, and multi-indicator integration to achieve high accuracy. Its parameters—such as base length, channel width, ATR period, and RSI length—are fully customizable, allowing traders to tailor it to their specific needs.
Why Choose ARC?
ARC stands out for its adaptability and precision. The residual-based channels offer tighter, more relevant support and resistance levels compared to standard volatility measures, while the dynamic adjustments ensure it performs well in both trending and ranging markets. The inclusion of VWMA and scaled RSI adds depth, merging trend, volume, and momentum into a single, cohesive overlay. For traders seeking a versatile, all-in-one indicator, ARC delivers actionable insights with minimal noise.
Best Ways to Use the Adaptive Regression Channel (ARC)
The Adaptive Regression Channel (ARC) is a flexible tool that supports a variety of trading strategies, from trend-following to breakout detection. Below are the most effective ways to use ARC, along with practical tips for maximizing its potential. Adjustments to its settings may be necessary depending on the timeframe (e.g., intraday vs. daily) and the asset being traded (e.g., stocks, FOREX, cryptocurrencies), as each market exhibits unique volatility and behavior.
1. Trend Following
• How to Use: Rely on the regression line’s color to guide your trades. A green line (upward slope) signals a bullish trend—consider entering or holding long positions. A red line (downward slope) indicates a bearish trend—look to short or exit longs.
• Best Practice: Confirm the trend with the VWMA (orange line). Price above the VWMA in a green uptrend strengthens the bullish case; price below in a red downtrend reinforces bearish momentum.
• Adjustment: For short timeframes like 15-minute crypto charts, lower the Base Regression Length (e.g., to 50) for quicker trend detection. For weekly stock charts, increase it (e.g., to 200) to capture broader movements.
2. Channel-Based Trades
• How to Use: Use the upper channel (red) as resistance and the lower channel (green) as support. Buy when the price bounces off the lower channel in an uptrend, and sell or short when it rejects the upper channel in a downtrend.
• Best Practice: Check the scaled RSI (purple line) for momentum cues. A low RSI (e.g., near 30) at the lower channel suggests a stronger buy signal; a high RSI (e.g., near 70) at the upper channel supports a sell.
• Adjustment: In volatile crypto markets, widen the Base Channel Width Coefficient (e.g., to 2.5) to reduce false signals. For stable FOREX pairs (e.g., EUR/USD), a narrower width (e.g., 1.5) may work better.
3. Breakout Detection
• How to Use: Watch for price breaking above the upper channel (bullish breakout) or below the lower channel (bearish breakout). These moves often signal strong momentum shifts.
• Best Practice: Validate breakouts with VWMA position—price above VWMA for bullish breaks, below for bearish—and ensure the regression line’s slope aligns (green for up, red for down).
• Adjustment: For fast-moving assets like crypto on 1-hour charts, shorten ATR Length (e.g., to 7) to make channels more reactive. For stocks on daily charts, keep it at 14 or higher for reliability.
4. Momentum Analysis
• How to Use: The scaled RSI overlay shows momentum relative to the regression line. Rising RSI in a green uptrend confirms bullish strength; falling RSI in a red downtrend supports bearish pressure.
• Best Practice: Look for RSI divergences—e.g., price hitting new highs at the upper channel while RSI flattens or drops could signal an impending reversal.
• Adjustment: Reduce RSI Length (e.g., to 7) for intraday trading in FOREX or crypto to catch short-term momentum shifts. Increase it (e.g., to 21) for longer-term stock trades.
5. Range Trading
• How to Use: When the regression line’s slope is near zero (flat) and channels are tight, ARC indicates a ranging market. Buy near the lower channel and sell near the upper channel, targeting the regression line as the mean price.
• Best Practice: Ensure VWMA hovers close to the regression line to confirm the range-bound state.
• Adjustment: For low-volatility stocks on daily charts, use a moderate Base Regression Length (e.g., 100) and tight Base Channel Width (e.g., 1.5). For choppy crypto markets, test shorter settings.
Optimization Strategies
• Timeframe Customization: Adjust ARC’s parameters to match your trading horizon. Short timeframes (e.g., 1-minute to 1-hour) benefit from lower Base Regression Length (20–50) and ATR Length (7–10) for agility, while longer timeframes (e.g., daily, weekly) favor higher values (100–200 and 14–21) for stability.
• Asset-Specific Tuning:
○ Stocks: Use longer lengths (e.g., 100–200) and moderate widths (e.g., 1.8) for stable equities; tweak ATR Length based on sector volatility (shorter for tech, longer for utilities).
○ FOREX: Set Base Regression Length to 50–100 and Base Channel Width to 1.5–2.0 for smoother trends; adjust RSI Length (e.g., 10–14) based on pair volatility.
○ Crypto: Opt for shorter lengths (e.g., 20–50) and wider widths (e.g., 2.0–3.0) to handle rapid price swings; use a shorter ATR Length (e.g., 7) for quick adaptation.
• Backtesting: Test ARC on historical data for your asset and timeframe to optimize settings. Evaluate how often price respects channels and whether breakouts yield profitable trades.
• Enhancements: Pair ARC with volume surges, key support/resistance levels, or candlestick patterns (e.g., doji at channel edges) for higher-probability setups.
Practical Considerations
ARC’s adaptability makes it suitable for diverse markets, but its performance hinges on proper calibration. Cryptocurrencies, with their high volatility, may require shorter, wider settings to capture rapid moves, while stocks on longer timeframes benefit from broader, smoother configurations. FOREX pairs often fall in between, depending on their inherent volatility. Experiment with the adjustable parameters to align ARC with your trading style and market conditions, ensuring it delivers the precision and reliability you need.

ETH/USDT EMA Crossover Strategy - OptimizedStrategy Name: EMA Crossover Strategy for ETH/USDT
Description:
This trading strategy is designed for the ETH/USDT pair and is based on exponential moving average (EMA) crossovers combined with momentum and volatility indicators. The strategy uses multiple filters to identify high-probability signals in both bullish and bearish trends, making it suitable for traders looking to trade in trending markets.
Strategy Components
EMAs (Exponential Moving Averages):
EMA 200: Used to identify the primary trend. If the price is above the EMA 200, it is considered a bullish trend; if below, a bearish trend.
EMA 50: Acts as an additional filter to confirm the trend.
EMA 20 and EMA 50 Short: These short-term EMAs generate entry signals through crossovers. A bullish crossover (EMA 20 crosses above EMA 50 Short) is a buy signal, while a bearish crossover (EMA 20 crosses below EMA 50 Short) is a sell signal.
RSI (Relative Strength Index):
The RSI is used to avoid overbought or oversold conditions. Long trades are only taken when the RSI is above 30, and short trades when the RSI is below 70.
ATR (Average True Range):
The ATR is used as a volatility filter. Trades are only taken when there is sufficient volatility, helping to avoid false signals in quiet markets.
Volume:
A volume filter is used to confirm sufficient market participation in the price movement. Trades are only taken when volume is above average.
Strategy Logic
Long Trades:
The price must be above the EMA 200 (bullish trend).
The EMA 20 must cross above the EMA 50 Short.
The RSI must be above 30.
The ATR must indicate sufficient volatility.
Volume must be above average.
Short Trades:
The price must be below the EMA 200 (bearish trend).
The EMA 20 must cross below the EMA 50 Short.
The RSI must be below 70.
The ATR must indicate sufficient volatility.
Volume must be above average.
How to Use the Strategy
Setup:
Add the script to your ETH/USDT chart on TradingView.
Adjust the parameters according to your preferences (e.g., EMA periods, RSI, ATR, etc.).
Signals:
Buy and sell signals will be displayed directly on the chart.
Long trades are indicated with an upward arrow, and short trades with a downward arrow.
Risk Management:
Use stop-loss and take-profit orders in all trades.
Consider a risk-reward ratio of at least 1:2.
Backtesting:
Test the strategy on historical data to evaluate its performance before using it live.
Advantages of the Strategy
Trend-focused: The strategy is designed to trade in trending markets, increasing the probability of success.
Multiple filters: The use of RSI, ATR, and volume reduces false signals.
Adaptability: It can be adjusted for different timeframes, although it is recommended to test it on 5-minute and 15-minute charts for ETH/USDT.
Warnings
Sideways markets: The strategy may generate false signals in markets without a clear trend. It is recommended to avoid trading in such conditions.
Optimization: Make sure to optimize the parameters according to the market and timeframe you are using.
Risk management: Never trade without stop-loss and take-profit orders.
Author
Jose J. Sanchez Cuevas
Version
v1.0

Momentum Volume Divergence (MVD) EnhancedMomentum Volume Divergence (MVD) Enhanced is a powerful indicator that detects price-momentum divergences and momentum suppression for reversal trading. Optimized for XRP on 1D charts, it features dynamic lookbacks, ATR-adjusted thresholds, and SMA confirmation. Signals include strong divergences (triangles) and suppression warnings (crosses). Includes a detailed user guide—try it out and share your feedback!
Setup: Add to XRP 1D chart with defaults (mom_length_base=8, vol_length_base=10). Signals: Red triangle (sell), Green triangle (buy), Orange cross (bear warning), Yellow cross (bull warning). Confirm with 5-day SMA crossovers. See full guide for details!
Disclaimer: This indicator is for educational purposes only, not financial advice. Trading involves risk—use at your discretion.
Momentum Volume Divergence (MVD) Enhanced Indicator User Guide
Version: Pine Script v6
Designed for: TradingView
Recommended Use: XRP on 1-day (1D) chart
Date: March 18, 2025
Author: Herschel with assistance from Grok 3 (xAI)
Overview
The Momentum Volume Divergence (MVD) Enhanced indicator is a powerful tool for identifying price-momentum divergences and momentum suppression patterns on XRP’s 1-day (1D) chart. Plotted below the price chart, it provides clear visual signals to help traders spot potential reversals and trend shifts.
Purpose
Detect divergences between price and momentum for buy/sell opportunities.
Highlight momentum suppression as warnings of fading trends.
Offer actionable trading signals with intuitive markers.
Indicator Components
Main Plot
Volume-Weighted Momentum (vw_mom): Blue line showing momentum adjusted by volume.
Above 0 = bullish momentum.
Below 0 = bearish momentum.
Zero Line: Gray dashed line at 0, separating bullish/bearish zones.
Key Signals
Strong Bearish Divergence:
Marker: Red triangle at the top.
Meaning: Price makes a higher high, but momentum weakens, confirmed by a drop below the 5-day SMA.
Action: Potential sell/short signal.
Strong Bullish Divergence:
Marker: Green triangle at the bottom.
Meaning: Price makes a lower low, but momentum strengthens, confirmed by a rise above the 5-day SMA.
Action: Potential buy/long signal.
Bearish Suppression:
Marker: Orange cross at the top + red background.
Meaning: Strong bullish momentum with low volume in a volume downtrend, suggesting fading strength.
Action: Warning to avoid longs or exit early.
Bullish Suppression:
Marker: Yellow cross at the bottom + green background.
Meaning: Strong bearish momentum with low volume in a volume uptrend, suggesting fading weakness.
Action: Warning to avoid shorts or exit early.
Debug Plots (Optional)
Volume Ratio: Gray line (volume vs. its MA) vs. yellow line (threshold).
Momentum Threshold: Purple lines (positive/negative momentum cutoffs).
Smoothed Momentum: Orange line (raw momentum).
Confirmation SMA: Purple line (price trend confirmation).
Labels
Text labels (e.g., "Bear Div," "Bull Supp") mark detected patterns.
How to Use the Indicator
Step-by-Step Trading Process
1. Monitor the Chart
Load your XRP 1D chart with the indicator applied.
Observe the blue vw_mom line and signal markers.
2. Spot a Signal
Primary Signals: Look for red triangles (strong_bear) or green triangles (strong_bull).
Warnings: Note orange crosses (suppression_bear) or yellow crosses (suppression_bull).
3. Confirm the Signal
For Strong Bullish Divergence (Buy):
Green triangle appears.
Price closes above the 5-day SMA (purple line) and a recent swing high.
Optional: Volume ratio (gray line) exceeds the threshold (yellow line).
For Strong Bearish Divergence (Sell):
Red triangle appears.
Price closes below the 5-day SMA and a recent swing low.
Optional: Volume ratio (gray line) falls below the threshold (yellow line).
4. Enter the Trade
Long:
Buy at the close of the signal bar.
Stop loss: Below the recent swing low or 2 × ATR(14) below entry.
Short:
Sell/short at the close of the signal bar.
Stop loss: Above the recent swing high or 2 × ATR(14) above entry.
5. Manage the Trade
Take Profit:
Aim for a 2:1 or 3:1 risk-reward ratio (e.g., risk $0.05, target $0.10-$0.15).
Or exit when an opposite suppression signal appears (e.g., orange cross for longs).
Trailing Stop:
Move stop to breakeven after a 1:1 RR move.
Trail using the 5-day SMA or 2 × ATR(14).
Early Exit:
Exit if a suppression signal appears against your position (e.g., suppression_bull while short).
6. Filter Out Noise
Avoid trades if a suppression signal precedes a divergence within 2-3 days.
Optional: Add a 50-day SMA on the price chart:
Longs only if price > 50-SMA.
Shorts only if price < 50-SMA.
Example Trades (XRP 1D)
Bullish Trade
Signal: Green triangle (strong_bull) at $0.55.
Confirmation: Price closes above 5-SMA and $0.57 high.
Entry: Buy at $0.58.
Stop Loss: $0.53 (recent low).
Take Profit: $0.63 (2:1 RR) or exit on suppression_bear.
Outcome: Price hits $0.64, exit at $0.63 for profit.
Bearish Trade
Signal: Red triangle (strong_bear) at $0.70.
Confirmation: Price closes below 5-SMA and $0.68 low.
Entry: Short at $0.67.
Stop Loss: $0.71 (recent high).
Take Profit: $0.62 (2:1 RR) or exit on suppression_bull.
Outcome: Price drops to $0.61, exit at $0.62 for profit.
Tips for Success
Combine with Price Levels:
Use support/resistance zones (e.g., weekly pivots) to confirm entries.
Monitor Volume:
Rising volume (gray line above yellow) strengthens signals.
Adjust Sensitivity:
Too many signals? Increase div_strength_threshold to 0.7.
Too few signals? Decrease to 0.3.
Backtest:
Review 20-30 past signals on XRP 1D to assess performance.
Avoid Choppy Markets:
Skip signals during low volatility (tight price ranges).
Troubleshooting
No Signals:
Lower div_strength_threshold to 0.3 or mom_threshold_base to 0.2.
Check if XRP’s volatility is unusually low.
False Signals:
Increase sma_confirm_length to 7 or add a 50-SMA filter.
Indicator Not Loading:
Ensure the script compiles without errors.
Customization (Optional)
Change Colors: Edit color.* values (e.g., color.red to color.purple).
Add Alerts: Use TradingView’s alert menu for "Strong Bearish Divergence Confirmed," etc.
Test Other Assets: Experiment with BTC or ETH, adjusting inputs as needed.
Disclaimer
This indicator is for educational purposes only and not financial advice. Trading involves risk, and past performance does not guarantee future results. Use at your own discretion.
Setup: Use on XRP 1D with defaults (mom_length_base=8, vol_length_base=10). Signals: Red triangle (sell), Green triangle (buy), Orange cross (bear warning), Yellow cross (bull warning). Confirm with 5-day SMA cross. Stop: 2x ATR(14). Profit: 2:1 RR or suppression exit. Full guide available separately!

RSI + Stochastic + WMA StrategyThis script is designed for TradingView and serves as a trading strategy (not just a visual indicator). It's intended for backtesting, strategy optimization, or live trading signal generation using a combination of popular technical indicators.
📊 Indicators Used in the Strategy:
Indicator Description
RSI (Relative Strength Index) Measures momentum; identifies overbought (>70) or oversold (<30) conditions.
Stochastic Oscillator (%K & %D) Detects momentum reversal points via crossovers. Useful for timing entries.
WMA (Weighted Moving Average) Identifies the trend direction (used as a trend filter).
📈 Trading Logic / Strategy Rules:
📌 Long Entry Condition (Buy Signal):
All 3 conditions must be true:
RSI is Oversold → RSI < 30
Stochastic Crossover Upward → %K crosses above %D
Price is above WMA → Confirms uptrend direction
👉 Interpretation: Market was oversold, momentum is turning up, and price confirms uptrend — bullish entry.
📌 Short Entry Condition (Sell Signal):
All 3 conditions must be true:
RSI is Overbought → RSI > 70
Stochastic Crossover Downward → %K crosses below %D
Price is below WMA → Confirms downtrend direction
👉 Interpretation: Market is overbought, momentum is turning down, and price confirms downtrend — bearish entry.
🔄 Strategy Execution (Backtesting Logic):
The script uses:
pinescript
Copy
Edit
strategy.entry("LONG", strategy.long)
strategy.entry("SHORT", strategy.short)
These are Pine Script functions to place buy and sell orders automatically when the above conditions are met. This allows you to:
Backtest the strategy
Measure win/loss ratio, drawdown, and profitability
Optimize indicator settings using TradingView Strategy Tester
📊 Visual Aids (Charts):
Plots WMA Line: Orange line for trend direction
Overbought/Oversold Zones: Horizontal lines at 70 (red) and 30 (green) for RSI visualization
⚡ Strategy Type Summary:
Category Setting
Strategy Type Momentum Reversal + Trend Filter
Timeframe Flexible (Works best on 1H, 4H, Daily)
Trading Style Swing/Intraday
Risk Profile Medium to High (due to momentum triggers)
Uses Leverage Possible (adjust risk accordingly)

Mogwai Method with RSI and EMA - BTCUSD 15mThis is a custom TradingView indicator designed for trading Bitcoin (BTCUSD) on a 15-minute timeframe. It’s based on the Mogwai Method—a mean-reversion strategy—enhanced with the Relative Strength Index (RSI) for momentum confirmation. The indicator generates buy and sell signals, visualized as green and red triangle arrows on the chart, to help identify potential entry and exit points in the volatile cryptocurrency market.
Components
Bollinger Bands (BB):
Purpose: Identifies overextended price movements, signaling potential reversions to the mean.
Parameters:
Length: 20 periods (standard for mean-reversion).
Multiplier: 2.2 (slightly wider than the default 2.0 to suit BTCUSD’s volatility).
Role:
Buy signal when price drops below the lower band (oversold).
Sell signal when price rises above the upper band (overbought).
Relative Strength Index (RSI):
Purpose: Confirms momentum to filter out false signals from Bollinger Bands.
Parameters:
Length: 14 periods (classic setting, effective for crypto).
Overbought Level: 70 (price may be overextended upward).
Oversold Level: 30 (price may be overextended downward).
Role:
Buy signal requires RSI < 30 (oversold).
Sell signal requires RSI > 70 (overbought).
Exponential Moving Averages (EMAs) (Plotted but not currently in signal logic):
Purpose: Provides trend context (included in the script for visualization, optional for signal filtering).
Parameters:
Fast EMA: 9 periods (short-term trend).
Slow EMA: 50 periods (longer-term trend).
Role: Can be re-added to filter signals (e.g., buy only when Fast EMA > Slow EMA).
Signals (Triangles):
Buy Signal: Green upward triangle below the bar when price is below the lower Bollinger Band and RSI is below 30.
Sell Signal: Red downward triangle above the bar when price is above the upper Bollinger Band and RSI is above 70.
How It Works
The indicator combines Bollinger Bands and RSI to spot mean-reversion opportunities:
Buy Condition: Price breaks below the lower Bollinger Band (indicating oversold conditions), and RSI confirms this with a reading below 30.
Sell Condition: Price breaks above the upper Bollinger Band (indicating overbought conditions), and RSI confirms this with a reading above 70.
The strategy assumes that extreme price movements in BTCUSD will often revert to the mean, especially in choppy or ranging markets.
Visual Elements
Green Upward Triangles: Appear below the candlestick to indicate a buy signal.
Red Downward Triangles: Appear above the candlestick to indicate a sell signal.
Bollinger Bands: Gray lines (upper, middle, lower) plotted for reference.
EMAs: Blue (Fast) and Orange (Slow) lines for trend visualization.
How to Use the Indicator
Setup
Open TradingView:
Log into TradingView and select a BTCUSD chart from a supported exchange (e.g., Binance, Coinbase, Bitfinex).
Set Timeframe:
Switch the chart to a 15-minute timeframe (15m).
Add the Indicator:
Open the Pine Editor (bottom panel in TradingView).
Copy and paste the script provided.
Click “Add to Chart” to apply it.
Verify Display:
You should see Bollinger Bands (gray), Fast EMA (blue), Slow EMA (orange), and buy/sell triangles when conditions are met.
Trading Guidelines
Buy Signal (Green Triangle Below Bar):
What It Means: Price is oversold, potentially ready to bounce back toward the Bollinger Band middle line.
Action:
Enter a long position (buy BTCUSD).
Set a take-profit near the middle Bollinger Band (bb_middle) or a resistance level.
Place a stop-loss 1-2% below the entry (or based on ATR, e.g., ta.atr(14) * 2).
Best Context: Works well in ranging markets; avoid during strong downtrends.
Sell Signal (Red Triangle Above Bar):
What It Means: Price is overbought, potentially ready to drop back toward the middle line.
Action:
Enter a short position (sell BTCUSD) or exit a long position.
Set a take-profit near the middle Bollinger Band or a support level.
Place a stop-loss 1-2% above the entry.
Best Context: Effective in ranging markets; avoid during strong uptrends.
Trend Filter (Optional):
To reduce false signals in trending markets, you can modify the script:
Add and ema_fast > ema_slow to the buy condition (only buy in uptrends).
Add and ema_fast < ema_slow to the sell condition (only sell in downtrends).
Check the Fast EMA (blue) vs. Slow EMA (orange) alignment visually.
Tips for BTCUSD on 15-Minute Charts
Volatility: BTCUSD can be erratic. If signals are too frequent, increase bb_mult (e.g., to 2.5) or adjust RSI levels (e.g., 75/25).
Confirmation: Use volume spikes or candlestick patterns (e.g., doji, engulfing) to confirm signals.
Time of Day: Mean-reversion works best during low-volume periods (e.g., Asian session in crypto).
Backtesting: Use TradingView’s Strategy Tester (convert to a strategy by adding entry/exit logic) to evaluate performance with historical BTCUSD data up to March 13, 2025.
Risk Management
Position Size: Risk no more than 1-2% of your account per trade.
Stop Losses: Always use stops to protect against BTCUSD’s sudden moves.
Avoid Overtrading: Wait for clear signals; don’t force trades in choppy or unclear conditions.
Example Scenario
Chart: BTCUSD, 15-minute timeframe.
Buy Signal: Price drops to $58,000, below the lower Bollinger Band, RSI at 28. A green triangle appears.
Action: Buy at $58,000, target $59,000 (middle BB), stop at $57,500.
Sell Signal: Price rises to $60,500, above the upper Bollinger Band, RSI at 72. A red triangle appears.
Action: Sell at $60,500, target $59,500 (middle BB), stop at $61,000.
This indicator is tailored for mean-reversion trading on BTCUSD. Let me know if you’d like to tweak it further (e.g., add filters, alerts, or alternative indicators)!

Strategy SuperTrend SDI WebhookThis Pine Script™ strategy is designed for automated trading in TradingView. It combines the SuperTrend indicator and Smoothed Directional Indicator (SDI) to generate buy and sell signals, with additional risk management features like stop loss, take profit, and trailing stop. The script also includes settings for leverage trading, equity-based position sizing, and webhook integration.
Key Features
1. Date-based Trade Execution
The strategy is active only between the start and end dates set by the user.
times ensures that trades occur only within this predefined time range.
2. Position Sizing and Leverage
Uses leverage trading to adjust position size dynamically based on initial equity.
The user can set leverage (leverage) and percentage of equity (usdprcnt).
The position size is calculated dynamically (initial_capital) based on account performance.
3. Take Profit, Stop Loss, and Trailing Stop
Take Profit (tp): Defines the target profit percentage.
Stop Loss (sl): Defines the maximum allowable loss per trade.
Trailing Stop (tr): Adjusts dynamically based on trade performance to lock in profits.
4. SuperTrend Indicator
SuperTrend (ta.supertrend) is used to determine the market trend.
If the price is above the SuperTrend line, it indicates an uptrend (bullish).
If the price is below the SuperTrend line, it signals a downtrend (bearish).
Plots visual indicators (green/red lines and circles) to show trend changes.
5. Smoothed Directional Indicator (SDI)
SDI helps to identify trend strength and momentum.
It calculates +DI (bullish strength) and -DI (bearish strength).
If +DI is higher than -DI, the market is considered bullish.
If -DI is higher than +DI, the market is considered bearish.
The background color changes based on the SDI signal.
6. Buy & Sell Conditions
Long Entry (Buy) Conditions:
SDI confirms an uptrend (+DI > -DI).
SuperTrend confirms an uptrend (price crosses above the SuperTrend line).
Short Entry (Sell) Conditions:
SDI confirms a downtrend (+DI < -DI).
SuperTrend confirms a downtrend (price crosses below the SuperTrend line).
Optionally, trades can be filtered using crossovers (occrs option).
7. Trade Execution and Exits
Market entries:
Long (strategy.entry("Long")) when conditions match.
Short (strategy.entry("Short")) when bearish conditions are met.
Trade exits:
Uses predefined take profit, stop loss, and trailing stop levels.
Positions are closed if the strategy is out of the valid time range.
Usage
Automated Trading Strategy:
Can be integrated with webhooks for automated execution on supported trading platforms.
Trend-Following Strategy:
Uses SuperTrend & SDI to identify trend direction and strength.
Risk-Managed Leverage Trading:
Supports position sizing, stop losses, and trailing stops.
Backtesting & Optimization:
Can be used for historical performance analysis before deploying live.
Conclusion
This strategy is suitable for traders who want to automate their trading using SuperTrend and SDI indicators. It incorporates risk management tools like stop loss, take profit, and trailing stop, making it adaptable for leverage trading. Traders can customize settings, conduct backtests, and integrate it with webhooks for real-time trade execution. 🚀
Important Note:
This script is provided for educational and template purposes and does not constitute financial advice. Traders and investors should conduct their research and analysis before making any trading decisions.

SMA Strategy Builder: Create & Prove Profitability📄 Pine Script Strategy Description (For Publishing on TradingView)
🎯 Strategy Title:
SMA Strategy Builder: Create & Prove Profitability
✨ Description:
This tool is designed for traders who want to build, customize, and prove their own SMA-based trading strategies. The strategy tracks capital growth in real-time, providing clear evidence of profitability after each trade. Users can adjust key parameters such as SMA period, take profit levels, and initial capital, making it a flexible solution for backtesting and strategy validation.
🔍 Key Features:
✅ SMA-Based Logic:
Core trading logic revolves around the Simple Moving Average (SMA).
SMA period is fully adjustable to suit various trading styles.
🎯 Customizable Take Profit (TP):
User-defined TP percentages per position.
TP line displayed as a Step Line with Breaks for clear segmentation.
Visual 🎯TP label for quick identification of profit targets.
💵 Capital Tracking (Proof of Profitability):
Initial capital is user-defined.
Capital balance updates after each closed trade.
Shows both absolute profit/loss and percentage changes for every position.
Darker green profit labels for better readability and dark red for losses.
📈 Capital Curve (Performance Visualization):
Capital growth curve available (hidden by default, can be enabled via settings).
📏 Dynamic Label Positioning:
Label positions adjust dynamically based on the price range.
Ensures consistent visibility across low and high-priced assets.
⚡ How It Works:
Long Entry:
Triggered when the price crosses above the SMA.
TP level is calculated as a user-defined percentage above the entry price.
Short Entry:
Triggered when the price crosses below the SMA.
TP level is calculated as a user-defined percentage below the entry price.
TP Execution:
Positions close immediately once the TP level is reached (no candle close confirmation needed).
🔔 Alerts:
🟩 Long Signal Alert: When the price crosses above the SMA.
🟥 Short Signal Alert: When the price crosses below the SMA.
🎯 TP Alert: When the TP target is reached.
⚙️ Customization Options:
📅 SMA Period: Choose the moving average period that best fits your strategy.
🎯 Take Profit (%): Adjust TP percentages for flexible risk management.
💵 Initial Capital: Set the starting capital for realistic backtesting.
📈 Capital Curve Toggle: Enable or disable the capital curve to track overall performance.
🌟 Why Use This Tool?
🔧 Flexible Strategy Creation: Adjust core parameters and create tailored SMA-based strategies.
📈 Performance Proof: Capital tracking acts as real proof of profitability after each trade.
🎯 Immediate TP Execution: No waiting for candle closures; profits lock in as soon as targets are hit.
💹 Comprehensive Performance Insights: Percentage-based and absolute capital tracking with dynamic visualization.
🏦 Clean Visual Indicators: Strategy insights made clear with dynamic labeling and adjustable visuals.
⚠️ Disclaimer:
This script is provided for educational and informational purposes only. Trading financial instruments carries risk, and past performance does not guarantee future results. Always perform your own due diligence before making any trading decisions.

Money Flow Indicator (Chaikin Oscillator) with VWAPStrategy Overview
Entry Conditions:
Buy Entry:
The Chaikin Oscillator crosses above the signal line.
The current price is above the VWAP.
Sell Entry:
The Chaikin Oscillator crosses below the signal line.
The current price is below the VWAP.
Exit Conditions:
Profit Taking:
Take profit when a target profit is reached (e.g., a 2% increase from the entry price).
Stop Loss:
Set a stop loss, for example, at a 1% decline from the entry price.
Risk Management:
Manage risk by limiting each trade to no more than 1-2% of the account balance.
Calculate position size based on risk and trade accordingly.
Trend Confirmation:
Use other indicators (like moving averages) to confirm the overall trend and focus trades in the direction of the trend.
In an uptrend, prioritize buy entries; in a downtrend, prioritize sell entries.
Specific Trade Scenarios
Example 1: Buy Entry:
Enter a buy position when the Chaikin Oscillator crosses above the signal line and the price is above the VWAP.
Set a stop loss 1% below the entry price and a profit target 2% above the entry price.
Example 2: Sell Entry:
Enter a sell position when the Chaikin Oscillator crosses below the signal line and the price is below the VWAP.
Set a stop loss 1% above the entry price and a profit target 2% below the entry price.
Additional Considerations
Backtesting: Test this strategy with historical data to evaluate performance and make adjustments as needed.
Market Conditions: Pay attention to market volatility and economic indicators, adjusting the trading strategy flexibly.
Psychological Factors: Avoid emotional decisions and follow clear rules when trading.

Enhanced Bollinger Bands Strategy with SL/TP// Title: Enhanced Bollinger Bands Strategy with SL/TP
// Description:
// This strategy is based on the classic Bollinger Bands indicator and incorporates Stop Loss (SL) and Take Profit (TP) levels for automated trading. It identifies potential long and short entry points based on price crossing the lower and upper Bollinger Bands, respectively. The strategy allows users to customize several parameters to suit different market conditions and risk tolerances.
// Key Features:
// * **Bollinger Bands:** Uses Simple Moving Average (SMA) as the basis and calculates upper and lower bands based on a user-defined standard deviation multiplier.
// * **Customizable Parameters:** Offers extensive customization, including SMA length, standard deviation multiplier, Stop Loss (SL) in pips, and Take Profit (TP) in pips.
// * **Long/Short Position Control:** Allows users to independently enable or disable long and short positions.
// * **Stop Loss and Take Profit:** Implements Stop Loss and Take Profit levels based on pip values to manage risk and secure profits. Entry prices are set to the band levels on signals.
// * **Visualizations:** Provides options to display Bollinger Bands and entry signals on the chart for easy analysis.
// Strategy Logic:
// 1. **Bollinger Bands Calculation:** The strategy calculates the Bollinger Bands using the specified SMA length and standard deviation multiplier.
// 2. **Entry Conditions:**
// * **Long Entry:** Enters a long position when the closing price crosses above the lower Bollinger Band and the `Enable Long Positions` setting is enabled.
// * **Short Entry:** Enters a short position when the closing price crosses below the upper Bollinger Band and the `Enable Short Positions` setting is enabled.
// 3. **Exit Conditions:**
// * **Stop Loss:** Exits the position if the price reaches the Stop Loss level, calculated based on the input `Stop Loss (Pips)`.
// * **Take Profit:** Exits the position if the price reaches the Take Profit level, calculated based on the input `Take Profit (Pips)`.
// Input Parameters:
// * **SMA Length (length):** The length of the Simple Moving Average used to calculate the Bollinger Bands (default: 20).
// * **Standard Deviation Multiplier (mult):** The multiplier applied to the standard deviation to determine the width of the Bollinger Bands (default: 2.0).
// * **Enable Long Positions (enableLong):** A boolean value to enable or disable long positions (default: true).
// * **Enable Short Positions (enableShort):** A boolean value to enable or disable short positions (default: true).
// * **Pip Value (pipValue):** The value of a pip for the traded instrument. This is crucial for accurate Stop Loss and Take Profit calculations (default: 0.0001 for most currency pairs). **Important: Adjust this value to match the specific instrument you are trading.**
// * **Stop Loss (Pips) (slPips):** The Stop Loss level in pips (default: 10).
// * **Take Profit (Pips) (tpPips):** The Take Profit level in pips (default: 20).
// * **Show Bollinger Bands (showBands):** A boolean value to show or hide the Bollinger Bands on the chart (default: true).
// * **Show Entry Signals (showSignals):** A boolean value to show or hide entry signals on the chart (default: true).
// How to Use:
// 1. Add the strategy to your TradingView chart.
// 2. Adjust the input parameters to optimize the strategy for your chosen instrument and timeframe. Pay close attention to the `Pip Value`.
// 3. Backtest the strategy over different periods to evaluate its performance.
// 4. Use the `Enable Long Positions` and `Enable Short Positions` settings to customize the strategy for specific market conditions (e.g., only long positions in an uptrend).
// Important Notes and Disclaimers:
// * **Backtesting Results:** Past performance is not indicative of future results. Backtesting results can be affected by various factors, including market volatility, slippage, and transaction costs.
// * **Risk Management:** This strategy is provided for informational and educational purposes only and should not be considered financial advice. Always use proper risk management techniques when trading. Adjust Stop Loss and Take Profit levels according to your risk tolerance.
// * **Slippage:** The strategy takes into account slippage by specifying a slippage parameter on the `strategy` declaration. However, real-world slippage may vary.
// * **Market Conditions:** The performance of this strategy can vary significantly depending on market conditions. It may perform well in trending markets but poorly in ranging or choppy markets.
// * **Pip Value Accuracy:** **Ensure the `Pip Value` is correctly set for the specific instrument you are trading. Incorrect pip value will result in incorrect stop loss and take profit placement.** This is critical.
// * **Broker Compatibility:** The strategy's performance may vary depending on your broker's execution policies and fees.
// * **Disclaimer:** I am not a financial advisor, and this script is not financial advice. Use this strategy at your own risk. I am not responsible for any losses incurred while using this strategy.

BTC Future Gamma-Weighted Momentum Model (BGMM)The BTC Future Gamma-Weighted Momentum Model (BGMM) is a quantitative trading strategy that utilizes the Gamma-weighted average price (GWAP) in conjunction with a momentum-based approach to predict price movements in the Bitcoin futures market. The model combines the concept of weighted price movements with trend identification, where the Gamma factor amplifies the weight assigned to recent prices. It leverages the idea that historical price trends and weighting mechanisms can be utilized to forecast future price behavior.
Theoretical Background:
1. Momentum in Financial Markets:
Momentum is a well-established concept in financial market theory, referring to the tendency of assets to continue moving in the same direction after initiating a trend. Any observed market return over a given time period is likely to continue in the same direction, a phenomenon known as the “momentum effect.” Deviations from a mean or trend provide potential trading opportunities, particularly in highly volatile assets like Bitcoin.
Numerous empirical studies have demonstrated that momentum strategies, based on price movements, especially those correlating long-term and short-term trends, can yield significant returns (Jegadeesh & Titman, 1993). Given Bitcoin’s volatile nature, it is an ideal candidate for momentum-based strategies.
2. Gamma-Weighted Price Strategies:
Gamma weighting is an advanced method of applying weights to price data, where past price movements are weighted by a Gamma factor. This weighting allows for the reinforcement or reduction of the influence of historical prices based on an exponential function. The Gamma factor (ranging from 0.5 to 1.5) controls how much emphasis is placed on recent data: a value closer to 1 applies an even weighting across periods, while a value closer to 0 diminishes the influence of past prices.
Gamma-based models are used in financial analysis and modeling to enhance a model’s adaptability to changing market dynamics. This weighting mechanism is particularly advantageous in volatile markets such as Bitcoin futures, as it facilitates quick adaptation to changing market conditions (Black-Scholes, 1973).
Strategy Mechanism:
The BTC Future Gamma-Weighted Momentum Model (BGMM) utilizes an adaptive weighting strategy, where the Bitcoin futures prices are weighted according to the Gamma factor to calculate the Gamma-Weighted Average Price (GWAP). The GWAP is derived as a weighted average of prices over a specific number of periods, with more weight assigned to recent periods. The calculated GWAP serves as a reference value, and trading decisions are based on whether the current market price is above or below this level.
1. Long Position Conditions:
A long position is initiated when the Bitcoin price is above the GWAP and a positive price movement is observed over the last three periods. This indicates that an upward trend is in place, and the market is likely to continue in the direction of the momentum.
2. Short Position Conditions:
A short position is initiated when the Bitcoin price is below the GWAP and a negative price movement is observed over the last three periods. This suggests that a downtrend is occurring, and a continuation of the negative price movement is expected.
Backtesting and Application to Bitcoin Futures:
The model has been tested exclusively on the Bitcoin futures market due to Bitcoin’s high volatility and strong trend behavior. These characteristics make the market particularly suitable for momentum strategies, as strong upward or downward movements are often followed by persistent trends that can be captured by a momentum-based approach.
Backtests of the BGMM on the Bitcoin futures market indicate that the model achieves above-average returns during periods of strong momentum, especially when the Gamma factor is optimized to suit the specific dynamics of the Bitcoin market. The high volatility of Bitcoin, combined with adaptive weighting, allows the model to respond quickly to price changes and maximize trading opportunities.
Scientific Citations and Sources:
• Jegadeesh, N., & Titman, S. (1993). Returns to Buying Winners and Selling Losers: Implications for Stock Market Efficiency. The Journal of Finance, 48(1), 65–91.
• Black, F., & Scholes, M. (1973). The Pricing of Options and Corporate Liabilities. Journal of Political Economy, 81(3), 637–654.
• Fama, E. F., & French, K. R. (1992). The Cross-Section of Expected Stock Returns. The Journal of Finance, 47(2), 427–465.
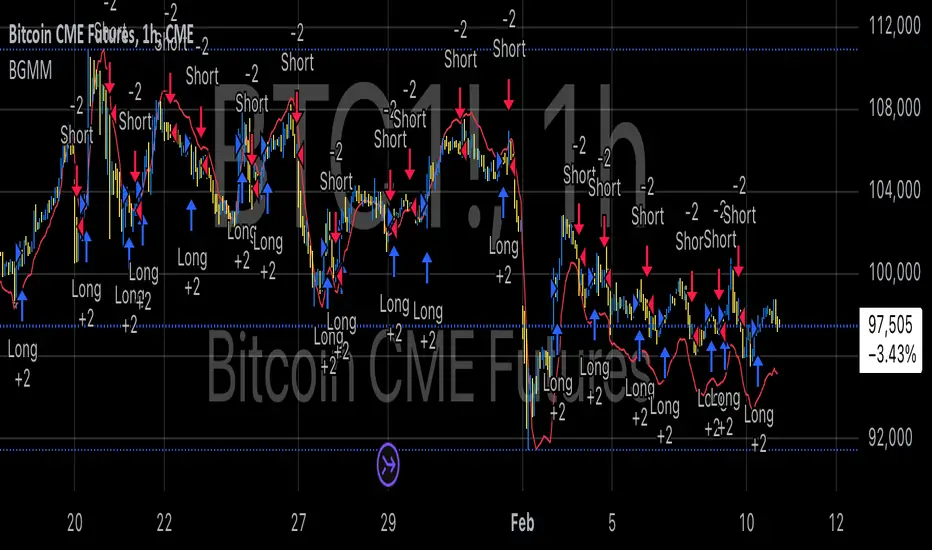
Bollinger Bounce Reversal Strategy – Visual EditionOverview:
The Bollinger Bounce Reversal Strategy – Visual Edition is designed to capture potential reversal moves at price extremes—often termed “bounce points”—by using a combination of technical indicators. The strategy integrates Bollinger Bands, MACD, and volume analysis, and it provides rich on‑chart visual cues to help traders understand its signals and conditions. Additionally, the strategy enforces a maximum of 5 trades per day and uses fixed risk management parameters. This publication is intended for educational purposes and offers a systematic, transparent approach that you can further adjust to fit your market or risk profile.
How It Works:
Bollinger Bands:
A 20‑period simple moving average (SMA) and a user‑defined standard deviation multiplier (default 2.0) are used to calculate the Bollinger Bands.
When the price reaches or crosses these bands (i.e. falls below the lower band or rises above the upper band), it suggests that the price is in an extreme, potentially oversold or overbought, state.
MACD Filter:
The MACD (calculated with standard lengths, e.g. 12, 26, 9) provides momentum information.
For a bullish (long) signal, the MACD line should be above its signal line; for a bearish (short) signal, the MACD line should be below.
Volume Confirmation:
The strategy uses a 20‑period volume moving average to determine if current volume is strong enough to validate a signal.
A signal is confirmed only if the current volume is at or above a specified multiple (by default, 1.0×) of this moving average, ensuring that the move is supported by increased market participation.
Visual Cues:
Bollinger Bands and Fill: The basis (SMA), upper, and lower Bollinger Bands are plotted, and the area between the upper and lower bands is filled with a semi‑transparent color.
Signal Markers: When a long or short signal is generated, corresponding markers (labels) appear on the chart.
Background Coloring: The chart’s background changes color (green for long signals and red for short signals) on the bars where signals occur.
Information Table: An on‑chart table displays key indicator values (MACD, signal line, volume, average volume) and the number of trades executed that day.
Entry Conditions:
Long Entry:
A long trade is triggered when the previous bar’s close is below the lower Bollinger Band and the current bar’s close crosses above it, combined with a bullish MACD condition and strong volume.
Short Entry:
A short trade is triggered when the previous bar’s close is above the upper Bollinger Band and the current bar’s close crosses below it, with a bearish MACD condition and high volume.
Risk Management:
Daily Trade Limit: The strategy restricts trading to no more than 5 trades per day.
Stop-Loss and Take-Profit:
For each position, a stop loss is set at a fixed percentage away from the entry price (typically 2%), and a take profit is set to target a 1:2 risk-reward ratio (typically 4% from the entry price).
Backtesting Setup:
Initial Capital: $10,000
Commission: 0.1% per trade
Slippage: 1 tick per bar
These realistic parameters help ensure that backtesting results reflect the conditions of an average trader.
Disclaimer:
Past performance is not indicative of future results. This strategy is experimental and provided solely for educational purposes. It is essential to backtest extensively and paper trade before any live deployment. All risk management practices are advisory, and you should adjust parameters to suit your own trading style and risk tolerance.
Conclusion:
By combining Bollinger Bands, MACD, and volume analysis, the Bollinger Bounce Reversal Strategy – Visual Edition provides a clear, systematic method to identify potential reversal opportunities at price extremes. The added visual cues help traders quickly interpret signals and assess market conditions, while strict risk management and a daily trade cap help keep trading disciplined. Adjust and refine the settings as needed to better suit your specific market and risk profile.

Sunil 2 Bar Breakout StrategyDetailed Explanation of the Sunil 2 Bar Breakout Strategy
Introduction
The Sunil 2 Bar Breakout Strategy is a simple yet effective price-action-based approach designed to identify breakout opportunities in financial markets. This strategy analyzes the movement of the last three candles to detect momentum and initiates trades in the direction of the breakout. It is equipped with a built-in stop-loss mechanism to protect capital, making it suitable for traders looking for a structured and disciplined trading system.
The strategy works well across different timeframes and asset classes, including indices, stocks, forex, and cryptocurrencies. Its versatility makes it ideal for both intraday and swing trading.
Core Concept
The strategy revolves around two primary conditions: breakout identification and risk management.
Breakout Identification:
Long Trade Setup: The strategy identifies bullish breakouts when:
The current candle's closing price is higher than the previous candle's closing price.
The high of the previous candle is greater than the highs of the two candles before it.
Short Trade Setup: The strategy identifies bearish breakouts when:
The current candle's closing price is lower than the previous candle's closing price.
The low of the previous candle is lower than the lows of the two candles before it.
Risk Management:
Stop-Loss: For each trade, a stop-loss is automatically set:
For long trades, the stop-loss is set to the low of the previous candle.
For short trades, the stop-loss is set to the high of the previous candle.
This ensures that losses are minimized if the breakout fails.
Exit Logic:
The trade is closed automatically when the stop-loss is hit.
This approach maintains discipline and prevents emotional trading.
Strategy Workflow
Entry Criteria:
Long Entry: A long trade is triggered when:
The current close is greater than the previous close.
The high of the previous candle exceeds the highs of the two candles before it.
Short Entry: A short trade is triggered when:
The current close is less than the previous close.
The low of the previous candle is below the lows of the two candles before it.
Stop-Loss Placement:
For long trades, the stop-loss is set at the low of the previous candle.
For short trades, the stop-loss is set at the high of the previous candle.
Trade Management:
Trades are exited automatically if the stop-loss level is hit.
The strategy avoids re-entering trades until new breakout conditions are met.
Default Settings
Position Sizing:
The default position size is set to 1% of the account equity. This ensures proper risk management and prevents overexposure to the market.
Stop-Loss:
Stop-loss levels are automatically calculated based on the previous candle’s high or low.
Timeframes:
The strategy is versatile and works across multiple timeframes. However, it is recommended to test it on 15-minute, 1-hour, and daily charts for optimal performance.
Key Features
Automated Trade Execution:
The strategy handles both trade entry and exit automatically based on pre-defined conditions.
Built-In Risk Management:
The automatic stop-loss placement ensures losses are minimized on failed breakouts.
Works Across Markets:
The strategy is compatible with a wide range of instruments, including indices, stocks, forex, and cryptocurrencies.
Clear Signals:
Entry and exit points are straightforward and based on objective conditions, reducing ambiguity.
Versatility:
Can be used for both day trading and swing trading, depending on the chosen timeframe.
Best Practices for Using This Strategy
Backtesting:
Test the strategy on your chosen instrument and timeframe using TradingView's Strategy Tester to evaluate its performance.
Market Conditions:
The strategy performs best in trending markets or during periods of high volatility. Avoid using it in range-bound or choppy markets.
Position Sizing:
Use the default position size (1% of equity) or adjust based on your risk tolerance and account size.
Instrument Selection:
Focus on instruments with good liquidity and volatility, such as indices (e.g., NIFTY, BANKNIFTY), forex pairs, or major cryptocurrencies (e.g., Bitcoin, Ethereum).
Potential Enhancements
To make the strategy even more robust, consider adding the following optional features:
Stop-Loss Multiplier:
Allow users to customize the stop-loss distance as a multiple of the default level (e.g., 1.5x the low or high of the previous candle).
Take-Profit Levels:
Add user-defined take-profit levels, such as a fixed risk-reward ratio (e.g., 1:2).
Time Filter:
Include an option to restrict trading to specific market hours (e.g., avoid low-liquidity times).
Conclusion
The Sunil 2 Bar Breakout Strategy is an excellent tool for traders looking to capitalize on breakout opportunities while maintaining disciplined risk management. Its simplicity, combined with its effectiveness, makes it suitable for traders of all experience levels. By adhering to the clearly defined rules, traders can achieve consistent results while avoiding emotional trading decisions.
This strategy is a reliable addition to any trader’s toolbox and is designed to work seamlessly across different market conditions and instruments.

Adaptive Trend Flow Strategy with Filters for SPXThe Adaptive Trend Flow Strategy with Filters for SPX is a complete trading algorithm designed to identify traits and offer actionable alerts for the SPX index. This Pine Script approach leverages superior technical signs and user-described parameters to evolve to marketplace conditions and optimize performance.
Key Features and Functionality
Dynamic Trend Detection: Utilizes a dual EMA-based totally adaptive method for fashion calculation.
The script smooths volatility the usage of an EMA filter and adjusts sensitivity through the sensitivity enter. This allows for real-time adaptability to market fluctuations.
Trend Filters for Precision:
SMA Filter: A Simple Moving Average (SMA) guarantees that trades are achieved best while the rate aligns with the shifting average trend, minimizing false indicators.
MACD Filter: The Moving Average Convergence Divergence (MACD) adds some other layer of confirmation with the aid of requiring alignment among the MACD line and its sign line.
Signal Generation:
Long Signals: Triggered when the fashion transitions from bearish to bullish, with all filters confirming the pass.
Short Signals: Triggered while the trend shifts from bullish to bearish, imparting opportunities for final positions.
User Customization:
Adjustable parameters for EMAs, smoothing duration, and sensitivity make certain the strategy can adapt to numerous buying and selling patterns.
Enable or disable filters (SMA or MACD) based totally on particular market conditions or consumer possibilities.
Leverage and Position Sizing: Incorporates a leverage aspect for dynamic position sizing.
Automatically calculates the exchange length based on account fairness and the leverage element, making sure hazard control is in area.
Visual Enhancements: Plots adaptive fashion ranges (foundation, top, decrease) for actual-time insights into marketplace conditions.
Color-coded bars and heritage to visually represent bullish or bearish developments.
Custom labels indicating crossover and crossunder occasions for clean sign visualization.
Alerts and Automation: Configurable alerts for each lengthy and quick indicators, well matched with automated buying and selling structures like plugpine.Com.
JSON-based alert messages consist of account credentials, motion type, and calculated position length for seamless integration.
Backtesting and Realistic Assumptions: Includes practical slippage, commissions, and preliminary capital settings for backtesting accuracy.
Leverages excessive-frequency trade sampling to make certain strong strategy assessment.
How It Works
Trend Calculation: The method derives a principal trend basis with the aid of combining fast and gradual EMAs. It then uses marketplace volatility to calculate adaptive upper and decrease obstacles, creating a dynamic channel.
Filter Integration: SMA and MACD filters work in tandem with the fashion calculation to ensure that handiest excessive-probability signals are accomplished.
Signal Execution: Signals are generated whilst the charge breaches those dynamic tiers and aligns with the fashion and filters, ensuring sturdy change access situations.
How to Use
Setup: Apply the approach to SPX or other well suited indices.
Adjust person inputs, together with ATR length, EMA smoothing, and sensitivity, to align together with your buying and selling possibilities.
Enable or disable the SMA and MACD filters to test unique setups.
Alerts: Configure signals for computerized notifications or direct buying and selling execution through third-celebration systems.
Use the supplied JSON payload to integrate with broking APIs or automation tools.
Optimization:
Experiment with leverage, filter out settings, and sensitivity to find most effective configurations to your hazard tolerance and marketplace situations.
Considerations and Best Practices
Risk Management: Always backtest the method with realistic parameters, together with conservative leverage and commissions.
Market Suitability: While designed for SPX, this method can adapt to other gadgets by means of adjusting key parameters.
Limitations: The method is trend-following and can underperform in enormously risky or ranging markets. Regularly evaluate and modify parameters primarily based on recent market conduct.
If you have any questions please let me know - I'm here to help!

EMA RSI Trend Reversal Ver.1Overview:
The EMA RSI Trend Reversal indicator combines the power of two well-known technical indicators—Exponential Moving Averages (EMAs) and the Relative Strength Index (RSI)—to identify potential trend reversal points in the market. The strategy looks for key crossovers between the fast and slow EMAs, and uses the RSI to confirm the strength of the trend. This combination helps to avoid false signals during sideways market conditions.
How It Works:
Buy Signal:
The Fast EMA (9) crosses above the Slow EMA (21), indicating a potential shift from a downtrend to an uptrend.
The RSI is above 50, confirming strong bullish momentum.
Visual Signal: A green arrow below the price bar and a Buy label are plotted on the chart.
Sell Signal:
The Fast EMA (9) crosses below the Slow EMA (21), indicating a potential shift from an uptrend to a downtrend.
The RSI is below 50, confirming weak or bearish momentum.
Visual Signal: A red arrow above the price bar and a Sell label are plotted on the chart.
Key Features:
EMA Crossovers: The Fast EMA crossing above the Slow EMA signals potential buying opportunities, while the Fast EMA crossing below the Slow EMA signals potential selling opportunities.
RSI Confirmation: The RSI helps confirm trend strength—values above 50 indicate bullish momentum, while values below 50 indicate bearish momentum.
Visual Cues: The strategy uses green arrows and red arrows along with Buy and Sell labels for clear visual signals of when to enter or exit trades.
Signal Interpretation:
Green Arrow / Buy Label: The Fast EMA (9) has crossed above the Slow EMA (21), and the RSI is above 50. This is a signal to buy or enter a long position.
Red Arrow / Sell Label: The Fast EMA (9) has crossed below the Slow EMA (21), and the RSI is below 50. This is a signal to sell or exit the long position.
Strategy Settings:
Fast EMA Length: Set to 9 (this determines how sensitive the fast EMA is to recent price movements).
Slow EMA Length: Set to 21 (this smooths out price movements to identify the broader trend).
RSI Length: Set to 14 (default setting to track momentum strength).
RSI Level: Set to 50 (used to confirm the strength of the trend—above 50 for buy signals, below 50 for sell signals).
Risk Management (Optional):
Use take profit and stop loss based on your preferred risk-to-reward ratio. For example, you can set a 2:1 risk-to-reward ratio (2x take profit for every 1x stop loss).
Backtesting and Optimization:
Backtest the strategy on TradingView by opening the Strategy Tester tab. This will allow you to see how the strategy would have performed on historical data.
Optimization: Adjust the EMA lengths, RSI period, and risk-to-reward settings based on your asset and time frame.
Limitations:
False Signals in Sideways Markets: Like any trend-following strategy, this indicator may generate false signals during periods of low volatility or sideways movement.
Not Suitable for All Market Conditions: This indicator performs best in trending markets. It may underperform in choppy or range-bound markets.
Strategy Example:
XRP/USD Example:
If you're trading XRP/USD and the Fast EMA (9) crosses above the Slow EMA (21), while the RSI is above 50, the indicator will signal a Buy.
Conversely, if the Fast EMA (9) crosses below the Slow EMA (21), and the RSI is below 50, the indicator will signal a Sell.
Bitcoin (BTC/USD):
On the BTC/USD chart, when the indicator shows a green arrow and a Buy label, it’s signaling a potential long entry. Similarly, a red arrow and Sell label indicate a short entry or exit from a previous long position.
Summary:
The EMA RSI Trend Reversal Indicator helps traders identify potential trend reversals with clear buy and sell signals based on the EMA crossovers and RSI confirmations. By using green arrows and red arrows, along with Buy and Sell labels, this strategy offers easy-to-understand visual signals for entering and exiting trades. Combine this with effective risk management and backtesting to optimize your trading performance.
