Trade Archer - Moving Averages - v1A group of four moving averages used for price smoothing. It also creates a cloud between Fast Ma and Medfast MA, Medfast MA and Medslow MA, and Medslow MA and Slow MA. Originally only Exponential Moving Averages were available, however the option to choose SMA, EMA (default), RMA, WMA, and VWMA were added. Also added was the option to choose the source of input. If any interesting additions are added, please let me know so I can update the script.
Wyszukaj w skryptach "averages"

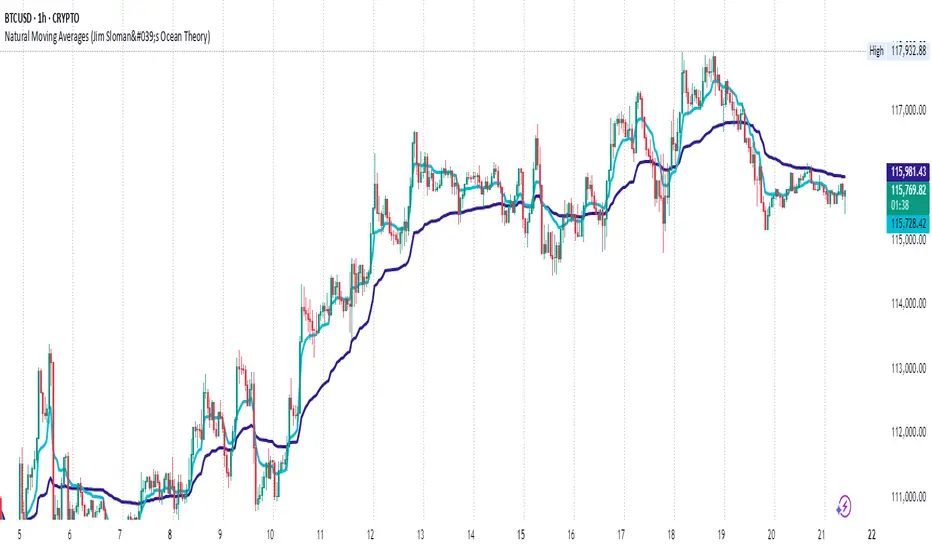
Natural Moving Averages (Jim Sloman's Ocean Theory)Natural Moving Averages invented by Jim Sloman.
Code copied by IA from the TradeStation code.
Includes the Fast and the Regular NMAs.
Jim Sloman invented Ocean Theory and the NMA is its building block.
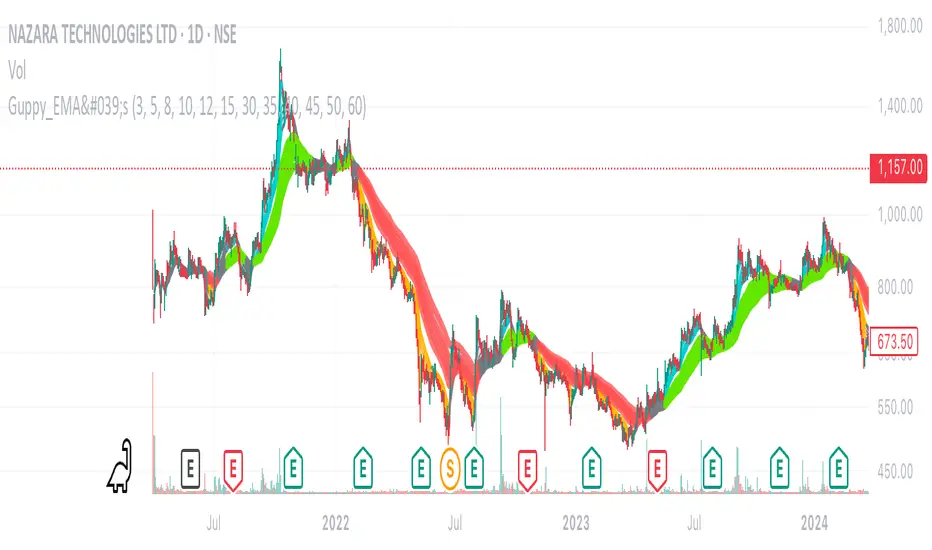
Daryl Guppy's Multiple Moving Averages - GMMAThe Guppy EMAs indicator (Daryl Guppy’s method) displays two groups of exponential moving averages (EMAs) on the chart:
Fast EMA group: 3, 5, 8, 10, 12, 15 periods (thinner, more responsive lines)
Slow EMA group: 30, 35, 40, 45, 50, 60 periods (thicker, smoother lines)
Color Logic:
Fast EMAs turn AQUA if all fast EMAs are in bullish alignment and slow EMAs are in bullish alignment.
Fast EMAs turn ORANGE if all fast EMAs are in bearish alignment and slow EMAs are in bearish alignment.
Otherwise, fast EMAs appear GRAY.
Slow EMAs turn LIME when in bullish order, RED when bearish, and remain GRAY otherwise.
The area between the outermost fast EMAs and slow EMAs is filled with a semi-transparent silver color for visual emphasis.

Multi Averages - CustomizableThis script adds up to 5 moving averages to your plot!
Both type and length are customizable.

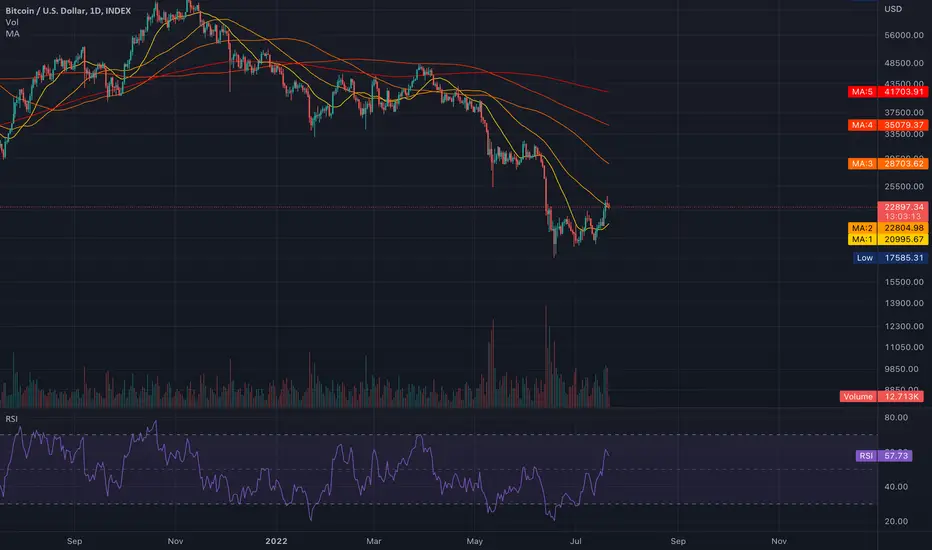
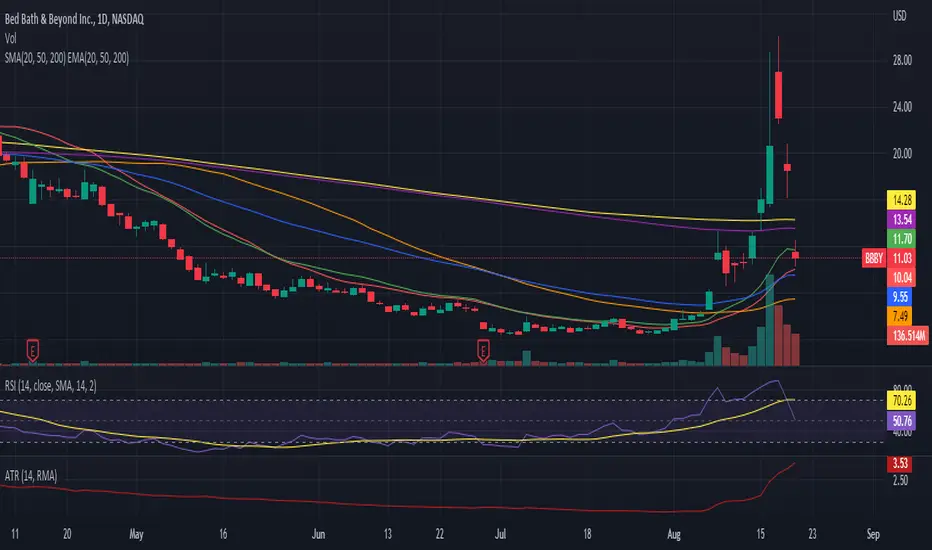
TRIPLE Moving AveragesThis Pine Script indicator plots three customizable moving averages (MAs) along with an optional composite MA (average of all three). It provides visual cues, alerts, and trend confirmation based on MA crossovers and price positioning relative to the MAs.
🔹 Key Features
1. Multiple Moving Average Types
Supports 7 different MA types for each line:
EMA (Exponential Moving Average)
SMA (Simple Moving Average)
SMMA / RMA (Smoothed / Regular Moving Average)
WMA (Weighted Moving Average)
VWMA (Volume Weighted Moving Average)
HMA (Hull Moving Average)
2. Three Independent MAs
MA1, MA2, MA3 can each be enabled/disabled
Custom lengths (default: 12, 21, 50)
Different price sources (close, open, high, low, etc.)
3. Composite Moving Average (Optional)
Calculates (MA1 + MA2 + MA3) / 3
Acts as a consensus trend filter
4. Visual & Alert Features
✅ Color-Coded Lines (Yellow = Price Above MA, Red = Price Below MA)
✅ Thick Line Width (3) for better visibility
✅ Background Highlights for crossovers/crossunders
✅ Alerts for All Crossover Combinations
🔹 How It Works
📈 MA Crossovers & Trend Signals
Bullish Signal: When a faster MA crosses above a slower MA
Bearish Signal: When a faster MA crosses below a slower MA
Trend Confirmation: All MAs aligned in the same direction (e.g., MA1 > MA2 > MA3 = Strong Uptrend)
🎨 Visual Indicators
Green Background → Bullish crossover detected
Red Background → Bearish crossover detected
Yellow Line → Price is above the MA (bullish)
Red Line → Price is below the MA (bearish)
🔔 Alert Conditions
Alerts are triggered for all possible MA crossover combinations, including:
MA1 crossing MA2
MA1 crossing MA3
MA2 crossing MA3
Any MA crossing the Composite MA

Moving Average Shift WaveTrend StrategyMoving Average Shift WaveTrend Strategy
🧭 Overview
The Moving Average Shift WaveTrend Strategy is a trend-following and momentum-based trading system designed to be overlayed on TradingView charts. It executes trades based on the confluence of multiple technical conditions—volatility, session timing, trend direction, and oscillator momentum—to deliver logical and systematic trade entries and exits.
🎯 Strategy Objectives
Enter trades aligned with the prevailing long-term trend
Exit trades on confirmed momentum reversals
Avoid false signals using session timing and volatility filters
Apply structured risk management with automatic TP, SL, and trailing stops
⚙️ Key Features
Selectable MA types: SMA, EMA, SMMA (RMA), WMA, VWMA
Dual-filter logic using a custom oscillator and moving averages
Session and volatility filters to eliminate low-quality setups
Trailing stop, configurable Take Profit / Stop Loss logic
“In-wave flag” prevents overtrading within the same trend wave
Visual clarity with color-shifting candles and entry/exit markers
📈 Trading Rules
✅ Long Entry Conditions:
Price is above the selected MA
Oscillator is positive and rising
200-period EMA indicates an uptrend
ATR exceeds its median value (sufficient volatility)
Entry occurs between 09:00–17:00 (exchange time)
Not currently in an active wave
🔻 Short Entry Conditions:
Price is below the selected MA
Oscillator is negative and falling
200-period EMA indicates a downtrend
All other long-entry conditions are inverted
❌ Exit Conditions:
Take Profit or Stop Loss is hit
Opposing signals from oscillator and MA
Trailing stop is triggered
🛡️ Risk Management Parameters
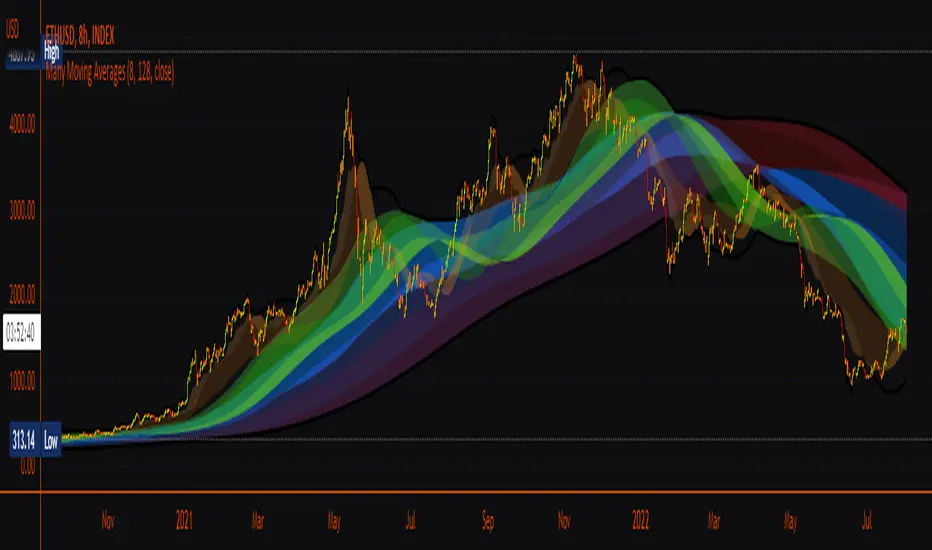
Pair: ETH/USD
Timeframe: 4H
Starting Capital: $3,000
Commission: 0.02%
Slippage: 2 pips
Risk per Trade: 2% of account equity (adjustable)
Total Trades: 224
Backtest Period: May 24, 2016 — April 7, 2025
Note: Risk parameters are fully customizable to suit your trading style and broker conditions.
🔧 Trading Parameters & Filters
Time Filter: Trades allowed only between 09:00–17:00 (exchange time)
Volatility Filter: ATR must be above its median value
Trend Filter: Long-term 200-period EMA
📊 Technical Settings
Moving Average
Type: SMA
Length: 40
Source: hl2
Oscillator
Length: 15
Threshold: 0.5
Risk Management
Take Profit: 1.5%
Stop Loss: 1.0%
Trailing Stop: 1.0%
👁️ Visual Support
MA and oscillator color changes indicate directional bias
Clear chart markers show entry and exit points
Trailing stops and risk controls are transparently managed
🚀 Strategy Improvements & Uniqueness
In-wave flag avoids repeated entries within the same trend phase
Filtering based on time, volatility, and trend ensures higher-quality trades
Dynamic high/low tracking allows precise trailing stop placement
Fully rule-based execution reduces emotional decision-making
💡 Inspirations & Attribution
This strategy is inspired by the excellent concept from:
ChartPrime – “Moving Average Shift”
It expands on the original idea with advanced trade filters and trailing logic.
Source reference:
📌 Summary
The Moving Average Shift WaveTrend Strategy offers a rule-based, reliable approach to trend trading. By combining trend and momentum filters with robust risk controls, it provides a consistent framework suitable for various market conditions and trading styles.
⚠️ Disclaimer
This script is for educational purposes only. Trading involves risk. Always use proper backtesting and risk evaluation before applying in live markets.

MTF Moving Averages (only EMA)MTF Moving Averages (only EMA)
This script provides a Multi-Timeframe (MTF) Exponential Moving Average (EMA) indicator for traders to visualize multiple EMAs across different timeframes directly on a single chart.
The indicator dynamically calculates and plots up to four EMAs per timeframe (15-minute, 30-minute, 1-hour, and Daily) with user-defined lengths, offering valuable insight into price trends and potential entry or exit points.
Key Features:
Multiple Timeframe Support: The script allows you to view EMAs from different timeframes simultaneously. This is especially useful for traders who follow trends across different timeframes to make more informed decisions.
Customizable Lengths: For each timeframe, the lengths of the EMAs are fully customizable. You can adjust the length of up to four EMAs per timeframe to suit your strategy.
EMA Calculation: The Exponential Moving Average (EMA) is used, which gives more weight to recent prices and reacts faster to price changes compared to the simple moving average (SMA).
Timeframe Flexibility: The indicator supports the following timeframes:
15-minute: Ideal for short-term traders and scalpers.
30-minute: For intraday trading with a slightly longer perspective.
1-hour: Suitable for swing traders and those who prefer a more medium-term view.
Daily: Great for longer-term trend-following strategies.
Interactive and User-Friendly: You can toggle the visibility of each EMA on each timeframe, allowing you to choose exactly which EMAs you wish to display, depending on your trading strategy.
Color-Coded for Clarity: The script uses distinct colors for each EMA on the chart:
Blue: EMA1
Green: EMA2
Red: EMA3
Purple: EMA4
Line Width Customization: Each plotted EMA line has a customizable width for better visual clarity.
Use Case:
Traders who use multiple timeframes for analysis (e.g., those using the "multi-timeframe analysis" technique) will find this script particularly useful. For example, a trader may look at the 15-minute chart to catch short-term movements, the 30-minute chart for intraday trends, the 1-hour chart for swing positions, and the Daily chart for identifying the overarching market trend. The script enables them to view the EMAs for all these timeframes in one glance without having to manually switch between them.
By observing the relationships between EMAs across multiple timeframes, traders can gain valuable insights into market conditions such as:
Crossovers: When a shorter-term EMA crosses above or below a longer-term EMA, it can signal a potential trend reversal or continuation.
Trend Strength: Multiple EMAs in alignment across different timeframes can indicate strong trend strength.
Support and Resistance: EMAs can act as dynamic support and resistance levels, guiding traders on price action levels to watch for potential price reversals.
Instructions:
Enable/Disable EMAs: Toggle on or off the EMAs for each timeframe (15-min, 30-min, 1-hour, Daily) using the script’s settings.
Adjust EMA Lengths: Change the default lengths for each EMA to match your preferred settings for different timeframes.
Monitor Key Levels: Watch how price interacts with the plotted EMAs to spot potential trading signals based on your strategy.
This indicator is designed to enhance your multi-timeframe analysis and help make more informed, data-driven trading decisions.

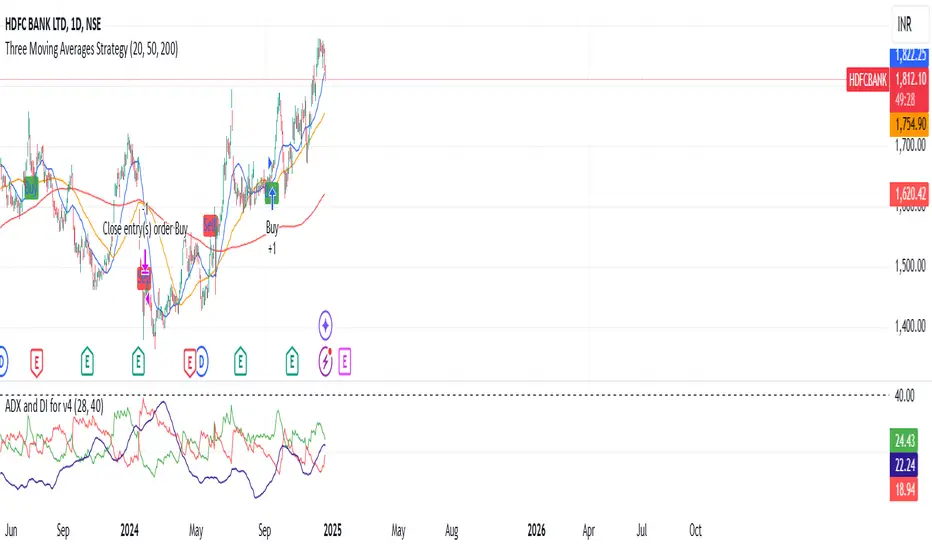
Three Moving Averages Strategythis is three moving averages strategy is good for day time frame best for swing trading , probability vary for 60 to 80 to increase the probability add other indictors . you can rsi or macd.
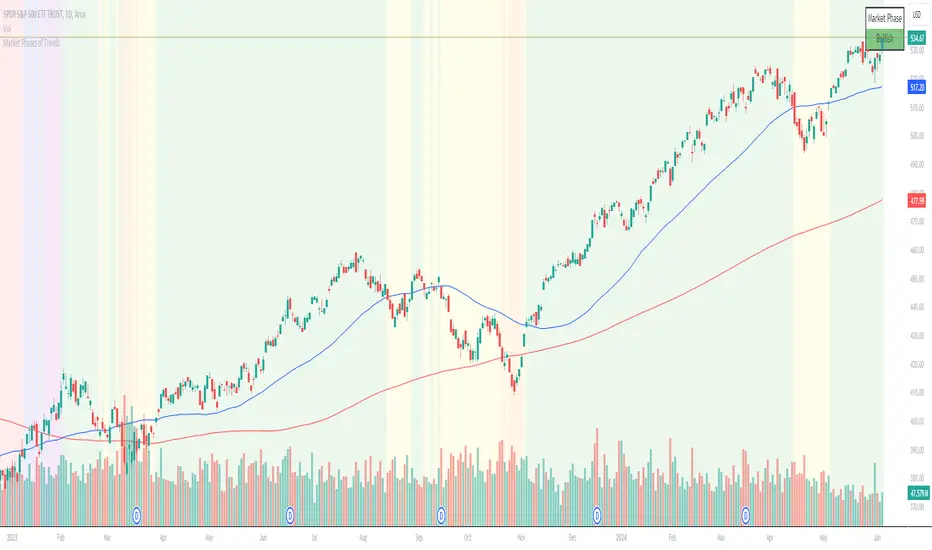
Chuck Dukas Market Phases of Trends (based on 2 Moving Averages)This script is based on the article “Defining The Bull And The Bear” by Chuck Duckas, published in Stocks & Commodities V. 25:13 (14-22); (S&C Bonus Issue, 2007).
The article “Defining The Bull And The Bear” discusses the concepts of “bullish” and “bearish” in relation to the price behavior of financial instruments. Chuck Dukas explains the importance of analyzing price trends and provides a framework for categorizing price activity into six phases. These phases, including recovery, accumulation, bullish, warning, distribution, and bearish, help to assess the quality of the price structure and guide decision-making in trading. Moving averages are used as tools for determining the context preceding the current price action, and the slope of a moving average is seen as an indicator of trend and price phase analysis.
The six phases of trends
// Definitions of Market Phases
recovery_phase = src > ma050 and src < ma200 and ma050 < ma200 // color: blue
accumulation_phase = src > ma050 and src > ma200 and ma050 < ma200 // color: purple
bullish_phase = src > ma050 and src > ma200 and ma050 > ma200 // color: green
warning_phase = src < ma050 and src > ma200 and ma050 > ma200 // color: yellow
distribution_phase = src < ma050 and src < ma200 and ma050 > ma200 // color: orange
bearish_phase = src < ma050 and src < ma200 and ma050 < ma200 // color red
Recovery Phase : This phase marks the beginning of a new trend after a period of consolidation or downtrend. It is characterized by the gradual increase in prices as the market starts to recover from previous losses.
Accumulation Phase : In this phase, the market continues to build a base as prices stabilize before making a significant move. It is a period of consolidation where buying and selling are balanced.
Bullish Phase : The bullish phase indicates a strong upward trend in prices with higher highs and higher lows. It is a period of optimism and positive sentiment in the market.
Warning Phase : This phase occurs when the bullish trend starts to show signs of weakness or exhaustion. It serves as a cautionary signal to traders and investors that a potential reversal or correction may be imminent.
Distribution Phase : The distribution phase is characterized by the market topping out as selling pressure increases. It is a period where supply exceeds demand, leading to a potential shift in trend direction.
Bearish Phase : The bearish phase signifies a strong downward trend in prices with lower lows and lower highs. It is a period of pessimism and negative sentiment in the market.
These rules of the six phases outline the cyclical nature of market trends and provide traders with a framework for understanding and analyzing price behavior to make informed trading decisions based on the current market phase.
60-period channel
The 60-period channel should be applied differently in each phase of the market cycle.
Recovery Phase : In this phase, the 60-period channel can help identify the beginning of a potential uptrend as price stabilizes or improves. Traders can look for new highs frequently in the 60-period channel to confirm the trend initiation or continuation.
Accumulation Phase : During the accumulation phase, the 60-period channel can highlight that the current price is sufficiently strong to be above recent price and longer-term price. Traders may observe new highs frequently in the 60-period channel as the slope of the 50-period moving average (SMA) trends upwards while the 200-period moving average (SMA) slope is losing its downward slope.
Bullish Phase : In the bullish phase, the 60-period channel showing a series of higher highs is crucial for confirming the uptrend. Additionally, traders should observe an upward-sloping 50-period SMA above an upward-sloping 200-period SMA for further validation of the bullish phase.
Warning Phase : When in the warning phase, the 60-period channel can provide insights into whether the current price is weaker than recent prices. Traders should pay attention to the relationship between the price close, the 50-period SMA, and the 200-period SMA to gauge the strength of the phase.
Distribution Phase : In the distribution phase, traders should look for new lows frequently in the 60-period channel, hinting at a weakening trend. It is crucial to observe that the 50-period SMA is still above the 200-period SMA in this phase.
Bearish Phase : Lastly, in the bearish phase, the 60-period channel reflecting a series of lower lows confirms the downtrend. Traders should also note that the price close is below both the 50-period SMA and the 200-period SMA, with the relationship of the 50-period SMA being less than the 200-period SMA.
By carefully analyzing the 60-period channel in each phase, traders can better understand market trends and make informed decisions regarding their investments.
Dual Dynamic Fibonacci Grouped Averages with Color ChangeRed Bearish Green Bullish
Using grouped fib averages, works similar to SMA

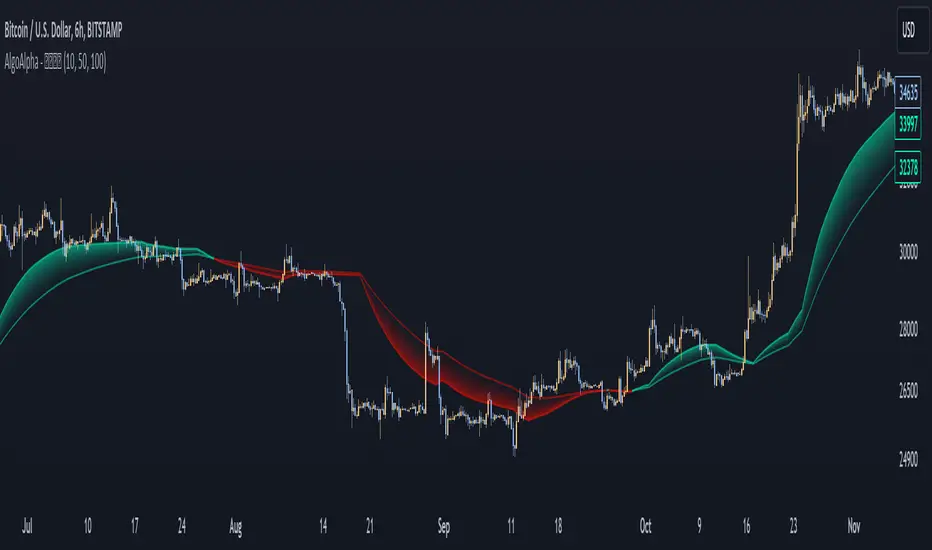
Liquidity Weighted Moving Averages [AlgoAlpha]Description:
The Liquidity Weighted Moving Averages by AlgoAlpha is a unique approach to identifying underlying trends in the market by looking at candle bars with the highest level of liquidity. This script offers a modified version of the classical MA crossover indicator that aims to be less noisy by using liquidity to determine the true fair value of price and where it should place more emphasis on when calculating the average.
Rationale:
It is common knowledge that liquidity makes it harder for market participants to move the price of assets, using this logic, we can determine the coincident liquidity of each bar by looking at the volume divided by the distance between the opening and closing price of that bar. If there is a higher volume but the opening and closing prices are near each other, this means that there was a high level of liquidity in that bar. We then use standard deviations to filter out high spikes of liquidity and record the closing prices on those bars. An average is then applied to these recorded prices only instead of taking the average of every single bar to avoid including outliers in the data processing.
Key features:
Customizable:
Fast Length - the period of the fast-moving average
Slow Length - the period of the slow-moving average
Outlier Threshold Length - the period of the outlier processing algorithm to detect spikes in liquidity
Significant Noise reduction from outliers:
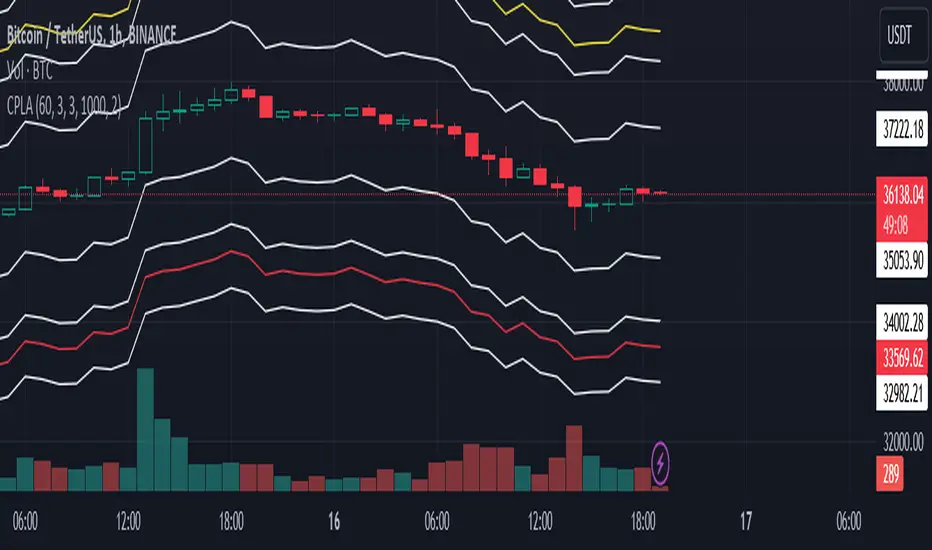
Custom Price Levels and AveragesThe "Custom Price Levels and Averages" indicator is a versatile tool designed for TradingView. It dynamically calculates and displays key price levels based on user-defined parameters such as distance percentages and position size. The indicator plots three ascending and descending price levels (A, B, C, X, Y, Z) around the last candle close on a specified timeframe. Additionally, it provides the average price for both upward and downward movements, considering the user's specified position size and increase factor. Traders can easily customize the visual appearance by adjusting colors for each plotted line. This indicator assists in identifying potential support and resistance levels and understanding the average price movements within a specified trading context.
Avoid SL hunting by acumulating your position with scaled orders.
Input Parameters:
inputTimeframe: Allows the user to select a specific timeframe (default: "D" for daily).
distancePercentageUp: Determines the percentage increase for ascending price levels (default: 1.5%).
distancePercentageDown: Determines the percentage decrease for descending price levels (default: 1.5%).
position: Specifies the position size in USD for calculating average prices (default: $100).
increaseFactor: Adjusts the increase in position size for each subsequent level (default: 1.5).
calcAvgPrice Function:
Parameters:
priceA, priceB, priceC: Ascending price levels.
priceX, priceY, priceZ: Descending price levels.
position: User-defined position size.
increaseFactor: User-defined increase factor.
Calculation:
Calculates the weighted average price for ascending (priceA, priceB, priceC) and descending (priceX, priceY, priceZ) levels.
Utilizes the specified position size and increase factor to determine the weighted average.
Plotting:
Price Calculations:
priceA, priceB, priceC: Derived by applying percentage increases to the last candle's close.
priceX, priceY, priceZ: Derived by applying percentage decreases to the last candle's close.
avgPriceUp, avgPriceDown: Computed using the calcAvgPrice function for ascending and descending levels, respectively.
Plotting Colors:
User-customizable through input parameters (colorPriceA, colorPriceB, colorPriceC, colorAvgPriceUp, colorPriceX, colorPriceY, colorPriceZ, colorAvgPriceDown).
Styling:
All lines are plotted with minimal thickness (linewidth=1) for a clean visualization.
Overall, the indicator empowers traders to analyze potential support and resistance levels and understand average price movements based on their specified parameters. The flexibility of color customization adds a layer of personalization to suit individual preferences.
Oscillating Length Moving Averages***CREDIT TO TradingView's TA Library*** (), Attempted to use "import TradingView/ta/4" to import the library, but for whatever reason
some of the functions failed to work, while others had no issue, so I opted to just copy paste what I wanted to use.
This moving average uses an oscillator to influence the length used during calculation. Extremely customizable/tunable with ability to change Max and Min length values, length multiplier, length multiple,4 different settings ,( Decline , <>Peak, >Decline , <>Peak, >
Multi Timeframe Moving AveragesThis script lets you have multiple Smoothed Moving Averages
for any timeframe of your choosing that are configurable to
your liking all in one indicator. Very useful if you want to always
show a specific MA like the 200d SMA on smaller timeframes,
for example.
Defaults to 30 d, 60 day, 90 day

MARKAY MOVING AVERAGESMarkay Moving Averages
EMA's
5 - RED
10 - NAVY
20 - TEAL
50 - GREEN
SMA's
100 - ORANGE
200 - RED

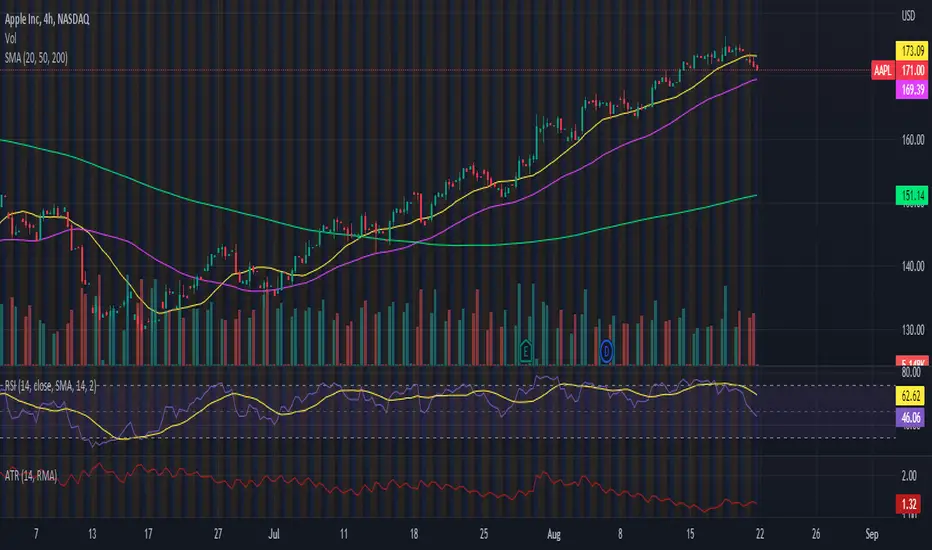
Simple and Exponential Moving Averages (20, 50, 200)Displays the 20, 50, and 200 simple and exponential moving averages in 1 indicator.
Fast v Slow Moving Averages Strategy (Variable) [divonn1994]This is a simple moving average based strategy that takes 2 moving averages, a Fast and a Slow one, plots them both, and then decides to enter a 'long' position or exit it based on whether the two lines have crossed each other. It goes 'long when the Fast Moving Average crosses above the Slow Moving Average. This could indicate upwards momentum in prices in the future. It then exits the position when the the Fast Moving Average crosses back below. This could indicate downwards momentum in prices in the future. This is only speculative, though, but sometimes it can be a very good indicator/strategy to predict future action.
I've tried some strategy settings and I found different promising strategies. Here are a few:
BTCUSD ( BitStamp ) 1 Day Timeframe : EMA, Fast length 25 bars, Slow length 62 bars => 28,792x net profit (default)
BTCUSD ( BitStamp ) 1 Day Timeframe : VWMA, Fast length 21 bars, Slow length 60 bars => 15,603x net profit
BTCUSD ( BitStamp ) 1 Day Timeframe : SMA, Fast length 18 bars, Slow length 51 bars => 19,507x net profit
BTCUSD ( BitStamp ) 1 Day Timeframe : RMA, Fast length 20 bars, Slow length 52 bars => 5,729x net profit
BTCUSD ( BitStamp ) 1 Day Timeframe : WMA, Fast length 29 bars, Slow length 60 bars => 19,869x net profit
Features:
-You can choose your preferred moving average: SMA , EMA , WMA , RMA & VWMA .
-You can change the length average for each moving average
-I made the background color Green when you're currently in a long position and Red when not. I made it so you can see when you'd be actively in a trade or not. The Red and Green background colors can be toggled on/off in order to see other indicators more clearly overlayed in the chart, or if you prefer a cleaner look on your charts.
-I also have a plot of the Fast moving average and Slow moving average together. The Opening moving average is Purple, the Closing moving average is White. White on top is a sign of a potential upswing and purple on top is a sign of a potential downswing. I've made this also able to be toggled on/off.
Let me know if you think I should change anything with my script, I'm always open to constructive criticism so feel free to comment below :)

Simple Moving Averages (20, 50, 200)Allows you to plot 20 day, 50 day, and 200 day simple moving averages using only 1 indicator.
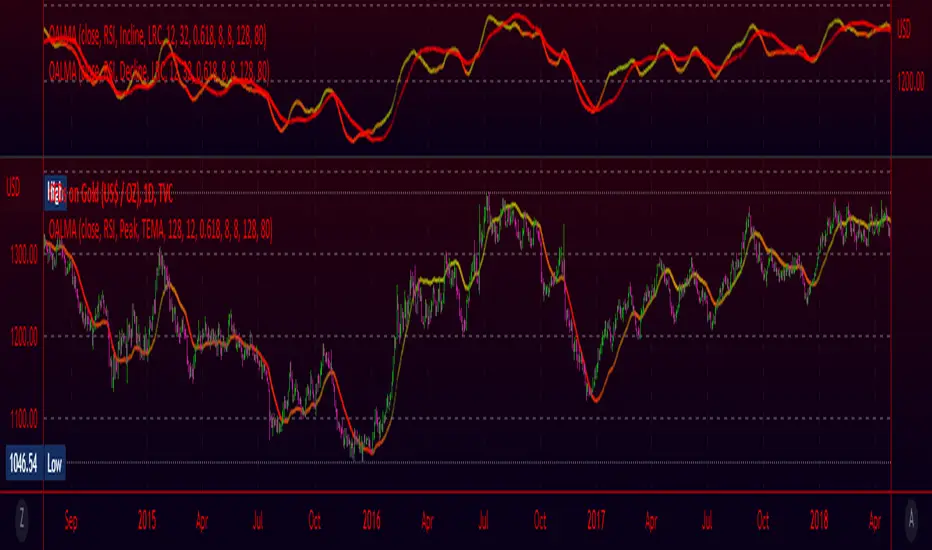
Many Moving AveragesA smooth looking indicator created from a mix of ALMA and LRC curves. Includes alternative calculation for both which I came up with through trial and error so a variety of combinations work to varying degrees. Just something I was playing around with that looked pretty nice in the end.
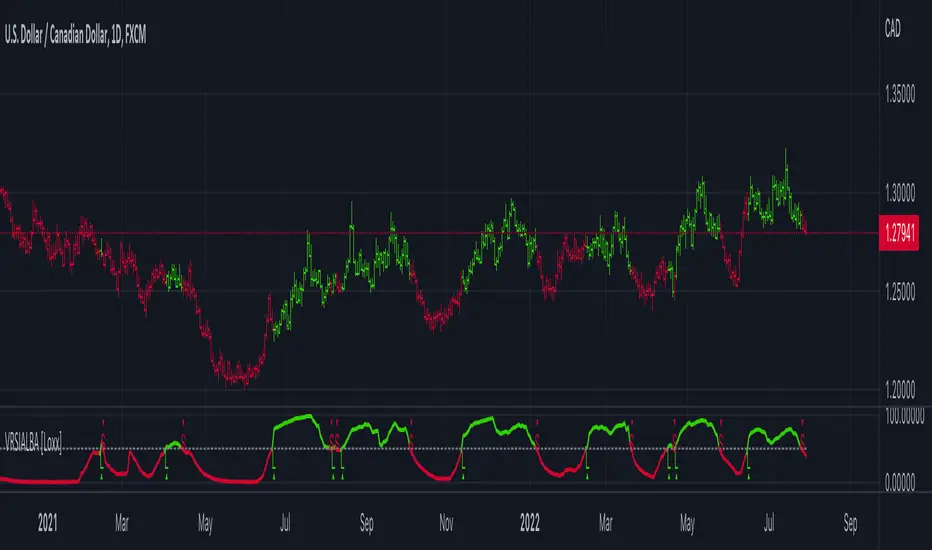
Variety RSI of Adaptive Lookback Averages [Loxx]Variety RSI of Adaptive Lookback Averages uses an adaptive lookback algorithm in order to determine dynamic length inputs to get used to smooth the input price source before calculating your choice of 6 different types of RSI. This ALB algorithm counts bars back until X many swing counts are reached.
Included:
Bar coloring
2 signal variations w/ alerts
Combo Moving AveragesThis Combo Moving Averages indicator allows users to have multiple & configurable MAs.
You can configure:
- Exponential MA
- Standard MA
- Configure Timeframe
- Configure Source (Close, Open, High, Low)
- Custom style for each MA
- Custom Colour for each MA
It provides an easy and fast way to configure the MA to determine the trend direction and possible reversals.
I hope this effort can help you in your trading.