XPloRR MA-Buy ATR-Trailing-Stop Long Term Strategy Beating B&HXPloRR MA-Buy ATR-MA-Trailing-Stop Strategy
Long term MA Trailing Stop strategy to beat Buy&Hold strategy
None of the strategies that I tested can beat the long term Buy&Hold strategy. That's the reason why I wrote this strategy.
Purpose: beat Buy&Hold strategy with around 10 trades. 100% capitalize sold trade into new trade.
My buy strategy is triggered by the EMA(blue) crossing over the SMA curve(orange).
My sell strategy is triggered by another EMA(lime) of the close value crossing the trailing stop(green) value.
The trailing stop value(green) is set to a multiple of the ATR(15) value.
ATR(15) is the SMA(15) value of the difference between high and low values.
Every stock has it's own "DNA", so first thing to do is find the right parameters to get the best strategy values voor EMA, SMA and Trailing Stop.
Then keep using these parameter for future buy/sell signals only for that particular stock.
Do the same for other stocks.
Here are the parameters:
Exponential MA: buy trigger when crossing over the SMA value (use values between 11-50)
Simple MA: buy trigger when EMA crosses over the SMA value (use values between 20 and 200)
Stop EMA: sell trigger when Stop EMA of close value crosses under the trailing stop value (use values between 8 and 16)
Trailing Stop #ATR: defines the trailing stop value as a multiple of the ATR(15) value
Example parameters for different stocks (Start capital: 1000, Order=100% of equity, Period 1/1/2005 to now):
BAR(Barco): EMA=11, SMA=82, StopEMA=12, Stop#ATR=9
Buy&HoldProfit: 45.82%, NetProfit: 294.7%, #Trades:8, %Profit:62.5%, ProfitFactor: 12.539
AAPL(Apple): EMA=12, SMA=45, StopEMA=12, Stop#ATR=6
Buy&HoldProfit: 2925.86%, NetProfit: 4035.92%, #Trades:10, %Profit:60%, ProfitFactor: 6.36
BEKB(Bekaert): EMA=12, SMA=42, StopEMA=12, Stop#ATR=7
Buy&HoldProfit: 81.11%, NetProfit: 521.37%, #Trades:10, %Profit:60%, ProfitFactor: 2.617
SOLB(Solvay): EMA=12, SMA=63, StopEMA=11, Stop#ATR=8
Buy&HoldProfit: 43.61%, NetProfit: 151.4%, #Trades:8, %Profit:75%, ProfitFactor: 3.794
PHIA(Philips): EMA=11, SMA=80, StopEMA=8, Stop#ATR=10
Buy&HoldProfit: 56.79%, NetProfit: 198.46%, #Trades:6, %Profit:83.33%, ProfitFactor: 23.07
I am very curious to see the parameters for your stocks and please make suggestions to improve this strategy.
Wyszukaj w skryptach "atr"

SMA MAD Trend [Alpha Extract]A sophisticated trend identification system that combines Simple Moving Average with Mean Absolute Deviation methodology to create adaptive Super Trend-style bands with advanced strength filtering and gradient visualization. Utilizing ADX-based trend strength validation and slope analysis for signal quality enhancement, this indicator delivers institutional-grade trend detection with dynamic ATR-based ribbon visualization and comprehensive strength measurement. The system's dual-filter architecture eliminates false signals during weak or choppy market conditions while maintaining sensitivity to genuine trend establishment and reversal events.
🔶 Advanced SMA-MAD Band Construction
Implements innovative Mean Absolute Deviation calculation around Simple Moving Average baseline to create volatility-adaptive bands with ratcheting logic for trend persistence. The system calculates MAD by measuring absolute price deviations from the mean, then applies configurable multipliers to generate upper and lower bands that adjust to changing market conditions while preventing premature band violations.
// Core SMA-MAD Framework
SMA_Value = ta.sma(close, SMA_Length)
Mean = ta.sma(close, MAD_Length)
Abs_Deviation = abs(close - Mean)
MAD_Value = ta.sma(Abs_Deviation, MAD_Length)
// Adaptive Bands
Upper_Band = SMA_Value + MAD_Factor * MAD_Value
Lower_Band = SMA_Value - MAD_Factor * MAD_Value
🔶 Intelligent Dual-Filter System
Features comprehensive trend validation using ADX strength measurement and slope analysis to eliminate low-conviction signals during ranging or consolidating markets. The system calculates normalized slope strength using ATR scaling and combines with ADX threshold analysis, generating filtered trend states that distinguish genuine trends from temporary price fluctuations.
🔶 Dynamic Trend Strength Engine
Implements sophisticated strength calculation combining slope intensity and ADX readings to produce normalized 0-100% strength scores with gradient colour intensity modulation. The system normalizes slope by minimum threshold and ADX by configurable level, multiplying factors to create composite strength measurement that drives visual feedback intensity across all indicator elements.
🔶 Super Trend-Style Direction Logic
Utilizes classic Super Trend methodology adapted for SMA-MAD bands, where trend direction flips occur on opposite band violations with persistent state maintenance. The system tracks previous band levels with ratcheting behaviour that adjusts bands only when price movement or new calculations warrant changes, preventing oscillation during normal volatility.
🔶 ATR-Based Ribbon Visualization
Provides dynamic ribbon overlay using ATR-scaled width around the trend line with opacity modulation based on trend strength for intuitive conviction assessment. The system creates upper and lower ribbon bounds at configurable ATR multiples, filling the channel with gradient-adjusted transparency that increases during strong trends and fades during weak conditions.
🔶 Multi-Dimensional Visual Architecture
Provides complete chart integration through trend line overlay, ATR ribbon fills, candle colouring, background glow, and transition signal labels with configurable visibility toggles. The system enables traders to customize display density from minimal (trend line only) to comprehensive (all visual elements) while maintaining consistent colour scheme and strength-based intensity across components.
🔶 Slope Strength Validation
Calculates ATR-normalized slope over configurable lookback periods to measure trend line momentum and filter sideways price action. The system compares absolute slope against minimum threshold requirements, preventing trend signals when price movement relative to the trend line lacks sufficient directional conviction regardless of band position.
🔶 Signal Generation Framework
Generates trend change signals when filtered direction state transitions from bearish to bullish or vice versa, with label placement and alert integration. The system implements state persistence that maintains previous trend until both ADX and slope filters confirm directional change, reducing whipsaw signals while capturing genuine reversals with minimal lag.
🔶 Performance Optimization Framework
Utilizes efficient calculation methods with optimized variable management and configurable parameters for balance between responsiveness and stability. The system includes intelligent state tracking with NA handling for initial bars and smooth gradient calculations that maintain performance across extended historical periods and real-time updates.
This indicator delivers sophisticated trend identification through Mean Absolute Deviation methodology combined with dual-strength filtering for superior signal quality. Unlike traditional Super Trend indicators that rely solely on ATR bands, the SMA-MAD approach uses statistical deviation measurement while incorporating ADX strength and slope validation to eliminate false signals during choppy conditions. The system's gradient-based visual feedback, ATR ribbon visualization, comprehensive dashboard, and multi-dimensional filtering make it essential for traders seeking reliable trend-following approaches with clear conviction measurement across cryptocurrency, forex, and equity markets. The combination of adaptive bands, strength-based transparency, and intelligent filtering creates an institutional-grade trend system suitable for systematic trading strategies.

Liquidity Void Zone Detector [PhenLabs]📊 Liquidity Void Zone Detector
Version: PineScript™v6
📌 Description
The Liquidity Void Zone Detector is a sophisticated technical indicator designed to identify and visualize areas where price moved with abnormally low volume or rapid momentum, creating "voids" in market liquidity. These zones represent areas where insufficient trading activity occurred during price movement, often acting as magnets for future price action as the market seeks to fill these gaps.
Built on PineScript v6, this indicator employs a dual-detection methodology that analyzes both volume depletion patterns and price movement intensity relative to ATR. The revolutionary 3D visualization system uses three-layer polyline rendering with adaptive transparency and vertical offsets, creating genuine depth perception where low liquidity zones visually recede and high liquidity zones protrude forward. This makes critical market structure immediately apparent without cluttering your chart.
🚀 Points of Innovation
Dual detection algorithm combining volume threshold analysis and ATR-normalized price movement sensitivity for comprehensive void identification
Three-layer 3D visualization system with progressive transparency gradients (85%, 78%, 70%) and calculated vertical offsets for authentic depth perception
Intelligent state machine logic that tracks consecutive void bars and only renders zones meeting minimum qualification requirements
Dynamic strength scoring system (0-100 scale) that combines inverted volume ratios with movement intensity for accurate void characterization
Adaptive ATR-based spacing calculation that automatically adjusts 3D layering depth to match instrument volatility
Efficient memory management system supporting up to 100 simultaneous void visualizations with automatic array-based cleanup
🔧 Core Components
Volume Analysis Engine: Calculates rolling volume averages and compares current bar volume against dynamic thresholds to detect abnormally thin trading conditions
Price Movement Analyzer: Normalizes bar range against ATR to identify rapid price movements that indicate liquidity exhaustion regardless of instrument or timeframe
Void Tracking State Machine: Maintains persistent tracking of void start bars, price boundaries, consecutive bar counts, and cumulative strength across multiple bars
3D Polyline Renderer: Generates three-layer rectangular polylines with precise timestamp-to-bar index conversion and progressive offset calculations
Strength Calculation System: Combines volume component (inverted ratio capped at 100) with movement component (ATR intensity × 30) for comprehensive void scoring
🔥 Key Features
Automatic Void Detection: Continuously scans price action for low volume conditions or rapid movements, triggering void tracking when thresholds are exceeded
Real-Time Visualization: Creates 3D rectangular zones spanning from void initiation to termination, with color-coded depth indicating liquidity type
Adjustable Sensitivity: Configure volume threshold multiplier (0.1-2.0x), price movement sensitivity (0.5-5.0x), and minimum qualifying bars (1-10) for customized detection
Dual Color Coding: Separate visual treatment for low liquidity voids (receding red) and high liquidity zones (protruding green) based on 50-point strength threshold
Optional Compact Labels: Toggle LV (Low Volume) or HV (High Volume) circular labels at void centers for quick identification without visual clutter
Lookback Period Control: Adjust analysis window from 5 to 100 bars to match your trading timeframe and market volatility characteristics
Memory-Efficient Design: Automatically manages polyline and label arrays, deleting oldest elements when user-defined maximum is reached
Data Window Integration: Plots void detection binary, current strength score, and average volume for detailed analysis in TradingView's data window
🎨 Visualization
Three-Layer Depth System: Each void is rendered as three stacked polylines with progressive transparency (85%, 78%, 70%) and calculated vertical offsets creating authentic 3D appearance
Directional Depth Perception: Low liquidity zones recede with back layer most transparent; high liquidity zones protrude with front layer most transparent for instant visual differentiation
Adaptive Offset Spacing: Vertical separation between layers calculated as ATR(14) × 0.001, ensuring consistent 3D effect across different instruments and volatility regimes
Color Customization: Fully configurable base colors for both low liquidity zones (default: red with 80 transparency) and high liquidity zones (default: green with 80 transparency)
Minimal Chart Clutter: Closed polylines with matching line and fill colors create clean rectangular zones without unnecessary borders or visual noise
Background Highlight: Subtle yellow background (96% transparency) marks bars where void conditions are actively detected in real-time
Compact Labeling: Optional tiny circular labels with 60% transparent backgrounds positioned at void center points for quick reference
📖 Usage Guidelines
Detection Settings
Lookback Period: Default: 10 | Range: 5-100 | Number of bars analyzed for volume averaging and void detection. Lower values increase sensitivity to recent changes; higher values smooth detection across longer timeframes. Adjust based on your trading timeframe: short-term traders use 5-15, swing traders use 20-50, position traders use 50-100.
Volume Threshold: Default: 1.0 | Range: 0.1-2.0 (step 0.1) | Multiplier applied to average volume. Bars with volume below (average × threshold) trigger void conditions. Lower values detect only extreme volume depletion; higher values capture more moderate low-volume situations. Start with 1.0 and decrease to 0.5-0.7 for stricter detection.
Price Movement Sensitivity: Default: 1.5 | Range: 0.5-5.0 (step 0.1) | Multiplier for ATR-normalized price movement detection. Values above this threshold indicate rapid price changes suggesting liquidity voids. Increase to 2.0-3.0 for volatile instruments; decrease to 0.8-1.2 for ranging or low-volatility conditions.
Minimum Void Bars: Default: 10 | Range: 1-10 | Minimum consecutive bars exhibiting void conditions required before visualization is created. Filters out brief anomalies and ensures only sustained voids are displayed. Use 1-3 for scalping, 5-10 for intraday trading, 10+ for swing trading to match your time horizon.
Visual Settings
Low Liquidity Color: Default: Red (80% transparent) | Base color for zones where volume depletion or rapid movement indicates thin liquidity. These zones recede visually (back layer most transparent). Choose colors that contrast with your chart theme for optimal visibility.
High Liquidity Color: Default: Green (80% transparent) | Base color for zones with relatively higher liquidity compared to void threshold. These zones protrude visually (front layer most transparent). Ensure clear differentiation from low liquidity color.
Show Void Labels: Default: True | Toggle display of compact LV/HV labels at void centers. Disable for cleaner charts when trading; enable for analysis and review to quickly identify void types across your chart.
Max Visible Voids: Default: 50 | Range: 10-100 | Maximum number of void visualizations kept on chart. Each void uses 3 polylines, so setting of 50 maintains 150 total polylines. Higher values preserve more history but may impact performance on lower-end systems.
✅ Best Use Cases
Gap Fill Trading: Identify unfilled liquidity voids that price frequently returns to, providing high-probability retest and reversal opportunities when price approaches these zones
Breakout Validation: Distinguish genuine breakouts through established liquidity from false breaks into void zones that lack sustainable volume support
Support/Resistance Confluence: Layer void detection over key horizontal levels to validate structural integrity—levels within high liquidity zones are stronger than those in voids
Trend Continuation: Monitor for new void formation in trend direction as potential continuation zones where price may accelerate due to reduced resistance
Range Trading: Identify void zones within consolidation ranges that price tends to traverse quickly, helping to avoid getting caught in rapid moves through thin areas
Entry Timing: Wait for price to reach void boundaries rather than entering mid-void, as voids tend to be traversed quickly with limited profit-taking opportunities
⚠️ Limitations
Historical Pattern Indicator: Identifies past liquidity voids but cannot predict whether price will return to fill them or when filling might occur
No Volume on Forex: Indicator uses tick volume for forex pairs, which approximates but doesn't represent true trading volume, potentially affecting detection accuracy
Lagging Confirmation: Requires minimum consecutive bars (default 10) before void is visualized, meaning detection occurs after void formation begins
Trending Market Behavior: Strong trends driven by fundamental catalysts may create voids that remain unfilled for extended periods or permanently
Timeframe Dependency: Detection sensitivity varies significantly across timeframes; settings optimized for one timeframe may not perform well on others
No Directional Bias: Indicator identifies liquidity characteristics but provides no predictive signal for price direction after void detection
Performance Considerations: Higher max visible void settings combined with small minimum void bars can generate numerous visualizations impacting chart rendering speed
💡 What Makes This Unique
Industry-First 3D Visualization: Unlike flat volume or liquidity indicators, the three-layer rendering with directional depth perception provides instant visual hierarchy of liquidity quality
Dual-Mode Detection: Combines both volume-based and movement-based detection methodologies, capturing voids that single-approach indicators miss
Intelligent Qualification System: State machine logic prevents premature visualization by requiring sustained void conditions, reducing false signals and chart clutter
ATR-Normalized Analysis: All detection thresholds adapt to instrument volatility, ensuring consistent performance across stocks, forex, crypto, and futures without constant recalibration
Transparency-Based Depth: Uses progressive transparency gradients rather than colors or patterns to create depth, maintaining visual clarity while conveying information hierarchy
Comprehensive Strength Metrics: 0-100 void strength calculation considers both the degree of volume depletion and the magnitude of price movement for nuanced zone characterization
🔬 How It Works
Phase 1: Real-Time Detection
On each bar close, the indicator calculates average volume over the lookback period and compares current bar volume against the volume threshold multiplier
Simultaneously measures current bar's high-low range and normalizes it against ATR, comparing the result to price movement sensitivity parameter
If either volume falls below threshold OR movement exceeds sensitivity threshold, the bar is flagged as exhibiting void characteristics
Phase 2: Void Tracking & Qualification
When void conditions first appear, state machine initializes tracking variables: start bar index, initial top/bottom prices, consecutive bar counter, and cumulative strength accumulator
Each subsequent bar with void conditions extends the tracking, updating price boundaries to envelope all bars and accumulating strength scores
When void conditions cease, system checks if consecutive bar count meets minimum threshold; if yes, proceeds to visualization; if no, discards the tracking and resets
Phase 3: 3D Visualization Construction
Calculates average void strength by dividing cumulative strength by number of bars, then determines if void is low liquidity (>50 strength) or high liquidity (≤50 strength)
Generates three polyline layers spanning from start bar to end bar and from top price to bottom price, each with calculated vertical offset based on ATR
Applies progressive transparency (85%, 78%, 70%) with layer ordering creating recession effect for low liquidity zones and protrusion effect for high liquidity zones
Creates optional center label and pushes all visual elements into arrays for memory management
Phase 4: Memory Management & Display
Continuously monitors polyline array size (each void creates 3 polylines); when total exceeds max visible voids × 3, deletes oldest polylines via array.shift()
Similarly manages label array, removing oldest labels when count exceeds maximum to prevent memory accumulation over extended chart history
Plots diagnostic data to TradingView’s data window (void detection binary, current strength, average volume) for detailed analysis without cluttering main chart
💡 Note:
This indicator is designed to enhance your market structure analysis by revealing liquidity characteristics that aren’t visible through standard price and volume displays. For best results, combine void detection with your existing support/resistance analysis, trend identification, and risk management framework. Liquidity voids are descriptive of past market behavior and should inform positioning decisions rather than serve as standalone entry/exit signals. Experiment with detection parameters across different timeframes to find settings that align with your trading style and instrument characteristics.

SuperTrend Dual RMAOverview
The SuperTrend Dual RMA is a hybrid volatility-based trend-following system that merges two Relative Moving Averages (RMAs) with an Average True Range (ATR)–anchored SuperTrend framework. The primary purpose of this indicator is to offer a smoother and more reliable depiction of directional bias while maintaining sensitivity to price volatility and market volume.
Traditional SuperTrend implementations typically rely on a single moving average and a fixed volatility envelope. This dual RMA structure introduces an adaptive central tendency line that reacts proportionally to both price and volume, allowing for more nuanced identification of trend reversals and continuation patterns.
**Core Concept**
The indicator is built around two key principles — smoothing and volatility adaptation.
1. **Smoothing:** The use of two separate RMAs with configurable lengths creates a dynamic equilibrium between short-term responsiveness and long-term stability. The first RMA captures near-term directional shifts, while the second provides broader market context. The average of both becomes the foundation of the SuperTrend bands.
2. **Volatility Adaptation:** The ATR multiplier and period define the distance between upper and lower bands relative to recent volatility. This ensures that the SuperTrend line remains flexible across varying market conditions — expanding during high volatility and contracting during calm phases.
**Calculation Steps**
* The indicator first computes two volume-weighted RMAs based on the typical price (`hlc3`) multiplied by trading volume.
* Each RMA is normalized by the smoothed volume to maintain proportional weighting.
* These two RMAs are averaged to produce a “basis line” that reflects the current market consensus price.
* The ATR is calculated over a user-defined period, then multiplied by a volatility factor (ATR multiplier).
* The resulting ATR value defines dynamic upper and lower thresholds around the basis line.
* Trend direction is determined by price closing behavior relative to these thresholds:
* When the closing price exceeds the upper band, the trend is considered bullish.
* When it drops below the lower band, the trend turns bearish.
* If price remains within the bands, the prior trend direction is maintained for consistency.
**Visual Structure**
The SuperTrend Dual RMA provides multiple layers of visual feedback for enhanced interpretation:
* Two distinct RMA lines (short and long) are plotted with complementary colors for contrast and clarity.
* A soft fill between the RMA lines highlights the interaction between short- and medium-term momentum.
* The ATR-based SuperTrend bands are drawn above and below the basis, with adaptive coloring that corresponds to the prevailing trend direction.
* Bar colors automatically adjust to reflect bullish or bearish bias, making it easy to identify trend shifts without relying solely on crossovers.
* Optional triangle markers appear below or above bars to signal potential buy or sell opportunities based on crossover logic.
**Signals and Alerts**
The indicator provides real-time crossover detection:
* **Buy Signal:** Triggered when the closing price moves above the SuperTrend line, confirming potential bullish continuation or reversal.
* **Sell Signal:** Triggered when the closing price drops below the SuperTrend line, indicating possible bearish momentum or reversal.
Both conditions have built-in `alertcondition()` functions, allowing users to set automated alerts for trading or monitoring purposes. This enables integration with TradingView’s alert system for push notifications, emails, or webhook connections.
**Usage Guidelines**
* **Trend Identification:** Use the color-coded trend line and bar color as a visual guide to the current directional bias.
* **Entry and Exit Timing:** Consider entering trades when a new crossover alert appears, preferably in the direction of the overall higher-timeframe trend.
* **Parameter Tuning:** Adjust the RMA lengths and ATR parameters based on asset volatility. Shorter RMA and ATR settings provide faster reactions, suitable for intraday or high-frequency trading, while longer configurations better fit swing or position strategies.
* **Risk Management:** Because the SuperTrend inherently acts as a dynamic stop level, traders can use the opposite band or SuperTrend line as a trailing stop or exit signal.
**Practical Applications**
* Trend confirmation in multi-timeframe strategies.
* Adaptive trailing stop placement using the lower or upper band.
* Visual comparison of volume-weighted price movement against volatility envelopes.
* Integration into algorithmic trading systems as a signal filter or trend bias component.
* Identification of overextended conditions when price significantly diverges from the SuperTrend basis.
**Originality and Advantages**
The SuperTrend Dual RMA differentiates itself from conventional SuperTrend scripts through three innovative design choices:
1. **Dual Volume-Weighted RMAs:** By incorporating two RMAs weighted by trading volume, the indicator accounts for liquidity dynamics, producing smoother and more reliable averages compared to price-only calculations.
2. **Anchored SuperTrend Framework:** The SuperTrend bands are not derived from a fixed source (such as a single close or median price) but from a blended RMA basis, making them more adaptable to varying market behaviors.
3. **Integrated Multi-Layer Visualization:** The inclusion of filled regions between RMAs, dynamic band coloring, and bar tinting enhances readability and analytical depth without overwhelming the chart.
These improvements collectively create a more balanced and data-rich representation of market structure, offering a higher degree of analytical precision. It’s suitable for traders seeking both discretionary and systematic use, as the indicator’s logic is transparent and compatible with alert-based or automated workflows.
**Summary**
The SuperTrend Dual RMA is a refined evolution of the classic SuperTrend, optimized for traders who value smoother directional tracking and more intelligent volatility adaptation. It blends two time-sensitive, volume-aware moving averages with an ATR-derived volatility system to deliver reliable, actionable trend information. Its visual design, adaptive responsiveness, and integrated alert functionality make it a complete solution for identifying and managing trends across multiple asset classes and timeframes.

Victoria Overlay - HTF 200 + VWAP + ATR Stop + MA TrioConsolidated road to minions
Buy Setup:
EMA1 crosses above SMA3.
RSI confirms above 50.
Volume increasing (confirming momentum).
Candle closes above SMA1 base.
Sell Setup:
EMA1 crosses below SMA3.
RSI drops below 50 or exits overbought.
Volume confirms (declining or reversing).
Candle closes below SMA1 base.
Tips:
Think of EMA1 as the scalper’s trigger.
SMA3 is your momentum check.
SMA1 (base) = short-term bias.
Avoid entries during low-volume chop.
Use for day trades or tight scalps; exits happen fast.
Overlay (Smoothed Heikin Ashi + Swing + VWAP + ATR Stop + 200-SMA)
Purpose: Multi-layer trend confirmation + clean structure.
Type: Swing alignment tool.
🟩 BUY / CALL Conditions
Green “Buy (Gated)” arrow appears.
Price is above VWAP, above 200-SMA, and above ATR stop.
ATR stop (green line) sits under price → support confirmed.
Heikin-Ashi candles are green/lime.
Bias label says “Above VWAP | Above 200 | Swing Up”.
🟥 SELL / PUT Conditions
Red “Sell (Gated)” arrow appears.
Price is below VWAP, below 200-SMA, and below ATR stop.
ATR stop (red line) sits above price → resistance confirmed.
Heikin-Ashi candles are red.
Bias label says “Below VWAP | Below 200 | Swing Down”.
Exit / Risk Control:
Close position when price crosses ATR stop.
If Heikin candles flip color, momentum is reversing.
Best Use Cases:
For next-day or multi-hour swing entries.
Use ATR Stop for dynamic stop loss.
Stay out when the bias label is mixed (e.g. “Above VWAP | Below 200 | Swing Down”).
Pro Tip:
On big news days, let VWAP reset post-open before acting on arrows — filters fake signals.
RSI Panel Pro (v6)
Purpose: Strength + exhaustion confirmation.
Type: Momentum filter.
Key Levels:
Overbought: 80+ → take profits soon.
Oversold: 20– → watch for bounce setups.
Bull regime: RSI above 60 = momentum strong.
Bear regime: RSI below 40 = weakness.
Buy / Entry Signals:
RSI crosses up from below 40 or 20.
RSI line is above RSI-EMA (gray line).
Higher timeframe RSI (if used) is also rising.
Trim / Exit:
RSI drops under 60 after being strong.
RSI crosses below its EMA.
Sell / Put Setup:
RSI fails at 60 or drops below 40.
RSI crosses under EMA after a bounce.
Tips:
Pair RSI panel with Victoria Overlay — only take gated buys when RSI confirms.
RSI < 40 but above 20 = “loading zone” for reversals.
RSI > 70 = overextended → wait for confirmation before entering.
Combined Execution Rules
Goal What to Watch Action
Entry (CALL) EMA1 > SMA3, Buy (Gated) arrow, RSI rising > 50 Buy call / open long
Entry (PUT) EMA1 < SMA3, Sell (Gated) arrow, RSI < 50 Buy put / open short
Exit Early Price crosses ATR stop or RSI flips under EMA Exit trade / protect gains
Trend Filter VWAP + 200-SMA alignment Only trade in that direction
Avoid Trades Conflicting bias label or low volume Stay flat
Pro Tips
VWAP → Intraday mean: above = bullish control, below = bearish control.
ATR Stop → Dynamic trailing stop: never widen it manually.
Smoothed Heikin-Ashi → filters noise: trend stays until color flips twice.
RSI Panel → confirms whether to hold through pullbacks.
If RSI and Overlay disagree — wait, not trade.

Full Session ATR Range (Live) - with Position ToggleBelow is a publication-ready text for the "Full Session ATR Range (Live) - with Position Toggle" indicator, written in a professional yet accessible style suitable for a trading community (e.g., TradingView or a blog). The text highlights the indicator's features, usage, and benefits, while avoiding overly technical jargon for a broad audience.
---
### Introducing the Full Session ATR Range (Live) Indicator with Position Toggle
Enhance your trading strategy with the **Full Session ATR Range (Live) Indicator**, a powerful tool designed to provide real-time insights into market volatility and session dynamics. This customizable indicator, now available with a position toggle feature, compares the current session's range to a 10-day Average True Range (ATR), helping traders gauge market activity and anticipate potential movements.
#### Key Features
- **Live Range Tracking**: Displays the current session's range (high minus low) alongside a 10-day ATR, updated in real-time during market hours.
- **Session Mode Flexibility**: Includes an auto-toggle option to switch between Electronic Trading Hours (ETH) and Regular Trading Hours (RTH), adapting to your preferred trading session. Manually select ETH or RTH, or let the indicator auto-detect based on market hours.
- **Comprehensive Metrics**: Offers a detailed breakdown including:
- Range/Avg %: Percentage of the current range relative to the 10-day ATR.
- Points Left: Remaining points to reach the average range.
- 100% Range Up/Dn: Potential upper and lower targets based on the ATR difference.
- **Position Customization**: Adjust the table's location on your chart with options like top-left, top-right, middle-center, or bottom-right for optimal visibility.
- **Visual Appeal**: Features a customizable background and text color to match your chart theme.
#### How It Works
The indicator calculates the 10-day ATR using daily data and tracks the current session's range, resetting at the start of each day or session change. During market hours (e.g., 6 AM - 8 PM CDT, adjustable), it updates live, providing actionable insights. When the market is closed, it displays historical ATR while marking live metrics as "n/a" to avoid confusion. The ETH/RTH toggle ensures the range reflects either the full extended session or the core trading hours, tailored to your strategy.
#### Why Use It?
Whether you're a day trader monitoring intraday volatility or a swing trader assessing longer-term trends, this indicator helps you:
- Identify overextended or underactive sessions compared to historical norms.
- Plan entries and exits with targets based on the 100% Range Up/Dn levels.
- Stay informed with a clean, adjustable display that fits your workflow.
#### Installation & Customization
1. Add the indicator to your TradingView chart.
2. Adjust the ATR length (default: 10 days) and table position via the input settings.
3. Choose your session mode (Auto, ETH, or RTH) and customize colors to suit your style.
4. Test during market hours for live updates—note that static values may appear outside trading sessions.
#### Feedback & Support
This indicator is designed for flexibility and ease of use. Share your feedback or request enhancements by commenting below or contacting the developer. Happy trading!

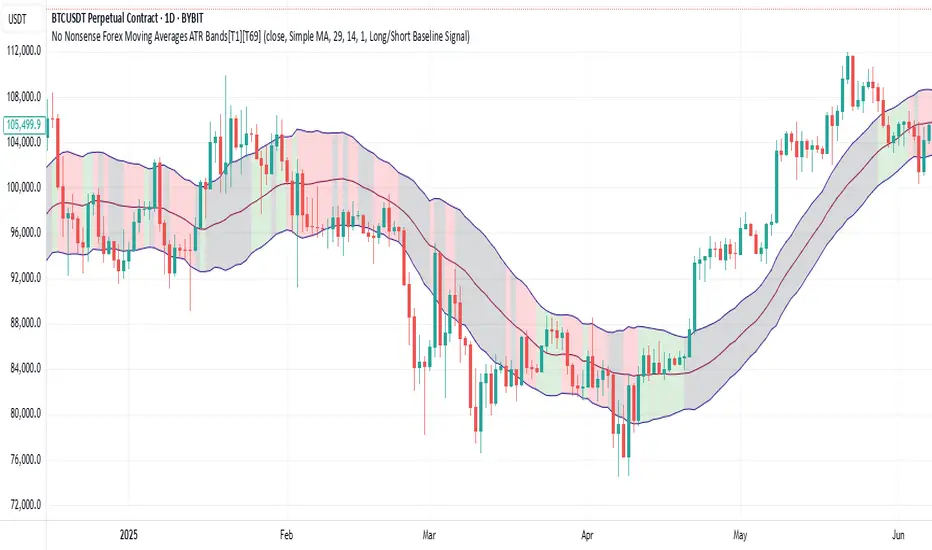
No Nonsense Forex Moving Averages ATR Bands[T1][T69]🔍 Overview
This indicator implements a No Nonsense Forex-style Baseline combined with ATR Bands, built using the moving_averages_library by Teyo69. It plots a configurable moving average and dynamically adjusts upper/lower ATR bands for trade zone detection and baseline confirmation.
✨ Features
30+ Moving Average types
ATR bands to define dynamic trade zones
Visual background highlighting for trade signals
Supports both "Within Range" and "Baseline Bias" display modes
Clean, minimal overlay with effective zone coloring
⚙️ How to Use
Choose MA Type: Select the baseline logic (SMA, EMA, HMA, etc.)
Configure ATR Bands: Adjust the ATR length and multiplier
Select Background Mode:
Within Range: Yellow = price inside band, Gray = outside
Long/Short Baseline Signal: Green = price above baseline, Red = below
Trade Setup:
Use the baseline for trend direction
Wait for confirmation or avoidance when price is outside the band
🛠 Configuration
Source: Price source for MA
MA Type: Any supported MA from the library
MA Length: Number of bars for smoothing
ATR Length: Period for Average True Range
ATR Multiplier: Width of the bands
Background Signal Mode: Choose visual signal type
⚠️ Limitations
Works with one MA at a time
Requires the moving_averages_library imported
Does not include confirmation or exit logic — use with full NNFX stack
💡 Tips
Combine with Volume or Confirmation indicators for NNFX strategy
Use adaptive MAs like KAMA, JMA, or VIDYA for dynamic baselines
Adjust ATR settings based on asset volatility
📘 Credits
Library: Teyo69/moving_averages_library/1
Inspired by: No Nonsense Forex (VP) Baseline + ATR Band methodology & MigthyZinger
Clean ATR LevelsSimple 14D ATR +1 & -1 display from PM to Close.
The Clean ATR Levels indicator is a powerful Pine Script tool designed to provide traders with dynamic support and resistance levels based on the Average True Range (ATR) calculation. This indicator automatically draws horizontal lines that represent key price levels where significant market reactions are likely to occur, helping traders identify potential entry and exit points throughout the trading session.
The core functionality centers around calculating ATR levels using the most recent daily close as the reference point. The script draws two primary levels: an upper level at +100% ATR above the current close and a lower level at -100% ATR below the current close. These levels represent statistically significant price zones where the market has historically shown increased volatility and potential reversal patterns. Additionally, the indicator includes an optional previous close line that serves as a psychological reference point for intraday price action.
What sets this indicator apart is its intelligent session management and clean visual presentation. The lines are automatically redrawn at the start of each new trading day and are programmed to extend precisely until 4 PM EST market close, eliminating visual clutter on the chart. This session-aware approach ensures that traders are always working with the most relevant levels for the current trading day without having outdated lines extending unnecessarily into future sessions.
The indicator also features a comprehensive information table that displays real-time values for the ATR calculation, current close price, and both upper and lower ATR levels. This provides traders with exact numerical references without having to manually calculate these critical values. The script is highly customizable, allowing users to adjust the ATR period, line colors, widths, and choose whether to display the previous close reference line, making it adaptable to various trading styles and visual preferences.

System 0530 - Stoch RSI Strategy with ATR filterStrategy Description: System 0530 - Multi-Timeframe Stochastic RSI with ATR Filter
Overview:
This strategy, "System 0530," is designed to identify trading opportunities by leveraging the Stochastic RSI indicator across two different timeframes: a shorter timeframe for initial signal triggers (assumed to be the chart's current timeframe, e.g., 5-minute) and a longer timeframe (15-minute) for signal confirmation. It incorporates an ATR (Average True Range) filter to help ensure trades are taken during periods of adequate market volatility and includes a cooldown mechanism to prevent rapid, successive signals in the same direction. Trade exits are primarily handled by reversing signals.
How It Works:
1. Signal Initiation (e.g., 5-Minute Timeframe):
Long Signal Wait: A potential long entry is considered when the 5-minute Stochastic RSI %K line crosses above its %D line, AND the %K value at the time of the cross is at or below a user-defined oversold level (default: 30).
Short Signal Wait: A potential short entry is considered when the 5-minute Stochastic RSI %K line crosses below its %D line, AND the %K value at the time of the cross is at or above a user-defined overbought level (default: 70). When these conditions are met, the strategy enters a "waiting state" for confirmation from the 15-minute timeframe.
2. Signal Confirmation (15-Minute Timeframe):
Once in a waiting state, the strategy looks for confirmation on the 15-minute Stochastic RSI within a user-defined number of 5-minute bars (wait_window_5min_bars, default: 5 bars).
Long Confirmation:
The 15-minute Stochastic RSI %K must be greater than or equal to its %D line.
The 15-minute Stochastic RSI %K value must be below a user-defined threshold (stoch_15min_long_entry_level, default: 40).
Short Confirmation:
The 15-minute Stochastic RSI %K must be less than or equal to its %D line.
The 15-minute Stochastic RSI %K value must be above a user-defined threshold (stoch_15min_short_entry_level, default: 60).
3. Filters:
ATR Volatility Filter: If enabled, trades are only confirmed if the current ATR value (converted to ticks) is above a user-defined minimum threshold (min_atr_value_ticks). This helps to avoid taking signals during periods of very low market volatility. If the ATR condition is not met, the strategy continues to wait for the condition to be met within the confirmation window, provided other conditions still hold.
Signal Cooldown Filter: If enabled, after a signal is generated, the strategy will wait for a minimum number of bars (min_bars_between_signals) before allowing another signal in the same direction. This aims to reduce overtrading.
4. Entry and Exit Logic:
Entry: A strategy.entry() order is placed when all trigger, confirmation, and filter conditions are met.
Exit: This strategy primarily uses reversing signals for exits. For example, if a long position is open, a confirmed short signal will close the long position and open a new short position. There are no explicit take profit or stop loss orders programmed into this version of the script.
Key User-Adjustable Parameters:
Stochastic RSI Parameters: RSI Length, Stochastic RSI Length, %K Smoothing, %D Smoothing.
Signal Trigger & Confirmation:
5-minute %K trigger levels for long and short.
15-minute %K confirmation thresholds for long and short.
Wait window (in 5-minute bars) for 15-minute confirmation.
Filters:
Enable/disable and configure the Signal Cooldown filter (minimum bars between signals).
Enable/disable and configure the ATR Volatility filter (ATR period, minimum ATR value in ticks).
Strategy Parameters:
Leverage Multiplier (Note: This primarily affects theoretical position sizing for backtesting calculations in TradingView and does not simulate actual leveraged trading risks).
Recommendations for Users:
Thorough Backtesting: Test this strategy extensively on historical data for the instruments and timeframes you intend to trade.
Parameter Optimization: Experiment with different parameter settings to find what works best for your trading style and chosen markets. The default values are starting points and may not be optimal for all conditions.
Understand the Logic: Ensure you understand how each component (Stochastic RSI on different timeframes, ATR filter, cooldown) interacts to generate signals.
Risk Management: Since this version does not include explicit stop-loss orders, ensure you have a clear risk management plan in place if trading this strategy live. You might consider manually adding stop-loss orders through your broker or using TradingView's separate strategy order settings for stop-loss if applicable.
Disclaimer:
This strategy description is for informational purposes only and does not constitute financial advice. Past performance is not indicative of future results. Trading involves significant risk of loss. Always do your own research and understand the risks before trading.

Dynamic and ATR Supertrend**Dynamic and ATR Supertrend Indicator**
The Dynamic and ATR Supertrend indicator is a powerful tool for traders who want to identify trends and make informed decisions about their investments. This indicator combines the benefits of the Supertrend indicator with the dynamic multiplier adjustment and ATR (Average True Range) calculation to provide a more accurate and reliable trend identification system.
**Key Features:**
* **Dynamic Multiplier Adjustment:** The indicator uses a dynamic multiplier adjustment to adapt to changing market conditions. This ensures that the indicator remains sensitive to trend changes and provides accurate signals.
* **ATR Calculation:** The indicator uses the ATR (Average True Range) calculation to determine the volatility of the market. This helps to identify the optimal multiplier value for the Supertrend calculation.
* **Supertrend Calculation:** The indicator uses the Supertrend calculation to identify trends and provide buy and sell signals.
* **Higher Timeframe Analysis:** The indicator allows for higher timeframe analysis, which enables traders to identify trends and make decisions based on a broader market perspective.
* **Alert System:** The indicator includes an alert system that notifies traders of trend changes and price crosses, allowing them to make timely and informed decisions.
**How it Works:**
1. The indicator calculates the ATR (Average True Range) of the market to determine the volatility.
2. The indicator uses the dynamic multiplier adjustment to adapt to changing market conditions.
3. The indicator calculates the Supertrend value using the ATR and dynamic multiplier.
4. The indicator identifies trends and provides buy and sell signals based on the Supertrend value.
5. The indicator includes an alert system that notifies traders of trend changes and price crosses.
**Benefits:**
* **Improved Trend Identification:** The indicator provides a more accurate and reliable trend identification system, allowing traders to make informed decisions.
* **Adaptability:** The indicator adapts to changing market conditions, ensuring that it remains sensitive to trend changes and provides accurate signals.
* **Flexibility:** The indicator allows for higher timeframe analysis, enabling traders to identify trends and make decisions based on a broader market perspective.
* **Alert System:** The indicator includes an alert system that notifies traders of trend changes and price crosses, allowing them to make timely and informed decisions.
**Conclusion:**
The Dynamic and ATR Supertrend indicator is a powerful tool for traders who want to identify trends and make informed decisions about their investments. With its dynamic multiplier adjustment, ATR calculation, and Supertrend calculation, this indicator provides a more accurate and reliable trend identification system. The indicator's adaptability, flexibility, and alert system make it an essential tool for traders who want to stay ahead of the market and make profitable trades.

ZenLab ATR FNSThis indicator was created specifically for Zen Labs which includes a custom ATR (Average True Range) table that displays the ATR value for a selected period of candles.
ATR is a volatility indicator that measures the average range between high and low prices over a given number of periods. It helps traders assess how much an asset typically moves, providing valuable information for setting stop losses, take profits, or identifying market conditions. It adapts to changing market conditions, making it useful across different timeframes and asset classes.
How the ATR Indicator Works:
The ATR is based on the concept of True Range (TR), which is the greatest of the following three values:
- Current High minus Current Low
- Absolute value of Current High minus Previous Close
- Absolute value of Current Low minus Previous Close
Averaging the True Range:
Once the True Range is calculated for each period, the ATR is computed by averaging these True Ranges over a set number of periods and is displayed in the table.
Interpreting the ATR:
- A higher ATR value indicates higher volatility—prices are moving more significantly.
- A lower ATR value indicates lower volatility—prices are more stable and less active.
Enjoy!
- Rebel Empire

Dynamic Volatility Heatmap (ATR)How the Script Works
Dynamic Thresholds:
atrLow and atrHigh are calculated as percentiles (20% and 80% by default) of ATR values over the last double the ATR period (28 days if ATR is 14).
This creates thresholds that adapt to recent market conditions.
Background Heatmap:
Green: ATR is below the low threshold, indicating calm markets (options are cheap).
Red: ATR is above the high threshold, signaling elevated volatility (options are expensive).
Yellow: ATR is within the normal range, showing neutral market conditions.
Overlay Lines:
]Dynamic lines for atrLow and atrHigh help visualize thresholds on the chart.
Interpretation for Trading
Green Zone (Low ATR):
Interpretation: The market is calm, and options are likely underpriced.
Trade Setup: Favor buying options (e.g., long straddles or long calls/puts) to profit from potential volatility increases.
Red Zone (High ATR):
Interpretation: The market is volatile, and options are likely overpriced.
Trade Setup: Favor selling options (e.g., credit spreads or iron condors) to benefit from volatility decay.
Yellow Zone (Neutral ATR):
Interpretation: Volatility is within typical levels, offering no strong signal.
Trade Setup: Combine with other indicators, such as gamma levels or Bollinger Bands, for confirmation.
5. Enhancing with Other Indicators
Combine with Bollinger Bands:
Overlay Bollinger Bands to identify price extremes and align them with volatility heatmap signals.

Custom ATR with Paranormal Bar FilterCustom ATR with Paranormal Bar Filter
Description:
This indicator calculates a custom ATR (Average True Range) by filtering out bars with unusually large or small price ranges. It helps provide a more accurate measure of market volatility by ignoring outliers.
How it works:
True Range Calculation:
The price range for each bar is calculated.
Bars with ranges much larger or smaller than typical are excluded.
Filtered ATR:
The ATR is calculated using only the bars that pass the filter.
Current Bar Progress:
Measures how much the current bar has moved compared to the filtered ATR, based on the difference between its opening and closing prices.
Display:
A line represents the filtered ATR.
A table shows the filtered ATR, the current bar's range, and its progress relative to the ATR.
Input Settings:
ATR Period: Number of bars used to calculate the ATR.
Filter Window: Number of recent bars used to determine the typical range.
Filter Threshold: Sensitivity of the filter. A higher value allows more bars to pass.
How to Use:
Monitor Volatility:
Use the filtered ATR to understand market volatility while ignoring unusual price movements.
Track Current Bar Progress:
See how much of the ATR the current bar has completed.
Adjust Filter Settings:
Fine-tune the filter to match your trading timeframe and strategy.
This indicator is designed for traders who want to track market volatility without being misled by extreme outlier bars.

Delta Volume-ATR ChangeDelta Volume-ATR Change Indicator
The Delta Volume-ATR Change Indicator is designed to analyze the effectiveness of volume in relation to price volatility by comparing the percentage change in volume with the percentage change in ATR over the last two bars. This indicator provides insights into how volume changes impact price movement, allowing traders to gauge the strength or weakness of market momentum based on volume efficiency.
Formula:
% Volume Change = (Volume - Volume ) / Volume * 100
% ATR Change = (ATR - ATR ) / ATR * 100
Delta = % Volume Change - % ATR Change
The result, Delta, shows the difference between the volume change and ATR change, with positive delta indicating a stronger volume impact and negative delta suggesting weaker volume support relative to price movement.
Features:
Multiple Display Styles: Choose from three visualization styles — Histogram, Line, or Columns — to display delta values in a way that best fits your analysis style.
Delta Smoothing: The smoothed Delta line (using an SMA with customizable length) provides a clearer trend of volume efficiency over time.
Color Coding: Delta bars change color based on direction — green for positive values and red for negative, allowing for quick visual assessment of volume effectiveness.
Applications:
Identify market conditions where high volume is driving price effectively (positive Delta).
Detect instances of low volume efficiency, where price changes may not be fully supported by volume (negative Delta).
Useful for short-term and swing traders looking to understand volume patterns in relation to volatility.
This indicator is a valuable tool for traders seeking to gain insights into volume and volatility interplay, helping improve timing and reliability in market entries and exits.

Trend Magic Enhanced [AlgoAlpha]🔥✨ Trend Magic Enhanced - Boost Your Trend Analysis! 🚀📈
Introducing the Trend Magic Enhanced indicator by AlgoAlpha, a powerful tool designed to help you identify market trends with greater accuracy. This advanced indicator combines the Commodity Channel Index (CCI) and Average True Range (ATR) to calculate dynamic support and resistance levels, known as the Trend Magic. By smoothing the Trend Magic with various moving average types, this indicator provides clearer trend signals and helps you make more informed trading decisions.
Key Features :
🎯 Unique Trend Identification : Combines CCI and ATR to detect market trends and potential reversals.
🔄 Customizable Smoothing : Choose from SMA, EMA, SMMA, WMA, or VWMA to smooth the Magic Trend for clearer signals.
🎨 Flexible Appearance Settings : Customize colors for bullish and bearish trends to suit your charting preferences.
⚙️ Adjustable Parameters : Modify CCI period, ATR period, ATR multiplier, and smoothing length to align with your trading strategy.
🔔 Alert Notifications : Set alerts for trend shifts to stay ahead of market movements.
📈 Visual Signals : Displays trend direction changes directly on the chart with up and down arrows.
Quick Guide to Using the Trend Magic Enhanced Indicator
🛠 Add the Indicator : Add the indicator to your chart by pressing the star icon to add it to favorites. Customize settings such as CCI period, ATR multiplier, ATR period, smoothing options, and colors to match your trading style.
📊 Analyze the Chart : Observe the Trend Magic line and the color-coded trend signals. When the Trend Magic line turns bullish (e.g., green), it indicates an upward trend, and when it turns bearish (e.g., red), it indicates a downward trend. Use the visual arrows to spot trend direction changes.
🔔 Set Alerts : Enable alerts to receive notifications when a trend shift is detected, so you can act promptly on trading opportunities without constantly monitoring the chart.
How It Works:
The Trend Magic Enhanced indicator integrates the Commodity Channel Index (CCI) and Average True Range (ATR) to calculate a dynamic Trend Magic line. By adjusting price levels based on CCI values—upward when CCI is positive and downward when negative—and factoring in ATR for market volatility, it creates adaptive support and resistance levels. Optionally smoothed with various moving averages to reduce noise, the indicator changes line color based on trend direction, highlights trend changes with arrows, and provides alerts for significant shifts, aiding traders in identifying potential entry and exit points.
Enhancements Over the Original Trend Magic Indicator
The Trend Magic Enhanced indicator significantly refines the trend identification method of the original Trend Magic script by introducing customizable smoothing options and additional analytical features. While the original indicator determines trend direction solely based on the Commodity Channel Index (CCI) crossing above or below zero and adjusts the Magic Trend line using the Average True Range (ATR), the enhanced version allows users to smooth the Magic Trend line with various moving average types (SMA, EMA, SMMA, WMA, VWMA). This smoothing reduces market noise and provides clearer trend signals. Additionally, the enhanced indicator incorporates price action analysis by detecting crossovers and crossunders of price with the Magic Trend line, and it visually marks trend changes with up and down arrows on the chart. These improvements offer a more responsive and accurate trend detection compared to the original method, enabling traders to identify potential entry and exit points more effectively.
Enhance your trading strategy with the Trend Magic Enhanced indicator by AlgoAlpha and gain a clearer perspective on market trends! 🌟📈

Fair Value Gap (FVG) Oscillator [UAlgo]The "Fair Value Gap (FVG) Oscillator " is designed to identify and visualize Fair Value Gaps (FVG) within a given lookback period on a trading chart. This indicator helps traders by highlighting areas where price gaps may signify potential trading opportunities, specifically bullish and bearish patterns. By leveraging volume and Average True Range (ATR) data, the FVG Oscillator aims to enhance the accuracy of pattern recognition and provide more reliable signals for trading decisions.
🔶 Identification of Fair Value Gap (FVG)
Fair Value Gaps (FVG) are specific price areas where gaps occur, and they are often considered significant in technical analysis. These gaps can indicate potential future price movements as the market may return to fill these gaps. This indicator identifies two types of FVGs:
Bullish FVG: Occurs when the current low price is higher than the high price two periods ago. This condition suggests a potential upward price movement.
Obtains with:
low > high
Bearish FVG: Occurs when the current high price is lower than the low price two periods ago. This condition suggests a potential downward price movement.
Obtains with:
high < low
The FVG Oscillator not only identifies these gaps but also verifies them using volume and ATR conditions to ensure more reliable trading signals.
🔶 Key Features
Lookback Period: Users can set the lookback period to determine how far back the indicator should search for FVG patterns.
ATR Multiplier: The ATR Multiplier is used to adjust the sensitivity of the ATR-based conditions for verifying FVG patterns.
Volume SMA Period: This setting determines the period for the Simple Moving Average (SMA) of the volume, which helps in identifying high volume conditions.
Why ATR and Volume are Used?
ATR (Average True Range) and volume are integrated into the Fair Value Gap (FVG) Oscillator to enhance the accuracy and reliability of the identified patterns. ATR measures market volatility, helping to filter out insignificant price gaps and focus on impactful ones, ensuring that the signals are relevant and strong. Volume, on the other hand, confirms the strength of price movements. High volume often indicates the sustainability of these movements, reducing the likelihood of false signals. Together, ATR and volume ensure that the detected FVGs are both significant and supported by market activity, providing more trustworthy trading signals.
Normalized Values: The FVG counts are normalized to enhance the visual representation and interpretation of the patterns on the chart.
Visual Customization and Plotting: Users can customize the colors for positive (bullish) and negative (bearish) areas, and choose whether to display these areas on the chart, also plots the bullish and bearish FVG counts, a zero line, and the net value of FVG counts. Additionally, it uses histograms to display the width of verified bullish and bearish patterns.
🔶 Disclaimer:
Use with Caution: This indicator is provided for educational and informational purposes only and should not be considered as financial advice. Users should exercise caution and perform their own analysis before making trading decisions based on the indicator's signals.
Not Financial Advice: The information provided by this indicator does not constitute financial advice, and the creator (UAlgo) shall not be held responsible for any trading losses incurred as a result of using this indicator.
Backtesting Recommended: Traders are encouraged to backtest the indicator thoroughly on historical data before using it in live trading to assess its performance and suitability for their trading strategies.
Risk Management: Trading involves inherent risks, and users should implement proper risk management strategies, including but not limited to stop-loss orders and position sizing, to mitigate potential losses.
No Guarantees: The accuracy and reliability of the indicator's signals cannot be guaranteed, as they are based on historical price data and past performance may not be indicative of future results.

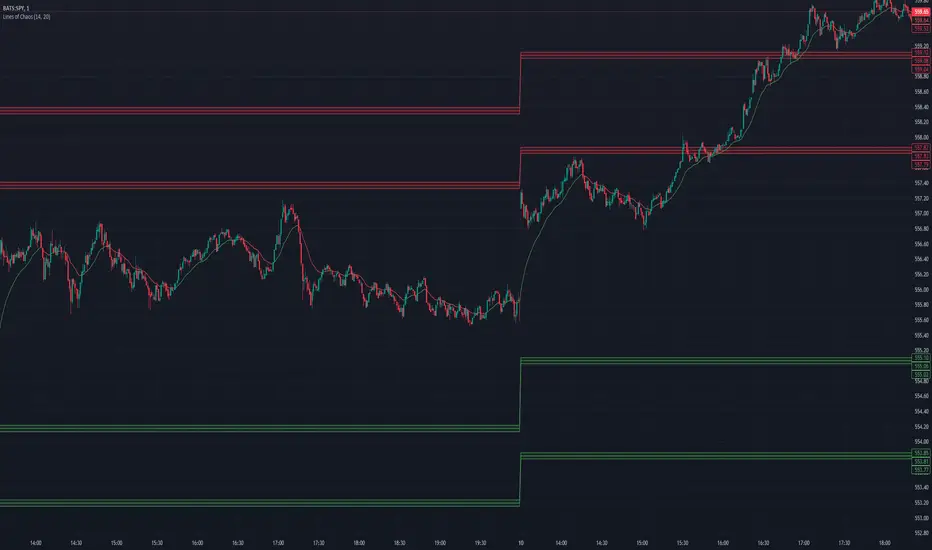
Lines of Chaos (ATR/ADR Levels)Lines of Chaos Indicator
This script is designed to provide traders with ATR (Average True Range) and ADR (Average Daily Range) support and resistance levels.
How it Works:
Support and Resistance Lines: The script plots ATR/ADR-based support and resistance lines based on a moving average of the last ATR/ADR Length days, the previous day's close, and the current day's open. Changing the ATR/ADR Length value changes the number of days of data to average.
EMA: The EMA is colored red when the ticker is potentially bearish. The EMA is colored green when the ticker is potentially bullish. Changing the EMA Length changes the number of data bars to average.
Default Settings: The default settings are optimized for most trading environments.
Key Features:
ATR & ADR Calculation: You can use ATR, ADR, or both. ATR is recommended for most scenarios.
Customizable Lengths: Adjust the ATR/ADR Length to refine the average calculation to your preference, with 14 being the standard value.
EMA for Market Bias: The EMA helps determine the ticker bias. It is colored green when the market is above the average price and red when below. This allows you to more easily determine whether or not the ADR/ATR levels are valid.
Versatile Usage: Suitable for various trading types, ensuring broad applicability across different market conditions.
How to Use:
Bounces off Levels: When the price bounces off a support/resistance level, the price will likely respect this level. This indicates that the price is unlikely to exceed the ticker's average volatility.
Breakthroughs of Levels: When the price breaks through a support/resistance level, the price will likely continue beyond this level. This indicates that the price has moved beyond that ticker's average volatility.
[EKIN] ATR Exit StrategyMy exit strategy to reduce risk via tracking price and ATR. Sets new STOP price based on how many ATR is current price above from the entry price.
I only check 5 and 20 EMAs for entry strategy. I intentionally used a simple entry strategy to further test the impact of this exit strategy.
First sets STOP at 1.5 ATR below the entry price.
If there is a 2 ATR increase, pulls STOP to the entry point to eliminate the possibility of loss.
If there is a 3 ATR increase, takes a 50% profit and moves STOP to 1 ATR above the entry price.
If there is a 4 ATR increase, moves STOP to 2 ATR above the entry price.
If there is a 5 ATR increase, moves STOP to 3 ATR above the entry price.
.
.
.
This is my first strategy attempt so I am open to any recommendations. I am planning to update this strategy overtime when I get better at pinescript and trading in general

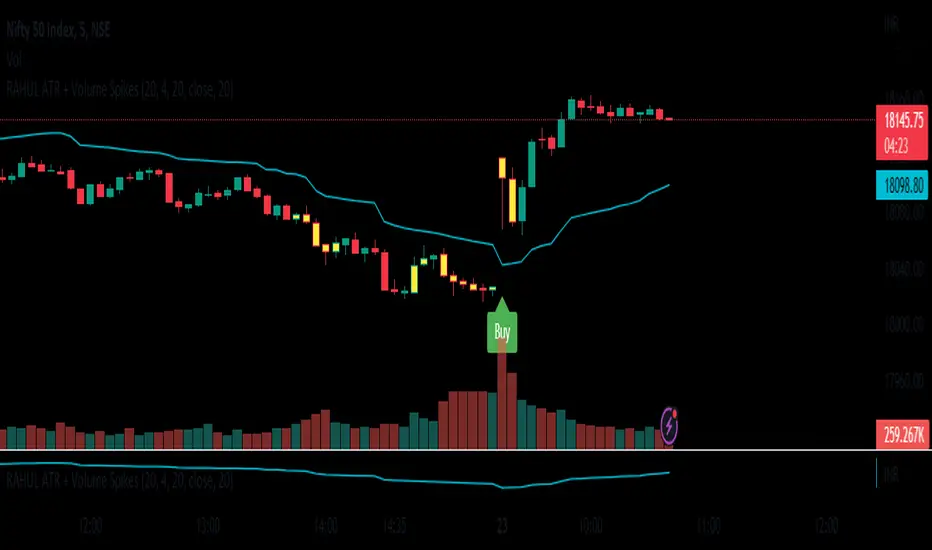
RAHUL ATR + Volume SpikesNew Volume Spikes Strategy.
The Average True Range (ATR) indicator is a technical analysis tool that measures the volatility of an asset. It can be used to create a trading strategy by identifying periods of high volatility and making trades based on those conditions.
Here is an example of a simple ATR trading strategy:
Calculate the ATR for the asset you are trading. This can typically be done using a charting platform or software.
Identify the average ATR over a period of time (such as 14 days). This will be your "threshold" for determining high volatility.
When the current ATR is above the threshold, enter a long position (buy) in the asset.
When the current ATR is below the threshold, exit the long position (sell) and wait for the next period of high volatility.
Repeat the process for the next period of time.
This is a basic example of an ATR strategy and can be adjusted as per one's preference, you can add other indicators or market conditions to filter out trades and also use different time frame to check the ATR values. ATR can also be used in combination with other indicators and strategies to improve the accuracy of your trades.
It's always important to backtest any strategy before actually trading with real money, and also to consider the risk management, stop loss and profit taking levels, and adjust the strategy accordingly
Higher Time Frame Average True RangesPurpose: This script will help an options trader asses risk and determine good entry and exit strategies
Background Information: The true range is the greatest of: current high minus the current low; the absolute value of the current high minus the previous close; and the absolute value of the current low minus the previous close. The Average True Range (ATR) is a 14-day moving average of the true range. Traders use the ATR indicator to assess volatility in stocks and decide when to enter and exit trades. It is important to note the limitations of using True Range and ATR: These indications cannot tell you the direction of your options trade (call vs. put) and they cannot tell you whether a particular trend is about to reverse. However, it can be used to assess if volatility has peaked for a particular direction and time period.
How this script works: This indicator calculates true range for the daily (DTR), weekly (WTR), and monthly (MTR) time frames and compares it to the Average True Range (ATR) for each of those time frames (DATR, WATR, and MATR). The comparison is displayed into a colored table in the upper right-hand corner of the screen. When a daily, weekly, or monthly true range reaches 80% of its respective ATR, the row for that time frame will turn Orange indicating medium risk for staying in the trade. If the true range goes above 100% of the respective ATR, then the row will turn Red indicating high risk for staying in the trade. When the row for a time period turns red, volatility for the time period has likely peaked and traders should heavily consider taking profits. It is important to note these calculations start at different times for each time frame: Daily (Today’s Open), Weekly (Monday’s Open), Monthly (First of the Month’s Open). This means if it’s the 15th of the month then the Monthly True Range is being calculated for the trading days in the first half of the month (approximately 10 trade days).
The script also plots three sets of horizontal dotted lines to visually represent the ATR for each time period. Each set is generated by adding and subtracting the daily, weekly, and monthly ATRs from that time periods open price. For example, the weekly ATR is added and subtracted from Mondays open price to visually represent the true range for that week. The DATR is represented by red lines, the WATR is represented by the green lines, and the MATR is represented by the blue lines. These plots could also be used to assess risk as well.
How to use this script: Use the table to assess risk and determine potential exit strategies (Green=Low Risk, Orange=Medium Risk, Red=High Risk. Use the dotted lines to speculate what a stock’s price could be in a given time period (Daily=Red, Weekly=Green, and Monthly=Blue). And don’t forget the true range’s calculation and plots starts at the beginning of each time period!

ER-Adaptive ATR, STD-Adaptive Damiani Volatmeter [Loxx]ER-Adaptive ATR, STD-Adaptive Damiani Volatmeter is a Damiani Volatmeter with both Efficiency-Ratio Adaptive ATR, used in place of ATR, and Adaptive Deviation, used in place of Standard Deviation.
What is Adaptive Deviation?
By definition, the Standard Deviation (STD, also represented by the Greek letter sigma σ or the Latin letter s) is a measure that is used to quantify the amount of variation or dispersion of a set of data values. In technical analysis we usually use it to measure the level of current volatility .
Standard Deviation is based on Simple Moving Average calculation for mean value. This version of standard deviation uses the properties of EMA to calculate what can be called a new type of deviation, and since it is based on EMA , we can call it EMA deviation. And added to that, Perry Kaufman's efficiency ratio is used to make it adaptive (since all EMA type calculations are nearly perfect for adapting).
The difference when compared to standard is significant--not just because of EMA usage, but the efficiency ratio makes it a "bit more logical" in very volatile market conditions.
The green line is the Adaptive Deviation, the white line is regular Standard Deviation. This concept will be used in future indicators to further reduce noise and adapt to price volatility .
See here for a comparison between Adaptive Deviation and Standard Deviation
What is Efficiency Ratio Adaptive ATR?
Average True Range (ATR) is widely used indicator in many occasions for technical analysis . It is calculated as the RMA of true range. This version adds a "twist": it uses Perry Kaufman's Efficiency Ratio to calculate adaptive true range
See here for a comparison between Efficiency-Ratio Adaptive ATR, and ATR.
What is the Damiani Volatmeter?
Damiani Volatmeter uses ATR and Standard deviation to tease out ticker volatility so you can better understand when it's the ideal time to trade. The idea here is that you only take trades when volatility is high so this indicator is to be coupled with various other indicators to validate the other indicator's signals. This is also useful for detecting crabbing and chopping markets.
Shoutout to user @xinolia for the DV function used here.
Anything red means that volatility is low. Remember volatility doesn't have a direction. Anything green means volatility high despite the direction of price. The core signal line here is the green and red line that dips below two while threshold lines to "recharge". Maximum recharge happen when the core signal line shows a yellow ping. Soon after one or many yellow pings you should expect a massive upthrust of volatility . The idea here is you don't trade unless volatility is rising or green. This means that the Volatmeter has to dip into the recharge zone, recharge and then spike upward. You can also attempt to buy or sell reversals with confluence indicators when volatility is in the recharge zone, but I wouldn't recommend this. However, if you so choose to do this, then use the following indicator for confluence.
And last reminder, volatility doesn't have a direction! Red doesn't mean short, and green doesn't mean long, Red means don't trade period regardless of direction long/short, and green means trade no matter the direction long/short. This means you'll have to add an indicator that does show direction such as a mean reversion indicator like Fisher Transform or a Gaussian Filter. You can search my public scripts for various Fisher Transform and Gaussian Filter indicators.
Price-Filtered Spearman Rank Correl. w/ Floating Levels is considered the Mercedes Benz of reversal indicators
Comparison between this indicator, ER-Adaptive ATR, STD-Adaptive Damiani Volatmeter , and the regular Damiani Volatmeter . Notice that the adaptive version catches more volatility than the regular version.
How signals work
RV = Rising Volatility
VD = Volatility Dump
Plots
White line is signal
Thick red/green line is the Volatmeter line
The dotted lower lines are the zero line and minimum recharging line
Included
Bar coloring
Alerts
Signals
Related indicators
Variety Moving Average Waddah Attar Explosion (WAE)
Damiani Volatmeter

TAExtLibrary "TAExt"
Indicator functions can be used in other indicators and strategies. This will be extended by time with indicators I use in my strategies and studies.
atrwo(length, stdev_length, stdev_mult) ATR without outliers
Parameters:
length : The length of the ATR
stdev_length : The length of the standard deviation, used for detecting outliers
stdev_mult : The multiplier of the standard deviation, used for detecting outliers
Returns: The ATR value
atrwma(src, period, type, atr_length, stdev_length, stdev_mult) ATR without outlier weighted moving average
Parameters:
src : The source of the moving average
period : The period of the moving average
type : The type of the moving average, possible values: SMA, EMA, RMA
atr_length : The length of the ATR
stdev_length : The length of the standard deviation, used for detecting outliers
stdev_mult : The multiplier of the standard deviation, used for detecting outliers
Returns: The moving average value
jma(src, period, phase, power) Jurik Moving Average
Parameters:
src : The source of the moving average
period : The period of the moving average calculation
phase : The phase of jurik MA calculation (-100..100)
power : The power of jurik MA calculation
Returns: The Jurik MA series
anyma(src, period, type, offset, sigma, phase, power) Moving Average by type
Parameters:
src : The source of the moving average
period : The period of the moving average calculation
type : The type of the moving average
offset : Used only by ALMA, it is the ALMA offset
sigma : Used only by ALMA, it is the ALMA sigma
phase : The phase of jurik MA calculation (-100..100)
power : The power of jurik MA calculation
Returns: The moving average series
wae(macd_src, macd_fast_length, macd_slow_length, macd_sensitivity, bb_base_src, bb_upper_src, bb_lower_src, bb_length, bb_mult, dead_zone_length, dead_zone_mult) Waddah Attar Explosion (WAE)
Parameters:
macd_src : The source series used by MACD
macd_fast_length : The fast MA length of the MACD
macd_slow_length : The slow MA length of the MACD
macd_sensitivity : The MACD diff multiplier
bb_base_src : The source used by stdev
bb_upper_src : The source used by the upper Bollinger Band
bb_lower_src : The source used by the lower Bollinger Band
bb_length : The lenth for Bollinger Bands
bb_mult : The multiplier for Bollinger Bands
dead_zone_length : The ATR length for dead zone calculation
dead_zone_mult : The ATR multiplier for dead zone
Returns:
ssl(length, high_src, low_src) Semaphore Signal Level channel (SSL)
Parameters:
length : The length of the moving average
high_src : Source of the high moving average
low_src : Source of the low moving average
Returns:
adx(atr_length, di_length, adx_length, high_src, low_src, atr_ma_type, di_ma_type, adx_ma_type) Average Directional Index + Direction Movement Index (ADX + DMI)
Parameters:
atr_length : The length of ATR
di_length : DI plus and minus smoothing length
adx_length : ADX smoothing length
high_src : Source of the high moving average
low_src : Source of the low moving average
atr_ma_type : MA type of the ATR calculation
di_ma_type : MA type of the DI calculation
adx_ma_type : MA type of the ADX calculation
Returns:
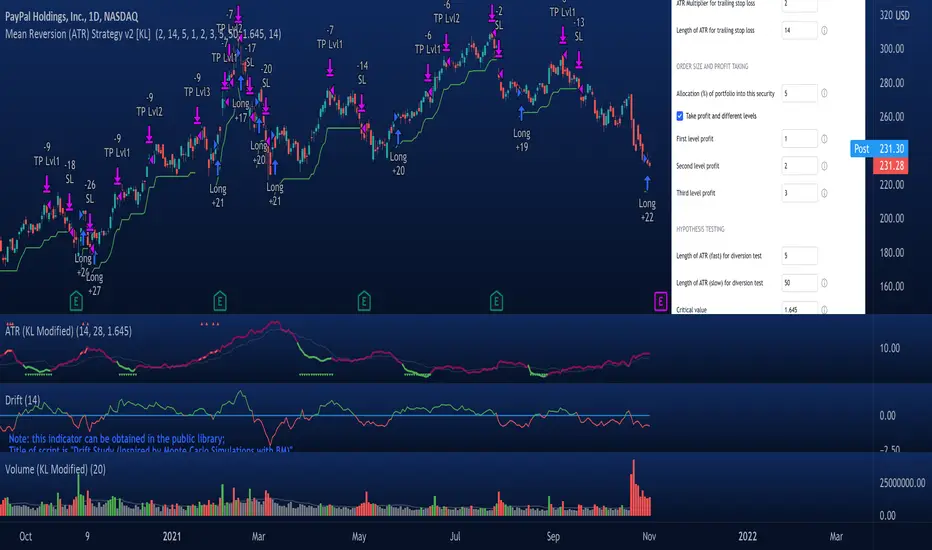
Mean Reversion Strategy v2 [KL]Description :
This strategy will enter a position when the following conditions are met:
a) Main signal: When source data (ATR) diverts from its moving average value, and
b) Confirmation: If predicted direction of trend is favorable.
Assumptions :
During periods of high price volatility, ATR diverts from its moving average value. Eventually, ATR should revert. But since just knowing the magnitude of increase/decrease of ATR does not indicate a trend signal, we need to introduce a model to predict the current trend.
In short:
• Trend Prediction : This strategy calculates the expected logarithmic return of the security (the "Drift") and considers prices to be moving in uptrend if the drift curve is upward sloping.
• Assessment of ATR diversion : To determine "yes/no" regarding whether ATR at a given point in time has diverted, this script conducts a two-tailed hypothesis test at each candlestick period. The null hypothesis (H0) is that the fast moving average value should equal the slow moving average value (say, denoted as H0: atr14 == atr28; it is assumed that atr28 is more meaningful for the purpose of describing the current trend because it has a larger sample size). Investopedia has an article summarizing this topic .
Exit Condition :
When trailing stop loss hits.
Previous version :
This strategy is based on Version 1 published back in September . This older version considers +/- one standard deviation to be the critical values relative to average ATR when testing whether ATR has diverted from the mean. This does not take Standard Error ("SE") into account. As a result, the threshold is often too wide and it generates too many entry signals.