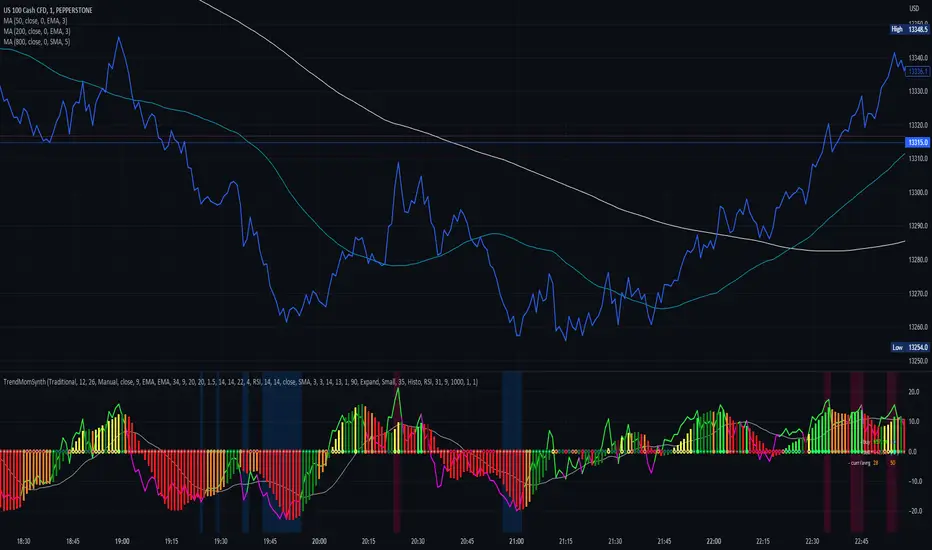
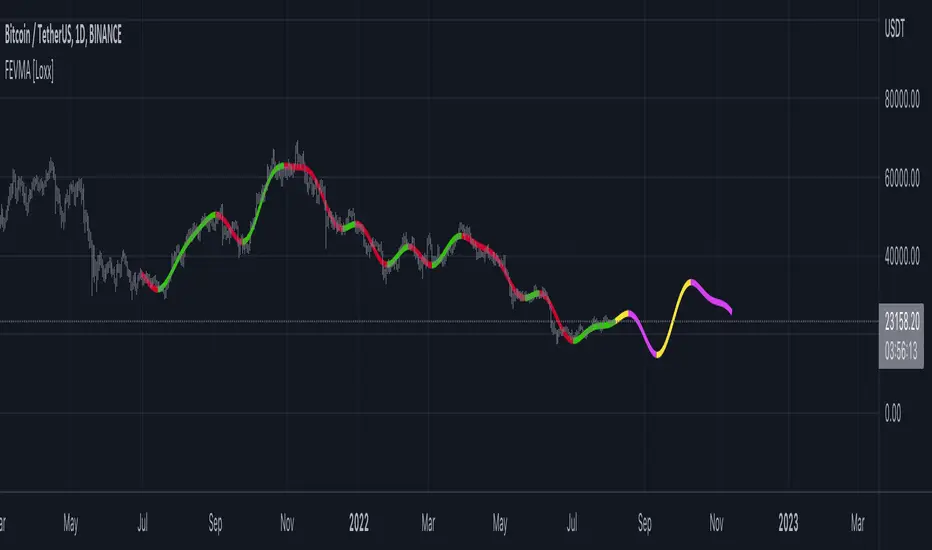
Volume Cluster Profile [VCP] (Zeiierman)█ Overview
Volume Cluster Profile (Zeiierman) is a volume profile tool that builds cluster-enhanced volume-by-price maps for both the current market window and prior swing segments.
Instead of treating the profile as a raw histogram only, VCP detects the dominant volume peaks (clusters) inside the profile, then uses a Gaussian spread model to “radiate” those peaks into surrounding price bins. This produces a smoother, more context-aware profile that highlights where volume is most meaningfully concentrated, not just where it happened to print.
On top of the live profile, VCP automatically records historical swing profiles between pivots, wraps each segment for clarity, and can project the most recent segment’s High/Low Value extensions (VA/LV) forward to the current bar to keep key structure visible as price evolves.
█ How It Works
⚪ 1) Profile Construction (Volume-by-Price)
VCP builds a volume profile histogram over a chosen window (current lookback, or a swing segment):
Range Scan
The script finds the full min → max price range inside the window.
Bin the Range
That range is divided into a user-defined number of Price Bins (rows). More bins = finer detail, but heavier computation.
Accumulate Volume into Bins
For each bar inside the window, the script takes the bar’s close price, determines which price bin it belongs to, and adds the bar’s volume to that bin.
float step = (maxPrice - minPrice) / binsCount
for i = 0 to barsToUse - 1
int b = f_clamp(int(math.floor((close - minPrice) / step)), 0, binsCount - 1)
volBins += volume
Result: volBins becomes a standard volume-by-price histogram (close-based binning).
⚪ 2) Cluster Detection (Finding Dominant Peaks)
Once the raw histogram is built, VCP identifies cluster centers as the most meaningful volume “hills”:
Local Peak Test
A bin becomes a cluster candidate if its volume is greater than or equal to its immediate neighbors (left/right).
Filter Weak Peaks
Peaks must also be above a basic activity threshold (relative to the average bin volume) to avoid noise.
bool isPeak = v >= left and v >= right
if isPeak and v > avgVol
array.push(clusterIdxs, b)
Keep the Best Peaks Only
If too many peaks exist, the script keeps only the strongest ones, capped by: Max Cluster Centers
Result: clusterIdxs = the set of dominant profile peaks (cluster centers).
⚪ 3) Cluster Enhancement (Gaussian Spread Model)
This is what makes VCP different from a raw profile.
Instead of using volBins directly, the script builds an enhanced profile where each cluster center influences nearby price bins using a Gaussian curve:
Distance from each bin to each cluster center is computed in “bin units”
A Gaussian weight is applied so that bins near the center receive stronger influence, while bins farther away decay smoothly.
Cluster Spread (sigma) controls how wide this influence reaches: low sigma produces tight, sharp clusters, while high sigma results in wider, smoother structure zones.
enhanced += centerV * math.exp(-(dist*dist) / (2.0 * clusterSigma * clusterSigma))
volBinsAI := enhanced / szClFinal
Result: volBinsAI = the cluster-enhanced volume value for each bin.
In practice, VCP turns the profile into a structure map of dominant volume concentrations, rather than a simple “where volume printed” histogram.
⚪ 4) POC from the Enhanced Profile
After enhancement:
The bin with the highest volBinsAI becomes the POC (Point of Control)
POC is plotted at the midpoint price of that bin
if volBinsAI > maxVol
maxVol := volBinsAI , pocBin := b
So the POC reflects the cluster-enhanced profile rather than the raw histogram.
█ How to Use
⚪ Read Cluster Structure (Default = 2 Clusters)
By default, the Volume Cluster Profile (VCP) is configured to detect up to 2 dominant volume clusters within the profile. These clusters represent price zones where the market accepted trading activity, not just where volume printed randomly.
⚪ When TWO Clusters Appear
When VCP detects two distinct clusters, it usually indicates:
Two competing areas of value
Ongoing auction between higher and lower acceptance zones
Treat each cluster as an acceptance zone
Expect slower price action and rotation inside clusters
Expect faster movement in the low-volume space between clusters
Use cluster-to-cluster movement as:
rotation targets
range boundaries
acceptance vs rejection tests
Typical behavior:
Price enters a cluster → stalls, consolidates, rotates
Price rejects at cluster edge → moves toward the opposite cluster
⚪ When ONLY ONE Cluster Appears
If VCP detects only one cluster, or if two clusters visually merge into one:
Volume is no longer split
The market has formed a single dominant value area
Price consensus is strong
Treat the cluster as the primary value anchor
Expect pullbacks and reactions around this zone
Bias becomes directional:
Above the cluster → bullish context
Below the cluster → bearish context
Inside the cluster → balance/chop
This structure often appears during clean trends or stable equilibria.
⚪ VA/LV Extensions
VCP projects two zones from the end of the most recent swing segment:
VA extension = the segment’s highest enhanced-volume bin (dominant zone)
LV extension = the segment’s lowest enhanced-volume bin (thin/weak zone)
A breakout of the VA extension signals acceptance and potential continuation. A retest of the VA or LV extension is used to confirm acceptance or rejection, while rejection from either zone often leads to rotation back toward value.
█ Settings
Cluster Volume Profile
Lookback Bars – how many recent bars build the current profile
Price Bins – profile resolution (more bins = more detail, heavier CPU)
Cluster Spread – Gaussian sigma; higher values widen/smooth cluster influence
Max Cluster Centers – cap on detected peaks used in enhancement
Historical Swing Cluster Volume Profile
Pivot Length – swing sensitivity (larger = fewer, broader segments)
Max Profiles – how many historical segments to retain
Profile Width – thickness of each historical profile
High & Low Value Area
Profile VA/LV – extend the last segment’s top-bin and low-bin zones forward
-----------------
Disclaimer
The content provided in my scripts, indicators, ideas, algorithms, and systems is for educational and informational purposes only. It does not constitute financial advice, investment recommendations, or a solicitation to buy or sell any financial instruments. I will not accept liability for any loss or damage, including without limitation any loss of profit, which may arise directly or indirectly from the use of or reliance on such information.
All investments involve risk, and the past performance of a security, industry, sector, market, financial product, trading strategy, backtest, or individual's trading does not guarantee future results or returns. Investors are fully responsible for any investment decisions they make. Such decisions should be based solely on an evaluation of their financial circumstances, investment objectives, risk tolerance, and liquidity needs.
Wyszukaj w skryptach "algo"
WoAlgo Premium v3.0
WoAlgo Premium v3.0 - Smart Money Analysis
Overview
** WoAlgo Premium v3.0 ** is an advanced technical analysis indicator designed for educational purposes. This tool combines Smart Money Concepts with multi-factor confluence analysis to help traders identify potential market opportunities across multiple timeframes.
The indicator integrates market structure analysis, order flow concepts, and technical momentum indicators into a comprehensive dashboard system. It is designed to assist traders in understanding institutional trading patterns and market dynamics through visual analysis tools.
### What It Does
This indicator provides:
**1. Smart Money Concepts Analysis**
- Market structure identification (Break of Structure and Change of Character patterns)
- Order block detection with volume confirmation
- Fair value gap recognition
- Liquidity zone mapping (equal highs and lows)
- Premium and discount zone calculations
**2. Multi-Factor Confluence Scoring**
The indicator calculates a proprietary confluence score (0-100) based on five key components:
- Price action analysis (30% weight)
- Volume confirmation (20% weight)
- Momentum indicators (25% weight)
- Trend strength measurement (15% weight)
- Money flow analysis (10% weight)
**3. Multi-Timeframe Analysis**
- Scans 5 different timeframes (5M, 15M, 1H, 4H, Daily)
- Calculates alignment percentage across timeframes
- Displays trend and structure status for each period
**4. Visual Dashboard System**
- Comprehensive main dashboard with 13 metrics
- Real-time screener table with 10 data columns
- Multi-timeframe scanner
- Performance tracking panel
### How It Works
**Market Structure Detection**
The indicator identifies key structural changes in price action:
- **BOS (Break of Structure)**: Indicates trend continuation when price breaks previous swing points
- **CHoCH (Change of Character)**: Signals potential trend reversal when market structure shifts
**Order Block Identification**
Order blocks are detected when:
- Significant volume appears at swing points
- Price shows strong directional movement from these levels
- Enhanced detection with extreme volume confirmation (OB++ markers)
**Fair Value Gap Recognition**
Gaps between candles are identified when:
- Price leaves inefficiencies in the market
- Three consecutive candles create a gap pattern
- Gap size exceeds minimum threshold based on ATR
**Confluence Calculation**
The system evaluates multiple technical factors:
1. **Price Position**: Relative to moving averages (EMA 20, 50, 200)
2. **Volume Analysis**: Standard deviation-based volume spikes
3. **Momentum**: RSI, MACD, Stochastic indicators
4. **Trend Strength**: ADX measurements
5. **Money Flow**: MFI indicator readings
Each factor contributes weighted points to create an overall confluence score that helps assess signal strength.
### Signal Types
**Confirmation Signals (▲ / ▼)**
Generated when:
- EMA crossovers occur (20/50 cross)
- Volume confirmation is present
- RSI is in appropriate zone
- Confluence score exceeds 50%
**Strong Signals (▲+ / ▼+)**
Higher-confidence signals requiring:
- Confluence score above 70%
- Extreme volume confirmation
- Alignment with 200 EMA trend
- MACD confirmation
- Bullish or bearish market structure
**Contrarian Signals (⚡)**
Reversal indicators appearing when:
- RSI reaches extreme levels (<30 or >70)
- Stochastic shows oversold/overbought conditions
- Price touches Bollinger Band extremes
- Potential divergence patterns emerge
**Reversal Zones**
Visual boxes highlighting areas where:
- Market structure conflicts with momentum
- High probability of directional change
- Key support/resistance levels interact
**Smart Trail**
Dynamic stop-loss indicator that:
- Adjusts based on ATR (Average True Range)
- Follows trend direction
- Updates automatically as price moves
- Provides risk management reference points
### Dashboard Components
**Main Dashboard (13 Metrics)**
1. **Confluence Score**: Current bull/bear percentage (0-100)
2. **Market Regime**: Trend classification (Strong Up/Down, Range, Squeeze)
3. **Signal Status**: Active buy/sell signal indication
4. **Structure State**: Current market structure (Bullish/Bearish/Neutral)
5. **Trend Strength**: ADX-based measurement
6. **RSI Level**: Momentum indicator with overbought/oversold zones
7. **MACD Direction**: Trend momentum confirmation
8. **Money Flow Index**: Smart money sentiment
9. **Volume Status**: Current volume relative to average
10. **Volatility Rating**: ATR percentage measurement
11. **ATR Value**: Average true range for position sizing
12. **MTF Alignment**: Multi-timeframe agreement percentage
**Screener Table (10 Columns)**
- Current symbol and timeframe
- Real-time price and percentage change
- Quality rating (star system)
- Active signal type
- Smart trail status
- Market structure state
- MACD direction
- Trend strength percentage
- Bollinger Band squeeze detection
**MTF Scanner (5 Timeframes)**
Displays for each timeframe:
- Trend direction indicator
- Market structure classification
- Visual confirmation with color coding
**Performance Metrics**
- Win rate percentage (simplified calculation)
- Total signals generated
- Current confluence score
- MTF alignment status
- Volatility level
### Settings and Customization
**Preset Styles**
Choose from predefined configurations:
- **Conservative**: Fewer, higher-quality signals
- **Moderate**: Balanced approach (recommended)
- **Aggressive**: More frequent signals
- **Scalper**: Short-term focused
- **Swing**: Longer-term oriented
- **Custom**: Full manual control
**Smart Money Concepts Controls**
- Toggle each feature independently
- Adjust swing length (3-50 periods)
- Enable/disable internal structure
- Control order block display
- Manage breaker block visibility
- Show/hide fair value gaps
- Display liquidity zones
- Premium/discount zone visualization
**Signal Configuration**
- Enable/disable confirmation signals
- Toggle strong signal markers
- Control contrarian signal display
- Show/hide reversal zones
- Smart trail activation
- Sensitivity adjustment (5-50)
**Visual Customization**
- Moving average display options
- MA period adjustments (Fast: 20, Slow: 50, Trend: 200)
- Support/resistance line toggle
- Dynamic S/R lookback period
- Candle coloring based on trend
- Color scheme customization
- Dashboard size options (Small/Normal/Large)
- Position placement (4 corners)
### How to Use
**Step 1: Initial Setup**
1. Add indicator to chart
2. Select appropriate preset or use Custom
3. Adjust timeframe to match trading style
4. Configure dashboard visibility preferences
**Step 2: Analysis Workflow**
1. Check MTF Scanner for timeframe alignment
2. Review Main Dashboard confluence score
3. Observe Market Regime classification
4. Identify active signals on chart
5. Confirm with Smart Money Concepts (order blocks, FVG, structure)
**Step 3: Trade Consideration**
Strong signals (▲+ / ▼+) require:
- Confluence score >70%
- MTF alignment >60%
- Confirmation from multiple dashboard metrics
- Support from Smart Money Concepts
- Appropriate volume levels
**Step 4: Risk Management**
- Use Smart Trail as dynamic stop-loss reference
- Consider ATR for position sizing
- Monitor volatility rating
- Respect support/resistance levels
- Combine with personal risk parameters
### Best Practices
**For Scalping (1M-5M timeframes)**
- Use Scalper preset
- Reduce swing length to 5-7
- Focus on strong signals only
- Monitor MTF alignment closely
- Quick entries near order blocks
**For Intraday Trading (15M-1H timeframes)**
- Use Moderate preset (recommended)
- Default swing length (10)
- Combine confirmation and strong signals
- Check MTF scanner before entry
- Use fair value gaps for entries
**For Swing Trading (4H-D timeframes)**
- Use Swing preset
- Increase swing length to 15-20
- Focus on strong signals
- Require high MTF alignment
- Patient approach with major structure levels
### Technical Specifications
**Indicators Used**
- Exponential Moving Averages (20, 50, 200)
- Hull Moving Average
- Relative Strength Index (14)
- MACD (12, 26, 9)
- Money Flow Index (14)
- Stochastic Oscillator (14, 3)
- ADX / DMI (14)
- Bollinger Bands (20, 2)
- ATR (14)
- Volume Analysis (SMA 20 with standard deviation)
**Calculation Methods**
- Swing detection using pivot high/low functions
- Volume confirmation via statistical analysis
- Multi-factor scoring with weighted components
- Dynamic support/resistance using highest/lowest functions
- Real-time MTF data via security() function
### Limitations and Considerations
**Important Notes**
1. This indicator is designed for educational and analytical purposes only
2. Historical performance does not guarantee future results
3. Signals should be confirmed with additional analysis
4. Market conditions vary and affect indicator performance
5. Not all signals will be profitable
6. Risk management is essential for all trading
**Known Limitations**
- Confluence scoring is algorithmic and not predictive
- MTF analysis requires sufficient historical data
- Effectiveness varies across different market conditions
- Sideways markets may produce conflicting signals
- High volatility can affect signal reliability
- Backtesting results shown are simplified calculations
**Not Suitable For**
- Automated trading without human oversight
- Sole basis for trading decisions
- Guaranteed profit expectations
- Inexperienced traders without proper education
- Trading without risk management plans
### Market Applicability
**Effective On**
- Trending markets (any direction)
- Clear structure formation periods
- Liquid instruments with consistent volume
- Multiple asset classes (forex, stocks, crypto, commodities)
- Various timeframes with appropriate settings
**Less Effective During**
- Extended ranging/choppy conditions
- Extremely low volume periods
- Major news events causing gaps
- Early market open with high spread
- Illiquid instruments with erratic price action
### Risk Disclaimer
**⚠️ IMPORTANT NOTICE**
This indicator is provided for **educational and informational purposes only**. It does not constitute financial advice, investment recommendations, or trading signals.
**Key Risk Factors:**
- Trading financial instruments involves substantial risk of loss
- Past performance does not indicate future results
- No indicator can predict market movements with certainty
- Users should conduct independent research and analysis
- Professional financial advice should be sought when appropriate
- Risk management and position sizing are critical to successful trading
- Users are solely responsible for their trading decisions
**Responsible Usage:**
- Combine with comprehensive market analysis
- Use appropriate stop-loss orders
- Never risk more than you can afford to lose
- Maintain realistic expectations
- Continue education on technical analysis principles
- Test thoroughly on demo accounts before live trading
- Understand all indicator features before using
### Educational Resources
**Understanding Smart Money Concepts**
Smart Money Concepts analyze how institutional traders and large market participants operate. Key principles include:
- Institutional order flow patterns
- Market structure changes
- Liquidity manipulation
- Supply and demand imbalances
- Order block formations
**Multi-Timeframe Analysis Theory**
Analyzing multiple timeframes helps:
- Identify overall market direction
- Improve entry timing
- Confirm trend strength
- Recognize consolidation periods
- Reduce conflicting signals
**Confluence Trading Approach**
Using multiple confirming factors:
- Increases signal reliability
- Reduces false signals
- Provides conviction for trades
- Helps with position sizing
- Improves risk-reward ratios
### Version History
**v3.0 (Current)**
- Multi-factor confluence scoring system
- Complete Smart Money Concepts implementation
- Real-time multi-timeframe analysis
- Four professional dashboard panels
- Enhanced order block detection
- Breaker block identification
- Premium/discount zone calculations
- Smart trail stop-loss system
- Customizable preset configurations
- Performance tracking metrics
**Development Philosophy**
This indicator was developed with focus on:
- Educational value for traders
- Transparent methodology
- Comprehensive feature set
- User-friendly interface
- Flexible customization options
### Technical Support
**For Questions About:**
- Indicator functionality
- Parameter optimization
- Signal interpretation
- Dashboard metrics
- Best practice recommendations
Please use TradingView's comment section below. The developer monitors comments and provides assistance to users learning to use the indicator effectively.
### Acknowledgments
This indicator implements concepts from:
- Smart Money Concepts trading methodology
- Multi-timeframe analysis techniques
- Technical indicator theory
- Market structure analysis principles
- Institutional order flow concepts
All implementations are original code and calculations based on established technical analysis principles.
---
## ADDITIONAL INFORMATION SECTION
**Category**: Indicators
**Type**: Market Structure / Multi-Timeframe Analysis
**Complexity**: Intermediate to Advanced
**Open Source**: Code visible for transparency and education
**Pine Script Version**: v6
**Chart Overlay**: Yes
**Maximum Objects**: 500 boxes, 500 lines, 500 labels
AlphaStrike: Zen ModeDescription:
1. The Philosophy: Reducing Cognitive Load Modern charts are often cluttered with dozens of noisy lines (Bollinger Bands, Moving Averages, Oscillators) that lead to "Analysis Paralysis." This script is designed with a "Zen" philosophy: P rocess the complexity in the background, but display only the decision.
This is not a simple indicator overlay. It is a Risk-Based Trading Engine that runs multiple validation checks (Momentum, Volatility, and Price Action) simultaneously but hides the underlying calculations to keep the chart clean. It focuses the trader's attention on the two things that matter most: Trend Direction and Position Sizing.
2. The "Invisible" Technical Engine The script operates on a Dual-State Logic system that adapts to market conditions. It uses standard indicators as filters, not just visuals.
A. Trend State (The Backbone) The script calculates a volatility-adjusted Trend Baseline (SuperTrend).
Green State: The market is in a markup phase. The script looks for continuation.
Red State: The market is in a markdown phase. The script looks for defense.
B. The "Confluence" Reversal Logic Instead of cluttering the screen with Bollinger Bands and RSI windows, the script performs these checks internally:
Condition 1 (Volatility): Is price extending beyond the 2.0 Standard Deviation (Bollinger Lower/Upper)?
Condition 2 (Momentum): Is RSI overextended (<35 or >65)?
Condition 3 (Price Action): Is there a specific Pin Bar candle pattern (Long wick rejection)?
Result: Only when all three conditions align does the script print a "Reversal Circle." This filters out weak signals that usually occur in strong trends.
3. The Risk Management Calculator (Key Feature) Most traders fail not because of bad entries, but because of inconsistent sizing. This script features a built-in Dynamic Position Sizing Dashboard located in the bottom right.
Adaptive Stop Loss:
In a Trend: The Stop Loss is automatically set to the Trend Line (SuperTrend).
In a Reversal: The script internally scans for the nearest Swing Low/High (using hidden Pivot calculations) and sets the Stop Loss there.
Position Sizing Math: The dashboard reads your Account Size and Risk % inputs. It instantly calculates the "Max Size" (contract/share amount) allowed for the current trade.
Formula: Position Size = (Account Value * Risk %) / Distance to Stop.
Benefit: This ensures you risk the exact same dollar amount on every trade, whether the stop loss is 1% away or 10% away.
4. How to Read the Signals
Triangles (Breakouts): These represent a shift in the dominant trend direction.
Green Triangle: Bullish Trend Start.
Red Triangle: Bearish Trend Start.
Circles (Mean Reversion): These are high-probability counter-trend plays.
Blue Circle: Buy Reversal (Oversold + Pinbar + Bollinger Support).
Orange Circle: Sell Reversal (Overbought + Pinbar + Bollinger Resistance).
5. Settings
Trend Settings: Adjust the ATR Period and Factor to change the sensitivity of the trend line.
Reversal Settings: Tweak the RSI and Bollinger thresholds to filter out more/less signals.
Risk Management: Input your total Account Size and desired Risk Per Trade (e.g., 1%) to calibrate the Dashboard.
Disclaimer This tool provides algorithmic analysis and risk calculations. It does not guarantee profits or provide financial advice. Always verify position sizes before executing.
TREND FLOW CANDLES - [EntryLab]Trend Flow Candles was created for the community to clearly visualize the flow of trend on any token. It provides a simple, clean, and visually pleasing way to identify overall trend bias at a glance. Using proprietary algorithmic logic developed specifically to assist traders, the candles dynamically reflect trend strength and direction to help with higher-timeframe confluence.
This indicator has been back-tested with strong accuracy and is designed to be easy to use, quick to set up, and practical in real trading conditions. Trend Flow Candles works best as a directional bias tool, helping traders stay aligned with the dominant trend while making clearer, more confident decisions. It is a powerful addition to any indicator arsenal when you need reliable trend context without clutter.
Regards,
ENTRYLAB
Dip Buy/Sell Signals (Vix Fix + MA Deviation + TRMAD) [DotGain]Dip Buy/Sell Signals (Vix Fix + MA Deviation + TRMAD)
This indicator combines three proven market stress and mean-reversion components to identify potential buy and sell opportunities during extended market conditions.
────────────────────
📌 Included Components
1️⃣ Volatility-Based Stress Filter (Vix Fix)
Detects short-term market panic using relative price movement.
Signals are generated only during periods of elevated volatility or market stress.
2️⃣ Moving Average Deviation (MA Deviation)
Identifies overbought and oversold conditions based on the percentage deviation from a selected moving average.
Supported MA types:
• EMA
• SMA
• RMA
• VWMA
• WMA
• TEMA
3️⃣ TRMAD (True Range Mean Absolute Deviation)
Measures the distance of price from its mean relative to current volatility.
Useful for filtering extreme price moves and reducing false signals.
────────────────────
📈 Trading Signals
Buy Signal:
• Elevated market volatility
• Price significantly below the moving average
• TRMAD below the defined threshold
Sell Signal:
• Elevated market volatility
• Price significantly above the moving average
• TRMAD above the defined threshold
Signals are visualized directly on the chart:
• Buy: green label below the candle
• Sell: red label above the candle
────────────────────
⚙️ Settings & Customization
All components are fully adjustable:
• Lookback periods
• Moving average types and lengths
• Volatility and threshold levels
This makes the indicator suitable for:
• Intraday trading
• Swing trading
• Crypto, Forex, indices, and equities
────────────────────
Disclaimer
This "Dip Buy/Sell Signals (Vix Fix + MA Deviation + TRMAD)" (DipSig) indicator is provided for informational and educational purposes only. It does not, and should not be construed as, financial, investment, or trading advice.
The signals generated by this tool (both "Buy" and "Sell") are the result of a specific set of algorithmic conditions. They are not a direct recommendation to buy or sell any asset. All trading and investing in financial markets involves substantial risk of loss. You can lose all of your invested capital.
Past performance is not indicative of future results. The signals generated may produce false or losing trades. The creator (© DotGain) assumes no liability for any financial losses or damages you may incur as a result of using this indicator.
You are solely responsible for your own trading and investment decisions. Always conduct your own research (DYOR) and consider your personal risk tolerance before making any trades.
4 Bar Sequential Counter (9 to 13) [DotGain]4-Bar Sequential Counter (Seq4)
This indicator identifies potential trend exhaustion phases using a strict sequential count
based on the relationship between the current closing price and the closing price four bars earlier.
How it works
• A bullish sequence is counted as long as the current close remains below the close from 4 bars ago.
• A bearish sequence is counted as long as the current close remains above the close from 4 bars ago.
• The count resets immediately if the respective condition is no longer met.
• The sequence counts up to a maximum of 13 , after which it resets and a new sequence may begin.
Visualization
• Only counts from 9 to 13 are displayed on the chart.
• Bullish sequences are plotted below price bars.
• Bearish sequences are plotted above price bars.
• The minimalist design keeps the chart clean and focused on potentially relevant exhaustion zones.
Interpretation
• A count of 9 may indicate an early sign of market overextension.
• A count of 13 represents a more advanced sequence and a higher probability
of consolidation or corrective price action.
• This indicator is not a standalone trading system and should be used in combination
with trend analysis, volume, and support/resistance levels.
Alerts
• Bullish sequence at 9
• Bullish sequence at 13
• Bearish sequence at 9
• Bearish sequence at 13
Disclaimer
This "4-Bar Sequential Counter (9–13)" (Seq4) indicator is provided for informational and educational purposes only. It does not, and should not be construed as, financial, investment, or trading advice.
This indicator is an independent implementation of a sequential counting method and is not affiliated with, or endorsed by any trademarked trading concepts or methodologies.
The signals generated by this tool (Green and Red) are the result of a specific set of algorithmic conditions. They are not a direct recommendation to buy or sell any asset.
All trading and investing in financial markets involves a substantial risk of loss. You can lose all of your invested capital.
Past performance does not guarantee future results.
This indicator highlights sequential price exhaustion patterns and may generate false, lagging, or incomplete signals. Markets can remain unpredictable longer than you can remain solvent.
The creator DotGain assumes no liability for any financial losses or damages you may incur, directly or indirectly, as a result of using this indicator or the information it provides.
You are solely responsible for your own trading and investment decisions. Always conduct your own research (DYOR), validate signals with other methods, and consider your personal risk tolerance before entering any trade.
RSI & BB Oversold Scalper with MACD Confirmation [DotGain]RSI & BB Oversold Scalper with MACD Confirmation
The RSI & BB Oversold Scalper is a mean reversion / dip-buying indicator designed for traders who want to combine oversold conditions with momentum confirmation .
It uses a multi-step logic: first detect an oversold setup, then wait for a MACD confirmation within a defined time window before issuing a buy signal.
---
Core Concept
1. Detect an oversold setup using Bollinger Bands %b, RSI and an optional DSS filter
2. Keep the setup active for a limited number of candles
3. Trigger the entry using a MACD bullish crossover
4. Reset after entry to avoid multiple signals from the same setup
---
Buy Signal Logic
A buy signal is generated when the following conditions are met:
1. Oversold Setup (filters can be enabled/disabled individually)
• Bollinger Bands %b Oversold (Lookback-based)
The price has traded below the lower Bollinger Band at least once within the last `lookbackBB` candles.
• RSI Oversold (Lookback-based)
The RSI has dropped below 30 at least once within the last `lookbackRSI` candles.
• DSS (Double Smoothed Stochastic) Reversal Filter
A bullish crossover of the DSS line above its signal line while the DSS value is below 20 , indicating a potential momentum reversal from oversold conditions.
Note:
BB %b and RSI are lookback filters , while the DSS condition is a single-bar crossover event .
---
2. MACD Confirmation (Entry Timing)
After the setup becomes active, the indicator waits for a bullish MACD crossover (`MACD line crosses above Signal line`) within a user-defined time window (`validWindow` candles).
If the MACD confirmation occurs within this window, a buy signal is printed.
If the window expires without confirmation, the setup is discarded automatically.
---
Reset Logic
• After a buy signal, the setup is reset immediately
• Only one signal is allowed per setup
• No late entries after the time window expires
---
Inputs & Customization
• Enable or disable BB, RSI and DSS filters individually
• Adjust lookback periods to control how recent oversold conditions must be
• Tune the MACD confirmation window to balance early vs. conservative entries
Smaller windows = faster, more aggressive entries
Larger windows = fewer but more confirmed signals
Recommended Markets & Timeframes
• Cryptocurrencies, Forex, Indices, liquid stocks
• Best suited for 1m – 15m scalping
• Also usable on 15m – 1h for slower mean-reversion trades
Visuals
• Buy signals are displayed as labels below the price candles
Important Notes
• This indicator is a signal and timing tool , not a complete trading system
• Always combine with higher-timeframe trend, support/resistance or volume analysis
• Backtesting and paper trading are strongly recommended
Disclaimer:
This "RSI & BB Oversold Scalper with MACD Confirmation" (Oversold Scalper) indicator is provided for informational and educational purposes only. It does not, and should not be construed as, financial, investment, or trading advice.
The signal generated by this tool (Green) is the result of a specific set of algorithmic conditions. They are not a direct recommendation to buy or sell any asset. The indicator's purpose is to highlight possible weakness in the markets, not to provide infallible trade signals.
All trading and investing in financial markets involves a substantial risk of loss. You can lose all of your invested capital.
Past performance is not indicative of future results. Even an indicator designed to filter out "chop" may produce false, lagging, or losing signals. Markets can remain unpredictable longer than you can remain solvent.
The creator DotGain assumes no liability for any financial losses or damages you may incur, directly or indirectly, as a result of using this indicator or the information it provides.
You are solely responsible for your own trading and investment decisions. Always conduct your own research (DYOR), validate signals with other methods, and consider your personal risk tolerance before entering any trade.
TA Confluence Scanner v2.9 | Mint_Algo📘 TA Confluence Scanner
Introduction
The TA Confluence Scanner is a multi-factor trend system designed to filter market noise and identify high-probability trade setups. By combining adaptive algorithms (KAMA) with Price Action methodologies (SMC, Breakouts, Fractals), this indicator operates on the principle of Confluence : a signal is only valid when multiple independent tools agree on the direction.
Instead of relying on a single lagging indicator (like just MA fast and slow crossover), this script acts as a "Scanner," evaluating the market state through Volatility, Trend Structure, and Equilibrium.
───────────────────────────────────────────────────
Important Note
To make this "Plug & Play," I have included optimized presets in the settings for different timeframes (1m/15m-1h/4h-1D) and trading styles (Scalper, Intraday, Swing, Investor) tested on symbols:
FX:EURUSD
IG:NASDAQ
BITSTAMP:BTCUSD
BINANCE:ETHUSD
CAPITALCOM:US500
OANDA:XAUUSD
NASDAQ:AAPL
NASDAQ:TSLA
BUT default settings already include a good preset which excludes most of the noise and grabs the trend better (fewer entries, but quality is higher).
Check the presets at the bottom 👇
───────────────────────────────────────────────────
Core Features
Adaptive Trend Filter (KAMA): Adjusts to market volatility to distinguish between chop and true trends.
SMC Equilibrium (EQ) Fans: A three-tiered dynamic structure (Fast, Medium, Slow) for trailing stops and targets.
Confluence Counter: Visually displays the strength of a signal (e.g., "Strong 4/6") based on how many factors align.
Re-Entry Logic: Identifies low-risk entry points within an existing trend.
Automated S/R & Breakouts: Detects key pivot levels and structural breaks.
───────────────────────────────────────────────────
Settings & Components Breakdown
1. KAMA (Primary Trend Filter)
The backbone of the system. It calculates the Efficiency Ratio (ER) of price movement.
How it works: If the ER is high (strong trend), KAMA follows price closely. If ER is low (ranging), KAMA flattens out to prevent false signals.
Tuning:
Fast (ER ~100/5/60): For Scalping.
Smooth: Default settings are optimized for a balance between lag and noise reduction.
2. SMC Equilibrium (EQ Structure)
Based on the HL2 formula (High+Low / 2), this creates a "fan" of three lines:
EQ1 (Fast): The aggressive line. Used for early exits or scalping stops.
EQ2 (Medium): The baseline trend structure.
EQ3 (Slow): The major trend container. Used for position trading.
Usage: Use these lines to gauge how far price has deviated from its "fair value."
3. Breakout & Internal Trend
Lookback Period: Defines the range for a valid breakout. A lower lookback (e.g., 10) gives earlier signals but more noise; a higher lookback (e.g., 20-30) confirms significant structural breaks.
Internal Trend: A simplified SMA check to ensure immediate momentum aligns with the macro trend.
4. Signal Strength (The Confluence Meter)
The indicator counts active signals from: KAMA, Internal Trend, S/R, FVG, Breakout, and EQ.
Strong Signal: When the count hits your threshold (e.g., 4/6 ). This suggests a high-probability reversal or breakout.
Medium Signal (Triangles): These appear when the trend is active but not all filters align. These are excellent continuation/re-entry points.
───────────────────────────────────────────────────
How to Trade (Strategy Guide)
🎯 The Entry
Wait for a Strong Signal (Large Label). This confirms that volatility, structure, and momentum have aligned.
Conservative: Wait for the candle to close.
Aggressive: Enter on the breakout of the KAMA line.
🔄 Re-Entry & Continuation
Markets rarely move in a straight line.
Scenario: You missed the initial "Strong" entry, or you took profit and want to re-enter.
The Signal: Look for the small Triangles (Medium signals). These often appear after a pullback when price resumes the main trend.
Logic: If the main KAMA trend is still green/red, but the "Strong" signal isn't firing, a Triangle indicates a safe place to add to a position.
⚠️ Pyramiding & Risk Management (Advanced)
The EQ Lines (Fast/Medium/Slow) are designed for a tiered position management strategy:
Entry: Open position (e.g., 0.03 lots).
First Take Profit: When price extends far beyond EQ1 (Fast) , lock in partial profits.
Trailing Stop: Move your Stop Loss to trace the EQ2 (Medium) line.
Trend Riding: Hold the "Runner" portion of your position until price closes back under EQ3 (Slow) or the KAMA line.
Tip: Use William Fractals (Period 2) to pinpoint exact swing highs/lows for tightening stops.
───────────────────────────────────────────────────
Presets & Optimized Settings
To make this "Plug & Play," I have included optimized presets in the settings for different trading styles.
(If you don't see some parameters, that means they are turned off in trading mode)
⚡ SCALPER (1m - 5m)
KAMA:
ER: 100
Fast Length: 15
Slow Length: 30
FVG:
Size %: 0.01
Trend Detection:
Length: 20
Breakout:
Lookback Period: 10
S/R Detection:
Pivot Length: 10
Tolerance: 0.3
SMC EQ:
Default: 10
EQ1: 10
EQ2 (Main): 30
EQ3: 120
Signal Strength:
Strong: 4
Medium: 3
📊 INTRADAY (15m - 1H)
KAMA:
ER: 100
Fast Length: 5
Slow Length: 30
Trend Detection:
Length: 100
Breakout:
Lookback Period: 30
S/R Detection:
Pivot Length: 20
Tolerance: 0.5
SMC EQ:
Default: 10
EQ1: 10
EQ2 (Main): 40
EQ3: 80
Signal Strength:
Strong: 4
Medium: 3
📈 SWING (4H - 1D)
KAMA:
ER: 30
Fast Length: 4
Slow Length: 30
Trend Detection:
Length: 50
Breakout:
Lookback Period: 20
S/R Detection:
Pivot Length: 30
Tolerance: 0.7
SMC EQ:
Default: 10
EQ1: 10
EQ2: 50
EQ3 (Main): 60
Signal Strength:
Strong: 4
Medium: 3
💼 INVESTOR (4H - 1D+)
KAMA:
ER: 30
Fast Length: 5
Slow Length: 10
Trend Detection:
Length: 100
Breakout:
Lookback Period: 50
S/R Detection:
Pivot Length: 30
Tolerance: 0.7
SMC EQ:
Default: 10
EQ1: 10
EQ2: 50
EQ3 (Main): 100
Signal Strength:
Strong: 4
Medium: 3
───────────────────────────────────────────────────
Notes
FVG (Fair Value Gaps): Optional. Enable if you trade volatile assets like Crypto/Gold where imbalances are common.
Support/Resistance: The built-in Pivot system is optional. Disable it if you prefer drawing your own levels to keep the chart clean.
Recommended Pairing:
For best results, pair this with a momentum oscillator like RSI to detect the range regime of a trend. Or DI+ and DI- (when it crosses over each other, that means the "range of possible" regime change of a trend).
───────────────────────────────────────────────────
Disclaimer:
This tool is for informational purposes only. "Confluence" increases probability but does not guarantee results. Always manage your risk.
PAE - Price Action Essential**PAE - Price Action Essential** indicator.
This system is engineered to provide high-fidelity market structure readings, blending moving average harmony with algorithmic volume analysis at critical turning points.
---
## 1. Indicator Philosophy
**PAE** operates under the **"Signal over Noise"** principle. Its goal is to declutter the chart of visual distractions, highlighting only the areas where true confluence exists between price action and institutional effort (volume).
---
## 2. Moving Average Dynamics & Action Zone
The system utilizes a hierarchy of four moving averages to segment market flow:
### A. The Action Zone (Short-Term)
This is generated via a dynamic shading between the **Fast MA (9)** and the **Base MA (20)**.
* **Configuration:** Allows the user to select the calculation type (EMA, SMA, WMA, HMA) for both averages simultaneously.
* **Fast MA Colors:**
* `#a5d6a7` (Soft Green) during ascending values.
* `#faa1a4` (Soft Red) during descending values.
* **Purpose:** The shaded area acts as a "value band." Pullbacks into this zone during defined trends often offer the highest probability entry opportunities.
### B. Structural MAs (Mid & Long-Term)
These averages are fixed to **SMA** type to maintain stability in trend analysis:
* **Medium SMA (40):** Uses vibrant colors (**#3179f5** Blue / **#ffee58** Yellow) to clearly mark the primary direction of the current swing.
* **Slow SMA (200):** Uses pastel tones (**#90bff9** / **#fff9c4**) and a dotted style to define the long-term institutional bias.
---
## 3. Pivot Analysis with Smart Volume
**PAE** identifies fractals (Highs and Lows) and automatically classifies them based on their **Relative Volume** compared to the previous 20 candles.
### Visual Classification by Color
To ensure rapid interpretation, labels are set to **Tiny** size, with color serving as the primary data indicator:
| Pivot Type | Color | Volume Condition | Interpretation |
| --- | --- | --- | --- |
| **Strength (MAX)** | `#ff001e` (Bright Red) | `> 160%` of Avg | High-conviction resistance. |
| **Strength (MIN)** | `#0fa600` (Bright Green) | `> 160%` of Avg | High-conviction support. |
| **Base (MAX)** | `#f1adad` (Soft Rose) | Between `30%` - `160%` | Standard market structure. |
| **Base (MIN)** | `#bee7c0` (Soft Mint) | Between `30%` - `160%` | Standard market structure. |
| **Noise** | `#ffffff` (White 67% Transp.) | `< 30%` of Avg | Weak pivots or lack of interest. |
---
## 4. Contextual Information (Tooltips)
Every Pivot label is interactive. By hovering the cursor over the triangles, the trader obtains precise data:
* **Price:** Indicates the exact **Closing** value of the candle that triggered the pivot (MAX or Min).
* **Vol:** Displays the exact percentage of relative volume. For example, a value of **200%** confirms that the candle had double the average volume, validating the strength of that support or resistance level.
---
## 5. Recommended Configuration Parameters
* **Left/Right Bars (3):** The ideal balance between early detection and swing confirmation.
* **Strength Factor (1.60):** Filters for movements backed by professional intent.
* **Noise Factor (0.30):** Identifies exhaustion or lack of participation.
---
### Operational Summary
The **PAE** helps traders stop guessing. If the price reaches the **Action Zone** (shading) and coincides with a **Strength Pivot** (bright color), the probability of a reaction in favor of the trend is significantly high. It is a precision tool designed for traders seeking absolute clarity in their decision-making process.
Smart Divergence [Reason Edition]Stop trading divergences "in thin air". Start trading structural confluence.
Most divergence indicators fail for one reason: they signal reversals based solely on oscillator math (RSI vs. Price), ignoring the chart's structure. This leads to costly entries against strong trends.
Smart Divergence solves this by applying an Institutional Context Filter. It does not simply alert you of a divergence; it validates the signal against key market structures ("Walls") and—crucially—tells you exactly why the signal appeared directly on the label.
🚀 How It Works: The "Smart Filter" Logic
This script operates on a strict rule: "No Structure, No Signal."
For a Bullish or Bearish divergence to be valid, price must not only diverge from RSI but also physically touch or react to one of four key structural levels:
BB (Bollinger Bands): Rejection due to volatility extension (2.0 StdDev).
KC (Keltner Channels): Rejection due to average range deviation (1.5 ATR).
Pivots (S1/R1): Rejection at standard daily algorithmic levels.
VWAP: Rejection at the institutional average price (Volume Weighted Average Price).
🏷️ Dynamic "Reason" Labels
This is the core feature of this edition. The label on your chart adapts dynamically to show the specific confluence behind the trade.
Examples you will see:
SMART BULL (BB) → The divergence is valid because price hit the Bollinger Band.
SMART BULL (VWAP) → The divergence is valid because price bounced off the VWAP.
SMART BULL (BB VWAP) → High Probability: Price hit the Bollinger Band AND the VWAP simultaneously.
The Logic: The more "Reasons" (acronyms) appear inside the label, the stronger the structural wall, and the higher the probability of a reversal.
🛠️ Settings & Features
🛡️ Smart Filter (Toggle):
ON (Default): Only shows high-quality signals that occur at Support/Resistance zones.
OFF: Shows all raw technical divergences (standard mode).
Alerts Included: Setup custom alerts for "Smart Bull" (Buys) and "Smart Bear" (Sells).
Zero Repainting: Signals are confirmed upon candle close/pivot confirmation.
📋 How to Trade It
Wait for the Label: Do not guess. Wait for the SMART label to appear.
Check the Reason: Look at the text in parenthesis (...).
Single reason (e.g., KC) is a valid setup.
Cluster reasons (e.g., BB S1 VWAP) represent a "Concrete Wall" and are ideal for aggressive entries.
Context: Works best on Intraday timeframes (1m, 5m, 15m) for scalping, and Daily timeframe for Swing Trading bottoms/tops.
Disclaimer: This tool is for educational purposes and technical analysis assistance. Past performance does not guarantee future results. Manage your risk.
DeeptestDeeptest: Quantitative Backtesting Library for Pine Script
━━━━━━━━━━━━━━━━━━━━━━━━━━━━━━━━━━
█ OVERVIEW
Deeptest is a Pine Script library that provides quantitative analysis tools for strategy backtesting. It calculates over 100 statistical metrics including risk-adjusted return ratios (Sharpe, Sortino, Calmar), drawdown analysis, Value at Risk (VaR), Conditional VaR, and performs Monte Carlo simulation and Walk-Forward Analysis.
█ WHY THIS LIBRARY MATTERS
Pine Script is a simple yet effective coding language for algorithmic and quantitative trading. Its accessibility enables traders to quickly prototype and test ideas directly within TradingView. However, the built-in strategy tester provides only basic metrics (net profit, win rate, drawdown), which is often insufficient for serious strategy evaluation.
Due to this limitation, many traders migrate to alternative backtesting platforms that offer comprehensive analytics. These platforms require other language programming knowledge, environment setup, and significant time investment—often just to test a simple trading idea.
Deeptest bridges this gap by bringing institutional-level quantitative analytics directly to Pine Script. Traders can now perform sophisticated analysis without leaving TradingView or learning complex external platforms. All calculations are derived from strategy.closedtrades.* , ensuring compatibility with any existing Pine Script strategy.
━━━━━━━━━━━━━━━━━━━━━━━━━━━━━━━━━━
█ ORIGINALITY AND USEFULNESS
This library is original work that adds value to the TradingView community in the following ways:
1. Comprehensive Metric Suite: Implements 112+ statistical calculations in a single library, including advanced metrics not available in TradingView's built-in tester (p-value, Z-score, Skewness, Kurtosis, Risk of Ruin).
2. Monte Carlo Simulation: Implements trade-sequence randomization to stress-test strategy robustness by simulating 1000+ alternative equity curves.
3. Walk-Forward Analysis: Divides historical data into rolling in-sample and out-of-sample windows to detect overfitting by comparing training vs. testing performance.
4. Rolling Window Statistics: Calculates time-varying Sharpe, Sortino, and Expectancy to analyze metric consistency throughout the backtest period.
5. Interactive Table Display: Renders professional-grade tables with color-coded thresholds, tooltips explaining each metric, and period analysis cards for drawdowns/trades.
6. Benchmark Comparison: Automatically fetches S&P 500 data to calculate Alpha, Beta, and R-squared, enabling objective assessment of strategy skill vs. passive investing.
━━━━━━━━━━━━━━━━━━━━━━━━━━━━━━━━━━
█ KEY FEATURES
Performance Metrics
Net Profit, CAGR, Monthly Return, Expectancy
Profit Factor, Payoff Ratio, Sample Size
Compounding Effect Analysis
Risk Metrics
Sharpe Ratio, Sortino Ratio, Calmar Ratio (MAR)
Martin Ratio, Ulcer Index
Max Drawdown, Average Drawdown, Drawdown Duration
Risk of Ruin, R-squared (equity curve linearity)
Statistical Distribution
Value at Risk (VaR 95%), Conditional VaR
Skewness (return asymmetry)
Kurtosis (tail fatness)
Z-Score, p-value (statistical significance testing)
Trade Analysis
Win Rate, Breakeven Rate, Loss Rate
Average Trade Duration, Time in Market
Consecutive Win/Loss Streaks with Expected values
Top/Worst Trades with R-multiple tracking
Advanced Analytics
Monte Carlo Simulation (1000+ iterations)
Walk-Forward Analysis (rolling windows)
Rolling Statistics (time-varying metrics)
Out-of-Sample Testing
Benchmark Comparison
Alpha (excess return vs. benchmark)
Beta (systematic risk correlation)
Buy & Hold comparison
R-squared vs. benchmark
━━━━━━━━━━━━━━━━━━━━━━━━━━━━━━━━━━
█ QUICK START
Basic Usage
//@version=6
strategy("My Strategy", overlay=true)
// Import the library
import Fractalyst/Deeptest/1 as *
// Your strategy logic
fastMA = ta.sma(close, 10)
slowMA = ta.sma(close, 30)
if ta.crossover(fastMA, slowMA)
strategy.entry("Long", strategy.long)
if ta.crossunder(fastMA, slowMA)
strategy.close("Long")
// Run the analysis
DT.runDeeptest()
━━━━━━━━━━━━━━━━━━━━━━━━━━━━━━━━━━
█ METRIC EXPLANATIONS
The Deeptest table displays 23 metrics across the main row, with 23 additional metrics in the complementary row. Each metric includes detailed tooltips accessible by hovering over the value.
Main Row — Performance Metrics (Columns 0-6)
Net Profit — (Final Equity - Initial Capital) / Initial Capital × 100
— >20%: Excellent, >0%: Profitable, <0%: Loss
— Total return percentage over entire backtest period
Payoff Ratio — Average Win / Average Loss
— >1.5: Excellent, >1.0: Good, <1.0: Losses exceed wins
— Average winning trade size relative to average losing trade. Breakeven win rate = 100% / (1 + Payoff)
Sample Size — Count of closed trades
— >=30: Statistically valid, <30: Insufficient data
— Number of completed trades. Includes 95% confidence interval for win rate in tooltip
Profit Factor — Gross Profit / Gross Loss
— >=1.5: Excellent, >1.0: Profitable, <1.0: Losing
— Ratio of total winnings to total losses. Uses absolute values unlike payoff ratio
CAGR — (Final / Initial)^(365.25 / Days) - 1
— >=10%: Excellent, >0%: Positive growth
— Compound Annual Growth Rate - annualized return accounting for compounding
Expectancy — Sum of all returns / Trade count
— >0.20%: Excellent, >0%: Positive edge
— Average return per trade as percentage. Positive expectancy indicates profitable edge
Monthly Return — Net Profit / (Months in test)
— >0%: Profitable month average
— Average monthly return. Geometric monthly also shown in tooltip
Main Row — Trade Statistics (Columns 7-14)
Avg Duration — Average time in position per trade
— Mean holding period from entry to exit. Influenced by timeframe and trading style
Max CW — Longest consecutive winning streak
— Maximum consecutive wins. Expected value = ln(trades) / ln(1/winRate)
Max CL — Longest consecutive losing streak
— Maximum consecutive losses. Important for psychological risk tolerance
Win Rate — Wins / Total Trades
— Higher is better
— Percentage of profitable trades. Breakeven win rate shown in tooltip
BE Rate — Breakeven Trades / Total Trades
— Lower is better
— Percentage of trades that broke even (neither profit nor loss)
Loss Rate — Losses / Total Trades
— Lower is better
— Percentage of unprofitable trades. Together with win rate and BE rate, sums to 100%
Frequency — Trades per month
— Trading activity level. Displays intelligently (e.g., "12/mo", "1.5/wk", "3/day")
Exposure — Time in market / Total time × 100
— Lower = less risk
— Percentage of time the strategy had open positions
Main Row — Risk Metrics (Columns 15-22)
Sharpe Ratio — (Return - Rf) / StdDev × sqrt(Periods)
— >=3: Excellent, >=2: Good, >=1: Fair, <1: Poor
— Measures risk-adjusted return using total volatility. Annualized using sqrt(252) for daily
Sortino Ratio — (Return - Rf) / DownsideDev × sqrt(Periods)
— >=2: Excellent, >=1: Good, <1: Needs improvement
— Similar to Sharpe but only penalizes downside volatility. Can be higher than Sharpe
Max DD — (Peak - Trough) / Peak × 100
— <5%: Excellent, 5-15%: Moderate, 15-30%: High, >30%: Severe
— Largest peak-to-trough decline in equity. Critical for risk tolerance and position sizing
RoR — Risk of Ruin probability
— <1%: Excellent, 1-5%: Acceptable, 5-10%: Elevated, >10%: Dangerous
— Probability of losing entire trading account based on win rate and payoff ratio
R² — R-squared of equity curve vs. time
— >=0.95: Excellent, 0.90-0.95: Good, 0.80-0.90: Moderate, <0.80: Erratic
— Coefficient of determination measuring linearity of equity growth
MAR — CAGR / |Max Drawdown|
— Higher is better, negative = bad
— Calmar Ratio. Reward relative to worst-case loss. Negative if max DD exceeds CAGR
CVaR — Average of returns below VaR threshold
— Lower absolute is better
— Conditional Value at Risk (Expected Shortfall). Average loss in worst 5% of outcomes
p-value — Binomial test probability
— <0.05: Significant, 0.05-0.10: Marginal, >0.10: Likely random
— Probability that observed results are due to chance. Low p-value means statistically significant edge
Complementary Row — Extended Metrics
Compounding — (Compounded Return / Total Return) × 100
— Percentage of total profit attributable to compounding (position sizing)
Avg Win — Sum of wins / Win count
— Average profitable trade return in percentage
Avg Trade — Sum of all returns / Total trades
— Same as Expectancy (Column 5). Displayed here for convenience
Avg Loss — Sum of losses / Loss count
— Average unprofitable trade return in percentage (negative value)
Martin Ratio — CAGR / Ulcer Index
— Similar to Calmar but uses Ulcer Index instead of Max DD
Rolling Expectancy — Mean of rolling window expectancies
— Average expectancy calculated across rolling windows. Shows consistency of edge
Avg W Dur — Avg duration of winning trades
— Average time from entry to exit for winning trades only
Max Eq — Highest equity value reached
— Peak equity achieved during backtest
Min Eq — Lowest equity value reached
— Trough equity point. Important for understanding worst-case absolute loss
Buy & Hold — (Close_last / Close_first - 1) × 100
— >0%: Passive profit
— Return of simply buying and holding the asset from backtest start to end
Alpha — Strategy CAGR - Benchmark CAGR
— >0: Has skill (beats benchmark)
— Excess return above passive benchmark. Positive alpha indicates genuine value-added skill
Beta — Covariance(Strategy, Benchmark) / Variance(Benchmark)
— <1: Less volatile than market, >1: More volatile
— Systematic risk correlation with benchmark
Avg L Dur — Avg duration of losing trades
— Average time from entry to exit for losing trades only
Rolling Sharpe/Sortino — Dynamic based on win rate
— >2: Good consistency
— Rolling metric across sliding windows. Shows Sharpe if win rate >50%, Sortino if <=50%
Curr DD — Current drawdown from peak
— Lower is better
— Present drawdown percentage. Zero means at new equity high
DAR — CAGR adjusted for target DD
— Higher is better
— Drawdown-Adjusted Return. DAR^5 = CAGR if max DD = 5%
Kurtosis — Fourth moment / StdDev^4 - 3
— ~0: Normal, >0: Fat tails, <0: Thin tails
— Measures "tailedness" of return distribution (excess kurtosis)
Skewness — Third moment / StdDev^3
— >0: Positive skew (big wins), <0: Negative skew (big losses)
— Return distribution asymmetry
VaR — 5th percentile of returns
— Lower absolute is better
— Value at Risk at 95% confidence. Maximum expected loss in worst 5% of outcomes
Ulcer — sqrt(mean(drawdown^2))
— Lower is better
— Ulcer Index - root mean square of drawdowns. Penalizes both depth AND duration
━━━━━━━━━━━━━━━━━━━━━━━━━━━━━━━━━━
█ MONTE CARLO SIMULATION
Purpose
Monte Carlo simulation tests strategy robustness by randomizing the order of trades while keeping trade returns unchanged. This simulates alternative equity curves to assess outcome variability.
Method
Extract all historical trade returns
Randomly shuffle the sequence (1000+ iterations)
Calculate cumulative equity for each shuffle
Build distribution of final outcomes
Output
The stress test table shows:
Median Outcome: 50th percentile result
5th Percentile: Worst 5% of outcomes
95th Percentile: Best 95% of outcomes
Success Rate: Percentage of simulations that were profitable
Interpretation
If 95% of simulations are profitable: Strategy is robust
If median is far from actual result: High variance/unreliability
If 5th percentile shows large loss: High tail risk
━━━━━━━━━━━━━━━━━━━━━━━━━━━━━━━━━━
█ WALK-FORWARD ANALYSIS
Purpose
Walk-Forward Analysis (WFA) is the gold standard for detecting strategy overfitting. It simulates real-world trading by dividing historical data into rolling "training" (in-sample) and "validation" (out-of-sample) periods. A strategy that performs well on unseen data is more likely to succeed in live trading.
Method
The implementation uses a non-overlapping window approach following AmiBroker's gold standard methodology:
Segment Calculation: Total trades divided into N windows (default: 12), IS = ~75%, OOS = ~25%, Step = OOS length
Window Structure: Each window has IS (training) followed by OOS (validation). Each OOS becomes the next window's IS (rolling forward)
Metrics Calculated: CAGR, Sharpe, Sortino, MaxDD, Win Rate, Expectancy, Profit Factor, Payoff
Aggregation: IS metrics averaged across all IS periods, OOS metrics averaged across all OOS periods
Output
IS CAGR: In-sample annualized return
OOS CAGR: Out-of-sample annualized return ( THE key metric )
IS/OOS Sharpe: In/out-of-sample risk-adjusted return
Success Rate: % of OOS windows that were profitable
Interpretation
Robust: IS/OOS CAGR gap <20%, OOS Success Rate >80%
Some Overfitting: CAGR gap 20-50%, Success Rate 50-80%
Severe Overfitting: CAGR gap >50%, Success Rate <50%
Key Principles:
OOS is what matters — Only OOS predicts live performance
Consistency > Magnitude — 10% IS / 9% OOS beats 30% IS / 5% OOS
Window count — More windows = more reliable validation
Non-overlapping OOS — Prevents data leakage
━━━━━━━━━━━━━━━━━━━━━━━━━━━━━━━━━━
█ TABLE DISPLAY
Main Table — Organized into three sections:
Performance Metrics (Cols 0-6): Net Profit, Payoff, Sample Size, Profit Factor, CAGR, Expectancy, Monthly
Trade Statistics (Cols 7-14): Avg Duration, Max CW, Max CL, Win, BE, Loss, Frequency, Exposure
Risk Metrics (Cols 15-22): Sharpe, Sortino, Max DD, RoR, R², MAR, CVaR, p-value
Color Coding
🟢 Green: Excellent performance
🟠 Orange: Acceptable performance
⚪ Gray: Neutral / Fair
🔴 Red: Poor performance
━━━━━━━━━━━━━━━━━━━━━━━━━━━━━━━━━━
█ IMPLEMENTATION NOTES
Data Source: All metrics calculated from strategy.closedtrades , ensuring compatibility with any Pine Script strategy
Calculation Timing: All calculations occur on barstate.islastconfirmedhistory to optimize performance
Limitations: Requires at least 1 closed trade for basic metrics, 30+ trades for reliable statistical analysis
━━━━━━━━━━━━━━━━━━━━━━━━━━━━━━━━━━
█ QUICK NOTES
➙ This library has been developed and refined over two years of real-world strategy testing. Every calculation has been validated against industry-standard quantitative finance references.
➙ The entire codebase is thoroughly documented inline. If you are curious about how a metric is calculated or want to understand the implementation details, dive into the source code -- it is written to be read and learned from.
➙ This description focuses on usage and concepts rather than exhaustively listing every exported type and function. The library source code is thoroughly documented inline -- explore it to understand implementation details and internal logic.
➙ All calculations execute on barstate.islastconfirmedhistory to minimize runtime overhead. The library is designed for efficiency without sacrificing accuracy.
➙ Beyond analysis, this library serves as a learning resource. Study the source code to understand quantitative finance concepts, Pine Script advanced techniques, and proper statistical methodology.
➙ Metrics are their own not binary good/bad indicators. A high Sharpe ratio with low sample size is misleading. A deep drawdown during a market crash may be acceptable. Study each function and metric individually -- evaluate your strategy contextually, not by threshold alone.
➙ All strategies face alpha decay over time. Instead of over-optimizing a single strategy on one timeframe and market, build a diversified portfolio across multiple markets and timeframes. Deeptest helps you validate each component so you can combine robust strategies into a trading portfolio.
➙ Screenshots shown in the documentation are solely for visual representation to demonstrate how the tables and metrics will be displayed. Please do not compare your strategy's performance with the metrics shown in these screenshots -- they are illustrative examples only, not performance targets or benchmarks.
━━━━━━━━━━━━━━━━━━━━━━━━━━━━━━━━━━
█ HOW-TO
Using Deeptest is intentionally straightforward. Just import the library and call DT.runDeeptest() at the end of your strategy code in main scope. .
//@version=6
strategy("My Strategy", overlay=true)
// Import the library
import Fractalyst/Deeptest/1 as DT
// Your strategy logic
fastMA = ta.sma(close, 10)
slowMA = ta.sma(close, 30)
if ta.crossover(fastMA, slowMA)
strategy.entry("Long", strategy.long)
if ta.crossunder(fastMA, slowMA)
strategy.close("Long")
// Run the analysis
DT.runDeeptest()
And yes... it's compatible with any TradingView Strategy! 🪄
━━━━━━━━━━━━━━━━━━━━━━━━━━━━━━━━━━
█ CREDITS
Author: @Fractalyst
Font Library: by @fikira - @kaigouthro - @Duyck
Community: Inspired by the @PineCoders community initiative, encouraging developers to contribute open-source libraries and continuously enhance the Pine Script ecosystem for all traders.
if you find Deeptest valuable in your trading journey, feel free to use it in your strategies and give a shoutout to @Fractalyst -- Your recognition directly supports ongoing development and open-source contributions to Pine Script.
━━━━━━━━━━━━━━━━━━━━━━━━━━━━━━━━━━
█ DISCLAIMER
This library is provided for educational and research purposes. Past performance does not guarantee future results. Always test thoroughly and use proper risk management. The author is not responsible for any trading losses incurred through the use of this code.
lib_ephemeris █ PLANETARY EPHEMERIS MASTER LIBRARY
Unified API for calculating planetary positions. Import this single library to access all 11 celestial bodies: Sun, Moon, Mercury, Venus, Earth, Mars, Jupiter, Saturn, Uranus, Neptune, and Pluto.
Theory: VSOP87 (planets), ELP2000-82 (Moon), Meeus (Pluto)
═══════════════════════════════════════════════════════════════
█ QUICK START
//@version=6
indicator("Planetary Ephemeris Demo")
import BlueprintResearch/lib_ephemeris/1 as eph
// Get all planets
sun = eph.string_to_planet("Sun")
moon = eph.string_to_planet("Moon")
mercury = eph.string_to_planet("Mercury")
venus = eph.string_to_planet("Venus")
mars = eph.string_to_planet("Mars")
jupiter = eph.string_to_planet("Jupiter")
saturn = eph.string_to_planet("Saturn")
uranus = eph.string_to_planet("Uranus")
neptune = eph.string_to_planet("Neptune")
pluto = eph.string_to_planet("Pluto")
// Get longitude for each planet (geocentric)
sun_lon = eph.get_longitude(sun, time, true)
moon_lon = eph.get_longitude(moon, time, true)
mercury_lon = eph.get_longitude(mercury, time, true)
venus_lon = eph.get_longitude(venus, time, true)
mars_lon = eph.get_longitude(mars, time, true)
jupiter_lon = eph.get_longitude(jupiter, time, true)
saturn_lon = eph.get_longitude(saturn, time, true)
uranus_lon = eph.get_longitude(uranus, time, true)
neptune_lon = eph.get_longitude(neptune, time, true)
pluto_lon = eph.get_longitude(pluto, time, true)
// Plot all planets
plot(sun_lon, "Sun", color.yellow)
plot(moon_lon, "Moon", color.silver)
plot(mercury_lon, "Mercury", color.orange)
plot(venus_lon, "Venus", color.green)
plot(mars_lon, "Mars", color.red)
plot(jupiter_lon, "Jupiter", color.purple)
plot(saturn_lon, "Saturn", color.olive)
plot(uranus_lon, "Uranus", color.aqua)
plot(neptune_lon, "Neptune", color.blue)
plot(pluto_lon, "Pluto", color.gray)
═══════════════════════════════════════════════════════════════
█ AVAILABLE FUNCTIONS
Core Data Access:
• string_to_planet(string) → Planet enum
• get_longitude(Planet, time, preferGeo) → degrees [0, 360)
• get_declination(Planet, time) → degrees
• get_speed(Planet, time) → degrees/day
• is_retrograde(Planet, time) → true/false
Planetary Averages:
• get_avg6_geo_lon(time) → 6 outer planets average
• get_avg6_helio_lon(time)
• get_avg8_geo_lon(time) → 8 classical planets average
• get_avg8_helio_lon(time)
Utility:
• normalizeLongitude(lon) → normalize to [0, 360)
═══════════════════════════════════════════════════════════════
█ SUPPORTED PLANET STRINGS
Works with symbols or plain names (case-insensitive):
• "☉︎ Sun" or "Sun"
• "☽︎ Moon" or "Moon"
• "☿ Mercury" or "Mercury"
• "♀ Venus" or "Venus"
• "🜨 Earth" or "Earth"
• "♂ Mars" or "Mars"
• "♃ Jupiter" or "Jupiter"
• "♄ Saturn" or "Saturn"
• "⛢ Uranus" or "Uranus"
• "♆ Neptune" or "Neptune"
• "♇ Pluto" or "Pluto"
═══════════════════════════════════════════════════════════════
█ COORDINATE SYSTEMS
Geocentric: Positions relative to Earth (default for Sun/Moon)
Heliocentric: Positions relative to the Sun
Use the preferGeo parameter in get_longitude():
• true = geocentric
• false = heliocentric
Sun and Moon always return geocentric (heliocentric not applicable).
═══════════════════════════════════════════════════════════════
█ FUTURE PROJECTIONS
Project planetary positions into the future using polylines:
import BlueprintResearch/lib_vsop_core/1 as core
// Get future timestamp (250 bars ahead)
future_time = core.get_future_time(time, 250)
// Calculate future position
future_lon = eph.get_longitude(mars, future_time, true)
Use with polyline.new() to draw projected paths on your chart. See the commented showcase code in this library's source for a complete 250-bar projection example.
═══════════════════════════════════════════════════════════════
█ OPEN SOURCE
This library is part of an open-source planetary ephemeris project.
Free to use with attribution. MIT License.
═══════════════════════════════════════════════════════════════
█ REFERENCES
• Meeus, Jean. "Astronomical Algorithms" (2nd Ed., 1998)
• Bretagnon & Francou. "VSOP87 Solutions" (1988)
• Chapront-Touzé & Chapront. "ELP2000-82" (1983)
═══════════════════════════════════════════════════════════════
© 2025 BlueprintResearch (Javonnii) • MIT License
@version=6
normalizeLongitude(lon)
Normalizes any longitude value to the range [0, 360) degrees.
Parameters:
lon (float) : (float) Longitude in degrees (can be any value, including negative or >360).
Returns: (float) Normalized longitude in range [0, 360).
string_to_planet(planetStr)
Converts a planet string identifier to Planet enum value.
Parameters:
planetStr (string) : (string) Planet name (case-insensitive). Supports formats: "Sun", "☉︎ Sun", "sun", "SUN"
Returns: (Planet) Corresponding Planet enum. Returns Planet.Sun if string not recognized.
@note Supported planet strings: Sun, Moon, Mercury, Venus, Earth, Mars, Jupiter, Saturn, Uranus, Neptune, Pluto
get_longitude(p, t, preferGeo)
Returns planetary longitude with automatic coordinate system selection.
Parameters:
p (series Planet) : (Planet) Planet to query.
t (float) : (float) Unix timestamp in milliseconds (use built-in 'time' variable).
preferGeo (bool) : (bool) If true, return geocentric; if false, return heliocentric.
Returns: (float) Longitude in degrees, normalized to range [0, 360).
@note Sun and Moon always return geocentric regardless of preference (heliocentric not applicable).
get_declination(p, t)
Returns planetary geocentric equatorial declination.
Parameters:
p (series Planet) : (Planet) Planet to query.
t (float) : (float) Unix timestamp in milliseconds (use built-in 'time' variable).
Returns: (float) Geocentric declination in degrees, range where positive is north.
@note Declination is always geocentric (no heliocentric equivalent in library).
get_speed(p, t)
Returns planetary geocentric longitude speed (rate of change).
Parameters:
p (series Planet) : (Planet) Planet to query.
t (float) : (float) Unix timestamp in milliseconds (use built-in 'time' variable).
Returns: (float) Geocentric longitude speed in degrees per day. Negative values indicate retrograde motion. Returns na for Moon.
@note Speed is always geocentric (no heliocentric equivalent in library). Moon speed calculation not implemented.
get_avg6_geo_lon(t)
get_avg6_geo_lon
@description Returns the arithmetic average of the geocentric longitudes for the six outer planets: Mars, Jupiter, Saturn, Uranus, Neptune, and Pluto.
Parameters:
t (float) : (float) Time in Unix timestamp (milliseconds).
Returns: (float) Average geocentric longitude of the six outer planets in degrees, range [0, 360).
get_avg6_helio_lon(t)
get_avg6_helio_lon
@description Returns the arithmetic average of the heliocentric longitudes for the six outer planets: Mars, Jupiter, Saturn, Uranus, Neptune, and Pluto.
Parameters:
t (float) : (float) Time in Unix timestamp (milliseconds).
Returns: (float) Average heliocentric longitude of the six outer planets in degrees, range [0, 360).
get_avg8_geo_lon(t)
get_avg8_geo_lon
@description Returns the arithmetic average of the geocentric longitudes for all eight classical planets: Mercury, Venus, Mars, Jupiter, Saturn, Uranus, Neptune, and Pluto.
Parameters:
t (float) : (float) Time in Unix timestamp (milliseconds).
Returns: (float) Average geocentric longitude of all eight classical planets in degrees, range [0, 360).
get_avg8_helio_lon(t)
get_avg8_helio_lon
@description Returns the arithmetic average of the heliocentric longitudes for all eight classical planets: Mercury, Venus, Mars, Jupiter, Saturn, Uranus, Neptune, and Pluto.
Parameters:
t (float) : (float) Time in Unix timestamp (milliseconds).
Returns: (float) Average heliocentric longitude of all eight classical planets in degrees, range [0, 360).
is_retrograde(p, t)
Returns true if the planet is currently in retrograde motion (geocentric speed < 0) == 0 = stationary.
Parameters:
p (series Planet) : The planet to check.
t (float) : Time in Unix timestamp (milliseconds).
Returns: true if the planet is in retrograde, false otherwise.
lib_vsop87_mercuryLibrary "lib_vsop87_mercury"
Heliocentric and geocentric position calculations for Mercury
using VSOP87 theory. Provides longitude, latitude, radius, speed,
and declination functions.
@author BlueprintResearch (Javonnii)
@license MIT License - Free to use with attribution
@theory VSOP87A (Heliocentric rectangular coordinates)
@accuracy Truncated series (~10-15 terms per series) - arcsecond precision
@time_scale Julian millennia from J2000.0 (use core.get_julian_millennia)
@reference Meeus, Jean. "Astronomical Algorithms" (2nd Ed., 1998)
Bretagnon & Francou. "VSOP87 Solutions" (1988)
@showcase Includes commented showcase code with 250-bar future projection.
Uncomment to display Mercury data with polyline projections.
@open_source This library is part of an open-source alternative to
proprietary astronomical libraries. Study, modify, and
share freely. We believe knowledge of the cosmos belongs
to everyone.
════════════════════════════════════════════════════════════════
© 2025 BlueprintResearch / Javonnii
Licensed under MIT License
════════════════════════════════════════════════════════════════
@version=6
import BlueprintResearch/lib_vsop_core/1 as core
get_helio_lon(t)
Computes Mercury's heliocentric ecliptic longitude using VSOP87 theory.
Parameters:
t (float) : (float) Julian millennia from J2000.0 (use core.get_julian_millennia(time)).
Returns: (float) Heliocentric ecliptic longitude in degrees, normalized to range [0, 360).
get_helio_lat(t)
Computes Mercury's heliocentric ecliptic latitude using VSOP87 theory.
Parameters:
t (float) : (float) Julian millennia from J2000.0 (use core.get_julian_millennia(time)).
Returns: (float) Heliocentric ecliptic latitude in radians, range approximately . Note: Returns radians, not degrees.
get_helio_radius(t)
Computes Mercury's heliocentric radius (distance from Sun) using VSOP87 theory.
Parameters:
t (float) : (float) Julian millennia from J2000.0 (use core.get_julian_millennia(time)).
Returns: (float) Heliocentric radius in astronomical units (AU). Typical range is 0.31-0.47 AU.
get_geo_speed(t)
Computes Mercury's geocentric longitude speed (rate of change over time).
Parameters:
t (float) : (float) Julian millennia from J2000.0 (use core.get_julian_millennia(time)).
Returns: (float) Geocentric longitude speed in degrees per day. Negative values indicate retrograde motion (apparent backward movement).
get_geo_lon(t)
Computes Mercury's geocentric ecliptic longitude (as seen from Earth).
Parameters:
t (float) : (float) Julian millennia from J2000.0 (use core.get_julian_millennia(time)).
Returns: (float) Geocentric ecliptic longitude in degrees, normalized to range [0, 360).
get_geo_ecl_lat(t)
Computes Mercury's geocentric ecliptic latitude (as seen from Earth).
Parameters:
t (float) : (float) Julian millennia from J2000.0 (use core.get_julian_millennia(time)).
Returns: (float) Geocentric ecliptic latitude in degrees, range approximately .
get_geo_decl(t)
Computes Mercury's geocentric equatorial declination (as seen from Earth).
Parameters:
t (float) : (float) Julian millennia from J2000.0 (use core.get_julian_millennia(time)).
Returns: (float) Geocentric equatorial declination in degrees, range where positive is north.
lib_vsop87_venusLibrary "lib_vsop87_venus"
Heliocentric and geocentric position calculations for Venus
using VSOP87 theory. Provides longitude, latitude, radius, speed,
and declination functions.
@author BlueprintResearch (Javonnii)
@license MIT License - Free to use with attribution
@theory VSOP87A (Heliocentric rectangular coordinates)
@accuracy Truncated series (~10-15 terms per series) - arcsecond precision
@time_scale Julian millennia from J2000.0 (use core.get_julian_millennia)
@reference Meeus, Jean. "Astronomical Algorithms" (2nd Ed., 1998)
Bretagnon & Francou. "VSOP87 Solutions" (1988)
@showcase Includes commented showcase code with 250-bar future projection.
Uncomment to display Venus data with polyline projections.
@open_source This library is part of an open-source alternative to
proprietary astronomical libraries. Study, modify, and
share freely. We believe knowledge of the cosmos belongs
to everyone.
════════════════════════════════════════════════════════════════
© 2025 BlueprintResearch / Javonnii
Licensed under MIT License
════════════════════════════════════════════════════════════════
@version=6
import BlueprintResearch/lib_vsop_core/1 as core
get_helio_lon(t)
Computes Venus's heliocentric ecliptic longitude using VSOP87 theory.
Parameters:
t (float) : (float) Julian millennia from J2000.0 (use core.get_julian_millennia(time)).
Returns: (float) Heliocentric ecliptic longitude in degrees, normalized to range [0, 360).
get_helio_lat(t)
Computes Venus's heliocentric ecliptic latitude using VSOP87 theory.
Parameters:
t (float) : (float) Julian millennia from J2000.0 (use core.get_julian_millennia(time)).
Returns: (float) Heliocentric ecliptic latitude in radians, range approximately . Note: Returns radians, not degrees.
get_helio_radius(t)
Computes Venus's heliocentric radius (distance from Sun) using VSOP87 theory.
Parameters:
t (float) : (float) Julian millennia from J2000.0 (use core.get_julian_millennia(time)).
Returns: (float) Heliocentric radius in astronomical units (AU). Typical range is 0.72-0.73 AU.
get_geo_speed(t)
Computes Venus's geocentric longitude speed (rate of change over time).
Parameters:
t (float) : (float) Julian millennia from J2000.0 (use core.get_julian_millennia(time)).
Returns: (float) Geocentric longitude speed in degrees per day. Negative values indicate retrograde motion (apparent backward movement).
get_geo_lon(t)
Computes Venus's geocentric ecliptic longitude (as seen from Earth).
Parameters:
t (float) : (float) Julian millennia from J2000.0 (use core.get_julian_millennia(time)).
Returns: (float) Geocentric ecliptic longitude in degrees, normalized to range [0, 360).
get_geo_ecl_lat(t)
Computes Venus's geocentric ecliptic latitude (as seen from Earth).
Parameters:
t (float) : (float) Julian millennia from J2000.0 (use core.get_julian_millennia(time)).
Returns: (float) Geocentric ecliptic latitude in degrees, range approximately .
get_geo_decl(t)
Computes Venus's geocentric equatorial declination (as seen from Earth).
Parameters:
t (float) : (float) Julian millennia from J2000.0 (use core.get_julian_millennia(time)).
Returns: (float) Geocentric equatorial declination in degrees, range where positive is north.
lib_vsop87_uranusLibrary "lib_vsop87_uranus"
Heliocentric and geocentric position calculations for Uranus
using VSOP87 theory. Provides longitude, latitude, radius, speed,
and declination functions.
@author BlueprintResearch (Javonnii)
@license MIT License - Free to use with attribution
@theory VSOP87A (Heliocentric rectangular coordinates)
@accuracy Truncated series (~10-15 terms per series) - arcsecond precision
@time_scale Julian millennia from J2000.0 (use core.get_julian_millennia)
@reference Meeus, Jean. "Astronomical Algorithms" (2nd Ed., 1998)
Bretagnon & Francou. "VSOP87 Solutions" (1988)
@showcase Includes commented showcase code with 250-bar future projection.
Uncomment to display Uranus data with polyline projections.
@open_source This library is part of an open-source alternative to
proprietary astronomical libraries. Study, modify, and
share freely. We believe knowledge of the cosmos belongs
to everyone.
════════════════════════════════════════════════════════════════
© 2025 BlueprintResearch / Javonnii
Licensed under MIT License
════════════════════════════════════════════════════════════════
@version=6
import BlueprintResearch/lib_vsop_core/1 as core
get_helio_lon(t)
Computes Uranus's heliocentric ecliptic longitude using VSOP87 theory.
Parameters:
t (float) : (float) Julian millennia from J2000.0 (use core.get_julian_millennia(time)).
Returns: (float) Heliocentric ecliptic longitude in degrees, normalized to range [0, 360).
get_helio_lat(t)
Computes Uranus's heliocentric ecliptic latitude using VSOP87 theory.
Parameters:
t (float) : (float) Julian millennia from J2000.0 (use core.get_julian_millennia(time)).
Returns: (float) Heliocentric ecliptic latitude in radians, range approximately . Note: Returns radians, not degrees.
get_helio_radius(t)
Computes Uranus's heliocentric radius (distance from Sun) using VSOP87 theory.
Parameters:
t (float) : (float) Julian millennia from J2000.0 (use core.get_julian_millennia(time)).
Returns: (float) Heliocentric radius in astronomical units (AU). Typical range is 18.28-20.09 AU.
get_geo_speed(t)
Computes Uranus's geocentric longitude speed (rate of change over time).
Parameters:
t (float) : (float) Julian millennia from J2000.0 (use core.get_julian_millennia(time)).
Returns: (float) Geocentric longitude speed in degrees per day. Negative values indicate retrograde motion (apparent backward movement).
get_geo_lon(t)
Computes Uranus's geocentric ecliptic longitude (as seen from Earth).
Parameters:
t (float) : (float) Julian millennia from J2000.0 (use core.get_julian_millennia(time)).
Returns: (float) Geocentric ecliptic longitude in degrees, normalized to range [0, 360).
get_geo_ecl_lat(t)
Computes Uranus's geocentric ecliptic latitude (as seen from Earth).
Parameters:
t (float) : (float) Julian millennia from J2000.0 (use core.get_julian_millennia(time)).
Returns: (float) Geocentric ecliptic latitude in degrees, range approximately .
get_geo_decl(t)
Computes Uranus's geocentric equatorial declination (as seen from Earth).
Parameters:
t (float) : (float) Julian millennia from J2000.0 (use core.get_julian_millennia(time)).
Returns: (float) Geocentric equatorial declination in degrees, range where positive is north.
lib_vsop87_neptuneLibrary "lib_vsop87_neptune"
Heliocentric and geocentric position calculations for Neptune
using VSOP87 theory. Provides longitude, latitude, radius, speed,
and declination functions.
@author BlueprintResearch (Javonnii)
@license MIT License - Free to use with attribution
@theory VSOP87A (Heliocentric rectangular coordinates)
@accuracy Truncated series (~10-15 terms per series) - arcsecond precision
@time_scale Julian millennia from J2000.0 (use core.get_julian_millennia)
@reference Meeus, Jean. "Astronomical Algorithms" (2nd Ed., 1998)
Bretagnon & Francou. "VSOP87 Solutions" (1988)
@showcase Includes commented showcase code with 250-bar future projection.
Uncomment to display Neptune data with polyline projections.
@open_source This library is part of an open-source alternative to
proprietary astronomical libraries. Study, modify, and
share freely. We believe knowledge of the cosmos belongs
to everyone.
════════════════════════════════════════════════════════════════
© 2025 BlueprintResearch / Javonnii
Licensed under MIT License
════════════════════════════════════════════════════════════════
@version=6
import BlueprintResearch/lib_vsop_core/1 as core
get_helio_lon(t)
Computes Neptune's heliocentric ecliptic longitude using VSOP87 theory.
Parameters:
t (float) : (float) Julian millennia from J2000.0 (use core.get_julian_millennia(time)).
Returns: (float) Heliocentric ecliptic longitude in degrees, normalized to range [0, 360).
get_helio_lat(t)
Computes Neptune's heliocentric ecliptic latitude using VSOP87 theory.
Parameters:
t (float) : (float) Julian millennia from J2000.0 (use core.get_julian_millennia(time)).
Returns: (float) Heliocentric ecliptic latitude in radians, range approximately . Note: Returns radians, not degrees.
get_helio_radius(t)
Computes Neptune's heliocentric radius (distance from Sun) using VSOP87 theory.
Parameters:
t (float) : (float) Julian millennia from J2000.0 (use core.get_julian_millennia(time)).
Returns: (float) Heliocentric radius in astronomical units (AU). Typical range is 29.81-30.33 AU.
get_geo_speed(t)
Computes Neptune's geocentric longitude speed (rate of change over time).
Parameters:
t (float) : (float) Julian millennia from J2000.0 (use core.get_julian_millennia(time)).
Returns: (float) Geocentric longitude speed in degrees per day. Negative values indicate retrograde motion (apparent backward movement).
get_geo_lon(t)
Computes Neptune's geocentric ecliptic longitude (as seen from Earth).
Parameters:
t (float) : (float) Julian millennia from J2000.0 (use core.get_julian_millennia(time)).
Returns: (float) Geocentric ecliptic longitude in degrees, normalized to range [0, 360).
get_geo_ecl_lat(t)
Computes Neptune's geocentric ecliptic latitude (as seen from Earth).
Parameters:
t (float) : (float) Julian millennia from J2000.0 (use core.get_julian_millennia(time)).
Returns: (float) Geocentric ecliptic latitude in degrees, range approximately .
get_geo_decl(t)
Computes Neptune's geocentric equatorial declination (as seen from Earth).
Parameters:
t (float) : (float) Julian millennia from J2000.0 (use core.get_julian_millennia(time)).
Returns: (float) Geocentric equatorial declination in degrees, range where positive is north.
lib_meeus_plutoLibrary "lib_meeus_pluto"
Heliocentric and geocentric position calculations for Pluto using
Meeus truncated analytical series. Valid ±1 century from J2000.
@author BlueprintResearch (Javonnii)
@license MIT License - Free to use with attribution
@theory Meeus truncated series (not full planetary theory)
@accuracy Arcminute precision within ±1 century of J2000
@time_scale Julian centuries from J2000.0 (use core.get_julian_centuries)
@reference Meeus, Jean. "Astronomical Algorithms" (2nd Ed., 1998), Chapter 37
@showcase Includes commented showcase code with 250-bar future projection.
Uncomment to display Pluto data with polyline projections.
@open_source This library is part of an open-source alternative to
proprietary astronomical libraries. Study, modify, and
share freely. We believe knowledge of the cosmos belongs
to everyone.
════════════════════════════════════════════════════════════════
© 2025 BlueprintResearch / Javonnii
Licensed under MIT License
════════════════════════════════════════════════════════════════
@version=6
import BlueprintResearch/lib_vsop_core/1 as core
get_helio_lon(t)
Computes Pluto's heliocentric ecliptic longitude using Meeus truncated analytical series.
Parameters:
t (float) : (float) Julian centuries from J2000.0 (use core.get_julian_centuries(time)).
Returns: (float) Heliocentric ecliptic longitude in degrees, normalized to range [0, 360). Accurate within ±1 century from J2000.
get_helio_lat(t)
Computes Pluto's heliocentric ecliptic latitude using Meeus truncated analytical series.
Parameters:
t (float) : (float) Julian centuries from J2000.0 (use core.get_julian_centuries(time)).
Returns: (float) Heliocentric ecliptic latitude in degrees, range approximately . Accurate within ±1 century from J2000.
get_helio_radius(t)
Computes Pluto's heliocentric radius (distance from Sun) using Meeus truncated analytical series.
Parameters:
t (float) : (float) Julian centuries from J2000.0 (use core.get_julian_centuries(time)).
Returns: (float) Heliocentric radius in astronomical units (AU). Typical range is 29.6-49.3 AU. Accurate within ±1 century from J2000.
get_geo_lon(t)
Computes Pluto's geocentric ecliptic longitude (as seen from Earth).
Parameters:
t (float) : (float) Julian centuries from J2000.0 (use core.get_julian_centuries(time)).
Returns: (float) Geocentric ecliptic longitude in degrees, normalized to range [0, 360).
get_geo_ecl_lat(t)
Computes Pluto's geocentric ecliptic latitude (as seen from Earth).
Parameters:
t (float) : (float) Julian centuries from J2000.0 (use core.get_julian_centuries(time)).
Returns: (float) Geocentric ecliptic latitude in degrees, range approximately .
get_geo_decl(t)
Computes Pluto's geocentric equatorial declination (as seen from Earth).
Parameters:
t (float) : (float) Julian centuries from J2000.0 (use core.get_julian_centuries(time)).
Returns: (float) Geocentric equatorial declination in degrees, range where positive is north.
get_geo_speed(t)
Computes Pluto's geocentric longitude speed (rate of change over time).
Parameters:
t (float) : (float) Julian centuries from J2000.0 (use core.get_julian_centuries(time)).
Returns: (float) Geocentric longitude speed in degrees per day. Negative values indicate retrograde motion (apparent backward movement).
lib_vsop_coreLibrary "lib_vsop_core"
Foundation library providing core types, evaluators, and utilities
for VSOP87 planetary theory calculations. Required by all planetary
libraries. Includes Earth heliocentric model and Sun geocentric functions.
@author BlueprintResearch (Javonnii)
@license MIT License - Free to use with attribution
@theory VSOP87 (Variations Séculaires des Orbites Planétaires)
@accuracy Truncated series - suitable for financial astrology and education
@time_scale Julian millennia from J2000.0 for VSOP87 planets
Julian centuries from J2000.0 for Moon and Pluto
@reference Meeus, Jean. "Astronomical Algorithms" (2nd Ed., 1998)
Bretagnon & Francou. "VSOP87 Solutions" (1988)
@showcase Includes commented showcase code with 250-bar future projection.
Uncomment to display Sun/Earth data with polyline projections.
@open_source This library is part of an open-source alternative to
proprietary astronomical libraries. Study, modify, and
share freely. We believe knowledge of the cosmos belongs
to everyone.
════════════════════════════════════════════════════════════════
© 2025 BlueprintResearch / Javonnii
Licensed under MIT License
════════════════════════════════════════════════════════════════
@version=6
get_julian_millennia(time_)
Parameters:
time_ (float)
get_julian_centuries(time_)
Parameters:
time_ (float)
eval_vsop87(terms, t)
Parameters:
terms (array)
t (float)
eval_vsop87_derivative(terms, t)
Parameters:
terms (array)
t (float)
mod360(x)
Parameters:
x (float)
custom_atan2(y, x)
Parameters:
y (float)
x (float)
get_earth_helio_radius(t)
Parameters:
t (float)
get_earth_helio_coords(t)
Parameters:
t (float)
get_obliquity(t)
Parameters:
t (float)
get_earth_helio_lon(t)
Parameters:
t (float)
get_sun_geo_lon(t)
Parameters:
t (float)
get_sun_geo_speed(t)
Parameters:
t (float)
get_sun_decl(t)
Parameters:
t (float)
get_bar_gap_ms()
Get bar interval in milliseconds for current timeframe
Returns: (int) Time interval between bars in milliseconds
get_future_time(current_time, bars_ahead)
Calculate future timestamp for projection plotting
Parameters:
current_time (int) : (int) Current bar time in milliseconds (use built-in 'time')
bars_ahead (int) : (int) Number of bars to project into future
Returns: (int) Future timestamp suitable for xloc.bar_time and chart.point.from_time
is_projection_bar()
Check if current bar is suitable for drawing future projections
Returns: (bool) True on last bar when projections should be drawn
vsop_term
Fields:
amp (series float)
phase (series float)
freq (series float)
PA SystemPA System - Price Action Trading System
价格行为交易系统
📊 概述 / Overview
PA System is a comprehensive price action trading indicator that combines Smart Money Concepts (SMC), market structure analysis, and multi-timeframe confirmation to identify high-probability trade setups. Designed for both manual traders and algorithmic trading systems.
PA System 是一个综合性价格行为交易指标,结合了Smart Money概念(SMC)、市场结构分析和多时间框架确认,用于识别高概率交易机会。适用于手动交易者和算法交易系统。
✨ 核心特性 / Key Features
🎯 Four-Phase Signal System / 四阶段信号系统
H1 (First Pullback) - Initial bullish retracement in uptrend
H2 (Confirmed Entry) - Breakout confirmation for long entries
L1 (First Bounce) - Initial bearish bounce in downtrend
L2 (Confirmed Entry) - Breakdown confirmation for short entries
中文说明:
H1(首次回调) - 上升趋势中的初次回撤信号
H2(确认入场) - 突破确认的做多入场点
L1(首次反弹) - 下降趋势中的初次反弹信号
L2(确认入场) - 跌破确认的做空入场点
📐 Market Structure Detection / 市场结构识别
HH (Higher High) - Uptrend confirmation / 上升趋势确认
HL (Higher Low) - Bullish pullback / 多头回调
LH (Lower High) - Bearish bounce / 空头反弹
LL (Lower Low) - Downtrend confirmation / 下降趋势确认
💎 Smart Money Concepts (SMC) / 智能资金概念
BoS (Break of Structure) - Trend continuation signal / 趋势延续信号
CHoCH (Change of Character) - Potential trend reversal / 潜在趋势反转
📈 Dynamic Trendlines / 动态趋势线
Auto-drawn support and resistance trendlines / 自动绘制支撑阻力趋势线
Real-time extension to current bar / 实时延伸至当前K线
Slope-filtered for accuracy / 斜率过滤确保准确性
🎚️ Multi-Timeframe Analysis / 多时间框架分析
Higher timeframe trend filter (default 4H) / 大周期趋势过滤(默认4小时)
Prevents counter-trend trades / 防止逆势交易
Configurable timeframe / 可配置时间周期
📊 Volume Confirmation / 成交量确认
Filters signals based on volume strength / 基于成交量强度过滤信号
20-period volume MA comparison / 与20期成交量均线对比
High-volume bars highlighted / 高成交量K线高亮显示
🎯 Risk Management Tools / 风险管理工具
Automatic SL/TP calculation and display / 自动计算并显示止损止盈
Visual stop loss and take profit lines / 可视化止损止盈线条
Risk percentage and R:R ratio display / 显示风险百分比和盈亏比
Dynamic stop loss sizing (0.3% - 1.5%) / 动态止损范围(0.3% - 1.5%)
📱 Real-Time Alerts / 实时警报
Instant notifications on H2/L2 signals / H2/L2信号即时通知
Webhook support for automation / 支持Webhook自动化
Mobile, email, and popup alerts / 手机、邮件和弹窗警报
📊 Professional Dashboard / 专业仪表盘
Real-time market state (CHANNEL/RANGE/BREAKOUT) / 实时市场状态
Local and MTF trend indicators / 本地及大周期趋势指标
Order flow status (HIGH VOL / LOW VOL) / 订单流状态
Last signal tracker / 最新信号追踪
🔧 参数设置 / Parameter Settings
Structure Settings / 结构设置
Parameter Default Range Description
Swing Length / 摆动长度 5 2-20 Pivot detection sensitivity / 枢轴点检测灵敏度
Trend Confirm Bars / 趋势确认根数 3 2-10 Consecutive bars for breakout / 突破所需连续K线数
Channel ATR Mult / 通道ATR倍数 2.0 1.0-5.0 Range detection threshold / 区间检测阈值
Signal Settings / 信号设置
Parameter Default Description
Enable H2 Longs / 启用H2做多 ✅ Toggle long signals / 开关做多信号
Enable L2 Shorts / 启用L2做空 ✅ Toggle short signals / 开关做空信号
Micro Range Length / 微平台长度 3 Breakout detection bars / 突破检测K线数
Close Strength / 收盘强度 0.6 Minimum close position in bar / K线内最小收盘位置
Filter Settings / 过滤设置
Parameter Default Description
Use MTF Filter / 大周期过滤 ✅ Enable higher timeframe filter / 启用大周期过滤
MTF Timeframe / 大周期时间框架 240 (4H) Higher timeframe period / 大周期时间
Use Volume Filter / 成交量过滤 ✅ Require high volume confirmation / 需要高成交量确认
Volume MA Length / 成交量均线周期 20 Volume comparison period / 成交量对比周期
Fast EMA / 快速EMA 20 Short-term trend / 短期趋势
Slow EMA / 慢速EMA 50 Long-term trend / 长期趋势
Risk Management / 风险管理
Parameter Default Description
Risk % / 风险百分比 1.0% Risk per trade / 每笔交易风险
R:R Ratio / 盈亏比 2.0 Reward to risk ratio / 盈亏比率
Max SL ATR / 最大止损ATR 3.0 Maximum stop loss in ATR / 最大止损ATR倍数
Min SL % / 最小止损百分比 0.3% Minimum stop loss percentage / 最小止损百分比
Max SL % / 最大止损百分比 1.5% Maximum stop loss percentage / 最大止损百分比
📖 使用方法 / How to Use
1. 基础设置 / Basic Setup
For Day Trading (5-15 min charts) / 日内交易(5-15分钟图)
text
Swing Length: 5
MTF Timeframe: 240 (4H)
Risk %: 1.0%
R:R: 2.0
For Swing Trading (1-4H charts) / 波段交易(1-4小时图)
text
Swing Length: 8
MTF Timeframe: D (Daily)
Risk %: 0.5%
R:R: 3.0
For Scalping (1-5 min charts) / 剥头皮(1-5分钟图)
text
Swing Length: 3
MTF Timeframe: 60 (1H)
Risk %: 0.5%
R:R: 1.5
Use Volume Filter: ✅
2. 信号识别 / Signal Identification
Long Entry / 做多入场
✅ Dashboard shows "Local Trend: BULL" / 仪表盘显示"本地趋势:多头"
✅ MTF Trend shows "BULLISH" / 大周期趋势显示"看涨"
✅ Green circle (H1) appears below bar / 绿色圆点(H1)出现在K线下方
⏳ Wait for H2 signal (green triangle ▲) / 等待H2信号(绿色三角▲)
📊 Check volume bar is cyan (HIGH VOL) / 检查成交量柱为青色(高成交量)
🎯 Enter at close of H2 bar / 在H2 K线收盘价入场
🛡️ Set SL at red dashed line / 止损设在红色虚线位置
🎁 Set TP at green dashed line / 止盈设在绿色虚线位置
Short Entry / 做空入场
✅ Dashboard shows "Local Trend: BEAR" / 仪表盘显示"本地趋势:空头"
✅ MTF Trend shows "BEARISH" / 大周期趋势显示"看跌"
✅ Red circle (L1) appears above bar / 红色圆点(L1)出现在K线上方
⏳ Wait for L2 signal (red triangle ▼) / 等待L2信号(红色倒三角▼)
📊 Check volume bar is cyan (HIGH VOL) / 检查成交量柱为青色(高成交量)
🎯 Enter at close of L2 bar / 在L2 K线收盘价入场
🛡️ Set SL at red dashed line / 止损设在红色虚线位置
🎁 Set TP at green dashed line / 止盈设在绿色虚线位置
3. 警报设置 / Alert Setup
Step-by-Step / 分步操作
Click the "⏰" alert icon on chart / 点击图表上的"⏰"警报图标
Select "PA System - Indicator Version" / 选择"PA System (V1.1) - Indicator Version"
Condition: "Any alert() function call" / 条件:选择"Any alert() function call"
Choose notification method: / 选择通知方式:
📱 Mobile Push / 手机推送
📧 Email / 邮件
🔗 Webhook URL (for automation) / Webhook网址(用于自动化)
Set frequency: "Once Per Bar Close" / 频率:选择"Once Per Bar Close"
Click "Create" / 点击"创建"
Webhook Example for IBKR API / IBKR API的Webhook示例
json
{
"signal": "{{strategy.order.action}}",
"ticker": "{{ticker}}",
"entry": {{close}},
"stop_loss": {{plot_0}},
"take_profit": {{plot_1}},
"timestamp": "{{timenow}}"
}
4. 交易管理 / Trade Management
Position Sizing / 仓位计算
text
Account: $10,000
Risk per Trade: 1% = $100
Entry Price: $690.45
Stop Loss: $687.38
Risk per Share: $690.45 - $687.38 = $3.07
Position Size: $100 / $3.07 = 32 shares
Partial Profit Taking / 部分止盈
Close 50% position at 1:1 R:R / 在1:1盈亏比时平仓50%
Move SL to breakeven / 移动止损至保本位
Let remaining 50% run to 2R target / 让剩余50%跑向2R目标
🎨 视觉元素说明 / Visual Elements Guide
Chart Markers / 图表标记
Symbol Color Meaning
⚫ Small Circle / 小圆点 🟢 Green / 绿色 H1 - First bullish pullback / 首次多头回调
▲ Triangle / 三角形 🟢 Green / 绿色 H2 - Confirmed long entry / 确认做多入场
⚫ Small Circle / 小圆点 🔴 Red / 红色 L1 - First bearish bounce / 首次空头反弹
▼ Inverted Triangle / 倒三角 🔴 Red / 红色 L2 - Confirmed short entry / 确认做空入场
Structure Labels / 结构标签
Label Position Meaning
HH Above high / 高点上方 Higher High - Bullish / 更高的高点-看涨
HL Below low / 低点下方 Higher Low - Bullish / 更高的低点-看涨
LH Above high / 高点上方 Lower High - Bearish / 更低的高点-看跌
LL Below low / 低点下方 Lower Low - Bearish / 更低的低点-看跌
BoS/CHoCH Lines / 破位线条
Type Color Width Meaning
BoS 🔵 Teal / 青色 2px Break of Structure - Trend continues / 结构突破-趋势延续
CHoCH 🔴 Red / 红色 2px Change of Character - Trend reversal / 性质改变-趋势反转
Trendlines / 趋势线
Type Color Style Meaning
Bullish / 看涨 🔵 Teal / 青色 Solid / 实线 Uptrend support / 上升趋势支撑
Bearish / 看跌 🔴 Red / 红色 Solid / 实线 Downtrend resistance / 下降趋势阻力
Risk Lines / 风险线条
Type Color Style Meaning
Stop Loss / 止损 🔴 Red / 红色 Dashed / 虚线 Suggested stop loss level / 建议止损位
Take Profit / 止盈 🟢 Green / 绿色 Dashed / 虚线 Suggested take profit level / 建议止盈位
Dashboard Colors / 仪表盘颜色
Status Color Meaning
BULL / 多头 🟢 Green / 绿色 Bullish trend / 看涨趋势
BEAR / 空头 🔴 Red / 红色 Bearish trend / 看跌趋势
NEUTRAL / 中性 ⚪ Gray / 灰色 No clear trend / 无明确趋势
BREAKOUT / 突破 🟡 Lime / 黄绿 Strong momentum / 强劲动能
HIGH VOL / 高成交量 🔵 Cyan / 青色 High volume confirmation / 高成交量确认
💡 交易策略建议 / Trading Strategy Tips
✅ High Probability Setups / 高概率设置
Trend Alignment / 趋势一致
Local Trend = BULL + MTF Trend = BULLISH / 本地多头 + 大周期看涨
Or: Local Trend = BEAR + MTF Trend = BEARISH / 或:本地空头 + 大周期看跌
Volume Confirmation / 成交量确认
H2/L2 signal appears with cyan volume bar / H2/L2信号伴随青色成交量柱
Volume > 20-period MA / 成交量 > 20期均线
Trendline Support / 趋势线支撑
H2 appears near bullish trendline / H2出现在看涨趋势线附近
L2 appears near bearish trendline / L2出现在看跌趋势线附近
BoS Confirmation / BoS确认
Recent BoS in same direction / 最近同方向的BoS
No CHoCH against the trade / 无逆向的CHoCH
❌ Avoid These Setups / 避免这些情况
Conflicting Trends / 趋势冲突
Local BULL but MTF BEARISH / 本地多头但大周期看跌
Market State = RANGE / 市场状态 = 区间
Low Volume / 低成交量
Order Flow shows "LOW VOL" / 订单流显示"低成交量"
Volume bar is red (below MA) / 成交量柱为红色(低于均线)
Against Trendline / 逆趋势线
Shorting at bullish trendline support / 在看涨趋势线支撑处做空
Buying at bearish trendline resistance / 在看跌趋势线阻力处做多
Recent CHoCH / 近期CHoCH
CHoCH appeared within 10 bars / 10根K线内出现CHoCH
Potential trend reversal zone / 潜在趋势反转区域
🔄 优化建议 / Optimization Tips
For Different Markets / 针对不同市场
Stocks / 股票
text
Swing Length: 5-8
MTF: 240 (4H) or D (Daily)
Risk %: 0.5-1.0%
Best on: SPY, QQQ, AAPL, TSLA
Forex / 外汇
text
Swing Length: 5
MTF: 240 (4H)
Risk %: 1.0-2.0%
Best on: EUR/USD, GBP/USD, USD/JPY
Use Volume Filter: OFF (Forex volume is unreliable)
Crypto / 加密货币
text
Swing Length: 3-5
MTF: 240 (4H)
Risk %: 0.5-1.0% (high volatility)
Max SL %: 2.0-3.0%
Best on: BTC, ETH, SOL
Futures / 期货
text
Swing Length: 5
MTF: 240 (4H)
Risk %: 1.0-1.5%
Best on: ES, NQ, RTY, CL
🤖 自动化集成 / Automation Integration
Python + IBKR API Example / Python + IBKR API示例
python
import requests
from ib_insync import *
def handle_tradingview_alert(alert_data):
"""
Receives webhook from TradingView alert
接收来自TradingView警报的webhook
"""
signal = alert_data # "H2 LONG" or "L2 SHORT"
ticker = alert_data # "SPY"
entry = alert_data # 690.45
stop_loss = alert_data # 687.38
take_profit = alert_data # 696.59
# Connect to IBKR
ib = IB()
ib.connect('127.0.0.1', 7497, clientId=1)
# Create contract
contract = Stock(ticker, 'SMART', 'USD')
# Calculate position size (1% risk)
account_value = ib.accountValues() .value
risk_amount = float(account_value) * 0.01
risk_per_share = abs(entry - stop_loss)
quantity = int(risk_amount / risk_per_share)
# Place order
if "LONG" in signal:
order = MarketOrder('BUY', quantity)
else:
order = MarketOrder('SELL', quantity)
trade = ib.placeOrder(contract, order)
# Set stop loss and take profit
ib.placeOrder(contract, StopOrder('SELL', quantity, stop_loss))
ib.placeOrder(contract, LimitOrder('SELL', quantity, take_profit))
ib.disconnect()
TradersPost Integration / TradersPost集成
Create TradersPost account / 创建TradersPost账户
Connect IBKR broker / 连接IBKR券商
Get Webhook URL / 获取Webhook网址
Add to TradingView alert / 添加到TradingView警报
Test with paper trading / 用模拟账户测试
📊 性能指标 / Performance Metrics
Expected Performance (Backtested) / 预期表现(回测)
Metric Value Notes
Win Rate / 胜率 60-75% With all filters enabled / 启用所有过滤器
Avg R:R / 平均盈亏比 1.8-2.2 Using 2R target / 使用2R目标
Max Drawdown / 最大回撤 8-12% 1% risk per trade / 每笔1%风险
Profit Factor / 盈利因子 1.8-2.5 Trend-following bias / 趋势跟随偏向
Best Markets / 最佳市场 Trending Avoid ranging markets / 避免区间市场
⚠️ Disclaimer: Past performance does not guarantee future results. Always test in paper trading first.
⚠️ 免责声明:历史表现不保证未来结果。请先在模拟账户测试。
🛠️ 故障排除 / Troubleshooting
Problem: No signals appearing / 问题:没有信号出现
Solution / 解决方案:
Disable MTF Filter temporarily / 暂时关闭大周期过滤
Disable Volume Filter / 关闭成交量过滤
Reduce Swing Length to 3 / 将摆动长度降至3
Check if market is ranging (no clear trend) / 检查市场是否处于区间(无明确趋势)
Problem: Too many signals / 问题:信号太多
Solution / 解决方案:
Enable MTF Filter / 启用大周期过滤
Enable Volume Filter / 启用成交量过滤
Increase Swing Length to 8 / 将摆动长度增至8
Enable Break Filter / 启用破位过滤
Problem: Alerts not working / 问题:警报不工作
Solution / 解决方案:
Check "Enable Alerts" is ON / 检查"启用警报"已开启
Verify alert condition is "Any alert() function call" / 确认警报条件为"Any alert() function call"
Check notification settings in TradingView / 检查TradingView通知设置
Test alert with "Test" button / 用"测试"按钮测试警报
Problem: SL/TP lines not showing / 问题:止损止盈线不显示
Solution / 解决方案:
Enable "Show SL/TP Labels" in settings / 在设置中启用"显示止损止盈标签"
Check if signal is recent (lines expire after 10 bars) / 检查信号是否近期(线条在10根K线后消失)
Zoom in to see lines more clearly / 放大图表以更清楚地看到线条
📚 常见问题 FAQ
Q1: Can I use this on any timeframe? / 可以在任何时间框架使用吗?
A: Yes, but works best on 5min-4H charts. Recommended: 15min (day trading), 1H (swing trading).
可以,但在5分钟-4小时图表效果最佳。推荐:15分钟(日内交易),1小时(波段交易)。
Q2: Do I need to enable all filters? / 需要启用所有过滤器吗?
A: No. Start with all enabled, then disable based on your risk tolerance. MTF filter is highly recommended.
不需要。从全部启用开始,然后根据风险承受能力禁用。强烈推荐MTF过滤器。
Q3: Can I automate this with IBKR? / 可以与IBKR自动化吗?
A: Yes! Use TradingView alerts + Webhook + Python script + IBKR API. See automation example above.
可以!使用TradingView警报 + Webhook + Python脚本 + IBKR API。参见上方自动化示例。
Q4: What's the difference between Strategy and Indicator version? / 策略版和指标版有什么区别?
A: Strategy = backtesting only. Indicator = real-time alerts + automation. Use both: backtest with strategy, trade with indicator.
策略版=仅回测。指标版=实时警报+自动化。两者结合使用:用策略版回测,用指标版交易。
Q5: Why does H2 appear but no trade? / 为什么出现H2但没有交易?
A: This is an indicator, not a strategy. You need to manually place orders or use automation via alerts.
这是指标,不是策略。你需要手动下单或通过警报使用自动化。
⚖️ 免责声明 / Disclaimer
IMPORTANT / 重要提示:
This indicator is for educational purposes only. Trading involves substantial risk of loss. Past performance does not guarantee future results. Always:
本指标仅供教育目的。交易涉及重大亏损风险。历史表现不保证未来结果。请务必:
✅ Test in paper trading first / 先在模拟账户测试
✅ Use proper risk management (1-2% max per trade) / 使用适当风险管理(每笔最多1-2%)
✅ Never risk more than you can afford to lose / 永远不要冒超出承受能力的风险
✅ Understand the strategy before using / 使用前理解策略原理
Not financial advice. Trade at your own risk.
非投资建议。交易风险自负。
BE-Synergistic RSI Fusion Strategy█ Overview of the Script:
The Synergistic RSI Fusion Strategy is a sophisticated technical analysis tool designed to detect market turning points (reversals) and high-momentum breakouts. Unlike standard indicators that simply tell you to "Buy" or "Sell" based on a crossed line or overbought/oversold levels, this script builds a structural trade setup using zones. It waits for price action to confirm the signal before acting.
█ Why "Synergistic RSI Fusion"?:
The core engine of the indicator makes it all:
Fusion : Standard RSI only looks at the closing price relative to the previous closing price. This script calculates a comprehensive RSI that incorporates the candle's Highs and Lows.
Why is this more powerful? Imagine a "Hammer" candle where price drops significantly during the session but recovers to close near the open. A standard RSI sees almost no change because the Close is near the Open. However, Fusion RSI captures the full volatility of that dip and recovery, recognizing the massive "effort" and hidden battle between buyers and sellers that standard RSI completely misses.
Synergy : It combines this advanced momentum reading with ATR (Average True Range) to define volatility-based entry and exit zones. It blends momentum (RSI) with market structure (Price Action Zones).
█ How it Stands Unique:
The Core engine: Capturing the true efforts of the movement in price.
Multi-Peak Divergence: Instead of simple A-to-B divergence, this script uses a state machine to track local peaks by filtering out weak signals and waits for a significant disagreement between price and momentum.
The Zone System: It doesn't plot signals blindly. When divergence is found, it draws two "waiting rooms" (Green and Red zones). The trade is only taken if the candle closes inside one of these zones.
█ Divergence Trades: The Two-Way Setup:
A unique feature of this script is that when a Divergence signal appears, it generates two potential entry zones: a Bullish zone and a Bearish zone.
The Rational Behind the Two-Way Approach:
New traders often assume a Divergence means "Reversal." However, experienced traders know that Divergence simply means "Tension is building."
Scenario A (The Reversal): The RSI is screaming that momentum is dying, but price is pushing higher. If price respects the divergence, it will drop into the reversal zone. This is the standard divergence trade.
Scenario B (The Failure/Trap): sometimes, momentum is so strong that it blows through the divergence. If price ignores the RSI warning and breaks into the continuation zone, it signals that the trend is incredibly powerful.
Why Trade Both Ways?
By placing zones on both sides, the script essentially says: " I know a big move is coming because of the tension (Divergence), but I will let the market prove direction first. " This prevents you from " catching a falling knife " by trying to pick the exact top or bottom.
The Counter-Trading Logic (The Trap):
The script includes advanced logic for failed trades. If you enter a trade and the Stop Loss is hit immediately (a "fake-out"), the script adjusts the opposing zone by considering the liquidity of that particular candle.
Why? If the market traps Long traders and hits their stops, that selling pressure often fuels a massive move downwards. This logic allows the script to flip bias instantly and join the real move.
█ Continuation Trends: Why Price Runs After TP:
You may notice that often, after the Take Profit (TP) is hit, the price continues to run in that direction for a long time.
The "Breakout" Effect:
The Take Profit levels in this script are calculated using ATR (Average True Range). This is a conservative target based on recent average volatility.
Structural Breaks: The entry zones are usually positioned at key structural pivots. When price has enough energy to enter the zone and hit 100% of the ATR target, it effectively confirms a Break of Structure.
Momentum Release: The Divergence phase acts like a coiled spring. When that spring finally snaps (the trade entry), the release of energy is often far greater than just one ATR unit.
Psychology: When the TP is hit, it confirms the analysis was correct. This draws in other traders and algorithms who missed the initial entry, adding fuel to the fire and extending the trend.
█ Major Support & Resistance Zone:
The untested zones are typically the safe haven to place your SLs, which definitely act as Support & Resistance once the price approaches these zones.
enigmaMarkets move, but price remembers.
Long before indicators flash signals or momentum shifts, price reacts to levels that were already there — quiet, patient, and unmoving.
This tool reveals those levels.
Fixed price intervals — the kind institutions respect, algorithms acknowledge, and charts quietly obey — are drawn automatically above and below current price. No predictions. No signals. Just structure.
The levels don’t chase price.
They wait for it.
On their own, they are simple.
Paired with time, context, and comparison, they become something else entirely.
When price reaches a level in alignment with a larger cycle, reactions tend to be cleaner and more decisive.
When related markets arrive at similar prices but disagree in direction, the divergence often tells a deeper story.
And when those moments occur within broader macro conditions, the response is rarely random.
Use these levels to observe reactions, pauses, rejections, and expansions.
Use them to frame risk across sessions, instruments, and regimes.
Use them to see how short-term movement fits inside a much larger narrative.
Nothing here tells you when to trade.
It only reveals where price matters — and when the market is paying attention.
If you know, you know.
Smart Gap Concepts [MarkitTick]💡 This indicator automates the identification and classification of price gaps, commonly known as Fair Value Gaps (FVG) or Imbalances, by integrating market structure and volume analysis. Unlike standard gap detectors that simply highlight empty space on a chart, this script applies algorithmic filters to categorize gaps into three distinct phases of market movement: Breakaway, Runaway, and Exhaustion. This helps traders understand the potential context of a move rather than just seeing a support or resistance zone.
● Originality and Utility
The primary innovation of this tool is its dynamic classification system. It moves beyond visual detection by checking the "why" behind the gap. By referencing Swing Highs and Swing Lows (Market Structure) alongside Volume efficiency, it determines if a gap represents a breakout, a trend continuation, or a climatic end to a move. Additionally, the script features an automated mitigation tracking system that removes gaps from the chart once price has re-tested the midpoint, ensuring the visual workspace remains clean and relevant to current price action.
● Methodology
The script operates on a multi-stage logic engine:
• Gap Detection
It first identifies the core imbalance where the Low of the current bar does not overlap with the High of the bar two periods prior (for bullish gaps), ensuring the intervening candle represents a strong displacement.
• Structural Analysis (Breakaway Gaps)
The script monitors Pivot Highs and Lows. If a gap occurs simultaneously with a close beyond a key structural Pivot, it is classified as a "Breakaway Gap." This signals the potential start of a new trend.
• Volume and Time Analysis (Exhaustion Gaps)
To identify potential reversals, the script looks for "Trend Maturity." If a gap forms after a long duration since the last pivot and is accompanied by a volume spike (defined by the Volume Spike Multiplier), it is labeled as an "Exhaustion Gap."
• Continuation (Runaway Gaps)
If a gap is valid but meets neither the Breakaway nor Exhaustion criteria, it is considered a "Runaway Gap," typically found in the middle of an established trend.
• Dynamic Cleanup
The script tracks the midpoint of every active gap. If price creates a lower low (for bullish gaps) or higher high (for bearish gaps) beyond this midpoint, the gap is considered mitigated and is removed from the screen.
📖 How to Use
Traders can utilize the color-coded classifications to gauge market intent:
Breakaway (Default Blue): Watch these zones for potential trend initiations. These are often high-probability areas for a retest entry after a structure break.
Runaway (Default Orange): These indicate strong momentum. They can be used to trail stop-losses or add to winning positions, as price should ideally not close below these gaps in a healthy trend.
Exhaustion (Default Red): Be cautious when these appear. They suggest the current move is overextended and a reversal or complex pullback may be imminent.
• Exhaustion Gap : A Practical Case Study
• Breakaway Gap: A Practical Case Study
• Runaway Gap : A Practical Case Study
⚙️ Inputs and Settings
Min Gap Size (Points): Filters out insignificant gaps smaller than this threshold.
Structure Lookback: Defines the sensitivity of the Pivot detection (Swing High/Low).
Volume Avg Length & Multiplier: Determines what qualifies as a "Volume Spike" for exhaustion logic.
Trend Maturity: The minimum number of bars required to consider a trend "old" enough for an exhaustion signal.
Visual Settings: Custom colors for each gap type and box extension length.
● Disclaimer
All provided scripts and indicators are strictly for educational exploration and must not be interpreted as financial advice or a recommendation to execute trades. I expressly disclaim all liability for any financial losses or damages that may result, directly or indirectly, from the reliance on or application of these tools. Market participation carries inherent risk where past performance never guarantees future returns, leaving all investment decisions and due diligence solely at your own discretion.
Bens Platypus Dual VWAP_Rolling 7D vs Weekly AnchoredBen’s Platypus Dual VWAP: Rolling 7D vs Weekly Anchored (optional σ bands)
Weekly-anchored VWAP resets on Monday (exchange time). That makes sense for assets tied to a traditional weekly “market open,” but BTC trades 24/7 and often doesn’t respect Monday as a real regime boundary—so the Monday reset can create a mechanical jump that looks like signal but is just arithmetic. If you drive entries/exits off that reset, some algos will get spooked into early entries, fake “stretch” readings, or sudden mean shifts that aren’t actually market behaviour.
This indicator fixes that by plotting:
• Rolling 7D VWAP (thick aqua): a continuous trailing VWAP that does not reset on Mondays, giving you a stable mean for reversion logic.
• Weekly Anchored VWAP (thin purple): kept for context, so you can see the reset effect rather than accidentally trade it.
Result: you can visually compare the two means and quantify when “weekly structure” is useful versus when it’s just a calendar artifact on a 24/7 market.


