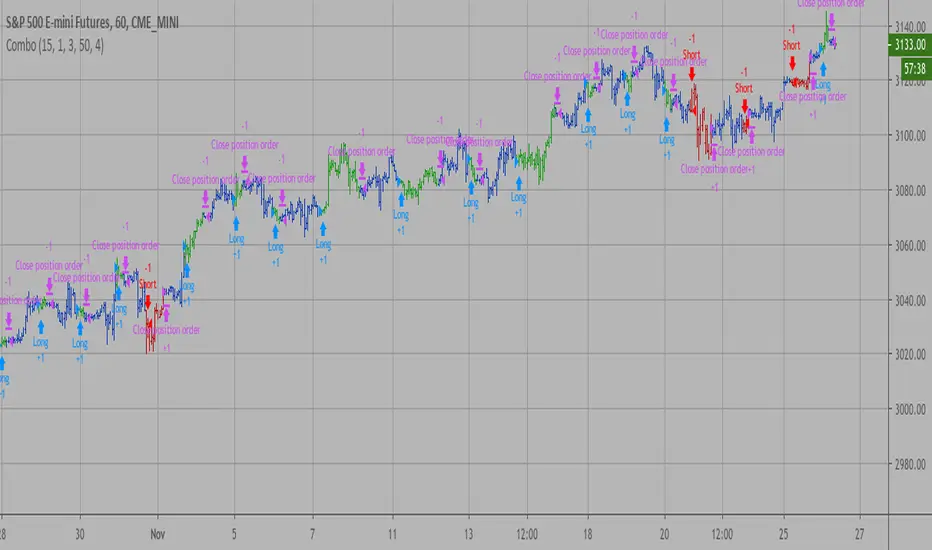
bee ZZBreakdown trading system ( TS ) based on the ZZ indicator ( zig-zag ) using SAR (stop and reverse). The system calculates the long level and short level, depending on the direction of the breakdown - we enter the long or short position. The strategy is always in position (in the market), the strategy being in the long side reverses the position at the short level, and accordingly, on the contrary, it is in short at the long level, thereby fixing profit / loss. The strategy has proved itself to be highly volatile. Strategy tested on BitMEX exchange. It is possible to get acquainted with the results of the strategy by running the script by history.
Wyszukaj w skryptach "algo"

Combo Backtest 123 Reversal & D_ELI (Ehlers Leading Indicator) This is combo strategies for get a cumulative signal.
First strategy
This System was created from the Book "How I Tripled My Money In The
Futures Market" by Ulf Jensen, Page 183. This is reverse type of strategies.
The strategy buys at market, if close price is higher than the previous close
during 2 days and the meaning of 9-days Stochastic Slow Oscillator is lower than 50.
The strategy sells at market, if close price is lower than the previous close price
during 2 days and the meaning of 9-days Stochastic Fast Oscillator is higher than 50.
Second strategy
This Indicator plots a single
Daily DSP (Detrended Synthetic Price) and a Daily ELI (Ehlers Leading
Indicator) using intraday data.
Detrended Synthetic Price is a function that is in phase with the dominant
cycle of real price data. This one is computed by subtracting a 3 pole Butterworth
filter from a 2 Pole Butterworth filter. Ehlers Leading Indicator gives an advanced
indication of a cyclic turning point. It is computed by subtracting the simple
moving average of the detrended synthetic price from the detrended synthetic price.
Buy and Sell signals arise when the ELI indicator crosses over or under the detrended
synthetic price.
See "MESA and Trading Market Cycles" by John Ehlers pages 64 - 70.
WARNING:
- For purpose educate only
- This script to change bars colors.
Simple Price Momentum - How To Create A Simple Trading StrategyThis script was built using a logical approach to trading systems. All the details can be found in a step by step guide below. I hope you enjoy it. I am really glad to be part of this community. Thank you all. I hope you not only succeed on your trading career but also enjoy it.
docs.google.com
Backtesting on Non-Standard Charts: Caution! - PineCoders FAQMuch confusion exists in the TradingView community about backtesting on non-standard charts. This script tries to shed some light on the subject in the hope that traders make better use of those chart types.
Non-standard charts are:
Heikin Ashi (HA)
Renko
Kagi
Point & Figure
Range
These chart types are called non-standard because they all transform market prices into synthetic views of price action. Some focus on price movement and disregard time. Others like HA use the same division of bars into fixed time intervals but calculate artificial open, high, low and close (OHLC) values.
Non-standard chart types can provide traders with alternative ways of interpreting price action, but they are not designed to test strategies or run automated traded systems where results depend on the ability to enter and exit trades at precise price levels at specific times, whether orders are issued manually or algorithmically. Ironically, the same characteristics that make non-standard chart types interesting from an analytical point of view also make them ill-suited to trade execution. Why? Because of the dislocation that a synthetic view of price action creates between its non-standard chart prices and real market prices at any given point in time. Switching from a non-standard chart price point into the market always entails a translation of time/price dimensions that results in uncertainty—and uncertainty concerning the level or the time at which orders are executed is detrimental to all strategies.
The delta between the chart’s price when an order is issued (which is assumed to be the expected price) and the price at which that order is filled is called slippage . When working from normal chart types, slippage can be caused by one or more of the following conditions:
• Time delay between order submission and execution. During this delay the market may move normally or be subject to large orders from other traders that will cause large moves of the bid/ask levels.
• Lack of bids for a market sell or lack of asks for a market buy at the current price level.
• Spread taken by middlemen in the order execution process.
• Any other event that changes the expected fill price.
When a market order is submitted, matching engines attempt to fill at the best possible price at the exchange. TradingView strategies usually fill market orders at the opening price of the next candle. A non-standard chart type can produce misleading results because the open of the next candle may or may not correspond to the real market price at that time. This creates artificial and often beneficial slippage that would not exist on standard charts.
Consider an HA chart. The open for each candle is the average of the previous HA bar’s open and close prices. The open of the HA candle is a synthetic value, but the real market open at the time the new HA candle begins on the chart is the unrelated, regular open at the chart interval. The HA open will often be lower on long entries and higher on short entries, resulting in unrealistically advantageous fills.
Another example is a Renko chart. A Renko chart is a type of chart that only measures price movement. The purpose of a Renko chart is to cluster price action into regular intervals, which consequently removes the time element. Because Trading View does not provide tick data as a price source, it relies on chart interval close values to construct Renko bricks. As a consequence, a new brick is constructed only when the interval close penetrates one or more brick thresholds. When a new brick starts on the chart, it is because the previous interval’s close was above or below the next brick threshold. The open price of the next brick will likely not represent the current price at the time this new brick begins, so correctly simulating an order is impossible.
Some traders have argued with us that backtesting and trading off HA charts and other non-standard charts is useful, and so we have written this script to show traders what happens when order fills from backtesting on non-standard charts are compared to real-world fills at market prices.
Let’s review how TV backtesting works. TV backtesting uses a broker emulator to execute orders. When an order is executed by the broker emulator on historical bars, the price used for the fill is either the close of the order’s submission bar or, more often, the open of the next. The broker emulator only has access to the chart’s prices, and so it uses those prices to fill orders. When backtesting is run on a non-standard chart type, orders are filled at non-standard prices, and so backtesting results are non-standard—i.e., as unrealistic as the prices appearing on non-standard charts. This is not a bug; where else is the broker emulator going to fetch prices than from the chart?
This script is a strategy that you can run on either standard or non-standard chart types. It is meant to help traders understand the differences between backtests run on both types of charts. For every backtest, a label at the end of the chart shows two global net profit results for the strategy:
• The net profits (in currency) calculated by TV backtesting with orders filled at the chart’s prices.
• The net profits (in currency) calculated from the same orders, but filled at market prices (fetched through security() calls from the underlying real market prices) instead of the chart’s prices.
If you run the script on a non-standard chart, the top result in the label will be the result you would normally get from the TV backtesting results window. The bottom result will show you a more realistic result because it is calculated from real market fills.
If you run the script on a normal chart type (bars, candles, hollow candles, line, area or baseline) you will see the same result for both net profit numbers since both are run on the same real market prices. You will sometimes see slight discrepancies due to occasional differences between chart prices and the corresponding information fetched through security() calls.
Features
• Results shown in the Data Window (third icon from the top right of your chart) are:
— Cumulative results
— For each order execution bar on the chart, the chart and market previous and current fills, and the trade results calculated from both chart and market fills.
• You can choose between 2 different strategies, both elementary.
• You can use HA prices for the calculations determining entry/exit conditions. You can use this to see how a strategy calculated from HA values can run on a normal chart. You will notice that such strategies will not produce the same results as the real market results generated from HA charts. This is due to the different environment backtesting is running on where for example, position sizes for entries on the same bar will be calculated differently because HA and standard chart close prices differ.
• You can choose repainting/non-repainting signals.
• You can show MAs, entry/exit markers and market fill levels.
• You can show candles built from the underlying market prices.
• You can color the background for occurrences where an order is filled at a different real market price than the chart’s price.
Notes
• On some non-standard chart types you will not obtain any results. This is sometimes due to how certain types of non-standard types work, and sometimes because the script will not emit orders if no underlying market information is detected.
• The script illustrates how those who want to use HA values to calculate conditions can do so from a standard chart. They will then be getting orders emitted on HA conditions but filled at more realistic prices because their strategy can run on a standard chart.
• On some non-standard chart types you will see market results surpass chart results. While this may seem interesting, our way of looking at it is that it points to how unreliable non-standard chart backtesting is, and why it should be avoided.
• In order not to extend an already long description, we do not discuss the particulars of executing orders on the realtime bar when using non-standard charts. Unless you understand the minute details of what’s going on in the realtime bar on a particular non-standard chart type, we recommend staying away from this.
• Some traders ask us: Why does TradingView allow backtesting on non-standard chart types if it produces unrealistic results? That’s somewhat like asking a hammer manufacturer why it makes hammers if hammers can hurt you. We believe it’s a trader’s responsibility to understand the tools he is using.
Takeaways
• Non-standard charts are not bad per se, but they can be badly used.
• TV backtesting on non-standard charts is not broken and doesn’t require fixing. Traders asking for a fix are in dire need of learning more about trading. We recommend they stop trading until they understand why.
• Stay away from—even better, report—any vendor presenting you with strategies running on non-standard charts and implying they are showing reliable results.
• If you don’t understand everything we discussed, don’t use non-standard charts at all.
• Study carefully how non-standard charts are built and the inevitable compromises used in calculating them so you can understand their limitations.
Thanks to @allanster and @mortdiggiddy for their help in editing this description.
Look first. Then leap.

Combo Backtest 123 Reversal & Comparative Relative Strength This is combo strategies for get a cumulative signal.
First strategy
This System was created from the Book "How I Tripled My Money In The
Futures Market" by Ulf Jensen, Page 183. This is reverse type of strategies.
The strategy buys at market, if close price is higher than the previous close
during 2 days and the meaning of 9-days Stochastic Slow Oscillator is lower than 50.
The strategy sells at market, if close price is lower than the previous close price
during 2 days and the meaning of 9-days Stochastic Fast Oscillator is higher than 50.
Second strategy
Comparative Relative Strength Strategy for ES
WARNING:
- For purpose educate only
- This script to change bars colors.

Total Trend Follow Strategy with Pyramid and DCA
Introduction
This is a Pine 4 trend following strategy. It has a twin study with several alerts. The design intent is to produce a commercial grade signal generator that can be adapted to any symbol and interval. Ideally, the script is reliable enough to be the basis of an automated trading system web-hooked to a server with API access to crypto, forex and stock brokerages. The strategy can be run in three different modes: long, short and bidirectional.
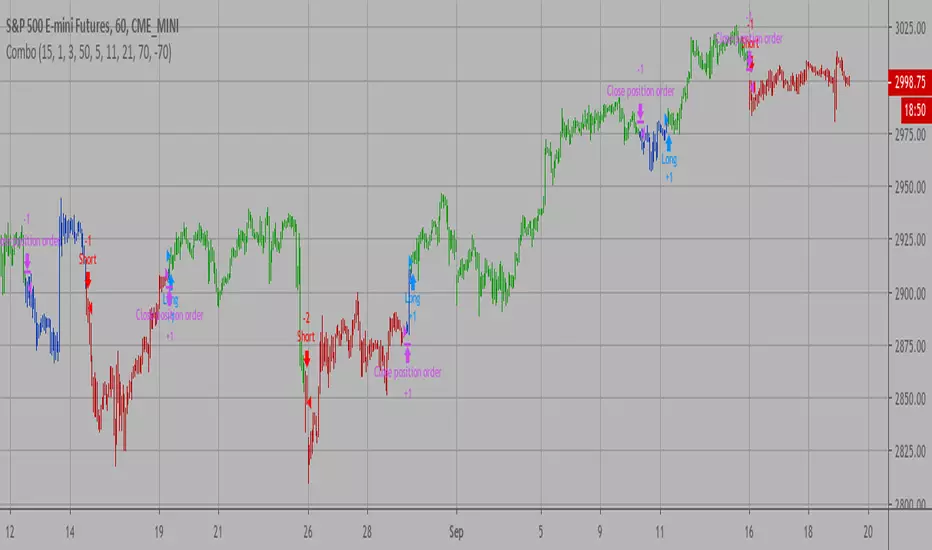
As a trend following strategy, the behavior of the script is to buy on strength and sell on weakness. As such the trade orders maintain its directional bias according to price pressure. What you will see on the chart is long positions on the left side of the mountain and short on the right. Long and short positions are not intermingled as long as there exists a detectable trend. This is extremely beneficial feature in long running bull or bear markets. The script uses multiple setups to avoid the situation where you got in on the trend, took a small profit but couldn’t get back in because the logic is waiting for a pullback or some other intricate condition.
Deep draw-downs are a characteristic of trend following systems and this system is no different. However, this script makes use of the TradingView pyramid feature accessible from the properties tab. Additional trades can be placed in the draw-down space increasing the position size and thereby increasing the profit or loss when the position finally closes. Each individual add on trade increases its order size as a multiple of its pyramid level. This makes it easy to comply with NFA FIFO Rule 2-43(b) if the trades are executed here in America. The inputs dialog box contains various settings to adjust where the add on trades show up, under what circumstances and how frequent if at all. Please be advised that pyramiding is an advanced feature and can wipe out your account capital if your not careful. During the backtest use modest setting with realistic capital until you discover what you think you can handle.
In addition to pyramiding this script employs DCA which enables users to experiment with loss recovery techniques. This is another advanced feature which can increase the order size on new trades in response to stopped out or winning streak trades. The script keeps track of debt incurred from losing trades. When the debt is recovered the order size returns to the base amount specified in the TV properties tab. The inputs for this feature include a limiter to prevent your account from depleting capital during runaway markets. The main difference between DCA and pyramids is that this implementation of DCA applies to new trades while pyramids affect open positions. DCA is a popular feature in crypto trading but can leave you with large “bags” if your not careful. In other markets, especially margin trading, you’ll need a well funded account and much experience.
Consecutive loss limit can be set to report a breach of the threshold value. Every stop hit beyond this limit will be reported on a version 4 label above the bar where the stop is hit. Use the location of the labels along with the summary report tally to improve the adaptability of system. Don’t simply fit the chart. A good trading system should adapt to ever changing market conditions. On the study version the consecutive loss limit can be used to halt live trading on the broker side (Managed manually).
Design
This script uses nine indicators on two time frames. The chart (primary) interval and one higher time frame which is based on the primary. The higher time frame identifies the trend for which the primary will trade. I’ve tried to keep the higher time frame around five times greater than the primary. The original trading algorithms are a port from a much larger program on another trading platform. I’ve converted some of the statistical functions to use standard indicators available on TradingView. The setups make heavy use of the Hull Moving Average in conjunction with EMAs that form the Bill Williams Alligator as described in his book “New Trading Dimensions” Chapter 3. Lag between the Hull and the EMAs form the basis of the entry and exit points. The alligator itself is used to identify the trend main body.
The entire script is around 1700 lines of Pine code which is the maximum incidental size given the TradingView limits: local scopes, run-time duration and compile time. I’ve been working on this script for over a year and have tested it on various instruments stocks, forex and crypto. It performs well on higher liquidity markets that have at least a year of historical data. Though it can be configured to work on any interval between 5 minutes and 1 day, trend trading is generally a longer term paradigm. For day trading the 10 to 15 minute interval will allow you to catch momentum breakouts. For intraweek trades 30 minutes to 1 hour should give you a trade every other a day. Four hours and above are for seasoned deep pocket traders. Originally, this script contained both range trading and trend following logic but had to be broken into separate scripts due to the aforementioned limitations.
Inputs to the script use cone centric measurements in effort to avoid exposing adjustments to the various internal indicators. The goal was to keep the inputs relevant to the actual trade entry and exit locations as opposed to a series of MA input values and the like. As a result the strategy exposes over 50 inputs grouped into long or short sections. Inputs are available for the usual minimum profit and stop-loss as well as safeguards, trade frequency, DCA, modes, presets, reports and lots of calibrations. The inputs are numerous, I’m aware. Unfortunately, at this time, TradingView does not offer any other method to get data in the script. The usual initialization files such as cnf, cfg, ini, json and xml files are currently unsupported.
Example configurations for various instruments along with a detailed PDF user manual is available.
Indicator Repainting And Anomalies
Indicator repainting is an industry wide problem which mainly occurs when you mix backtest data with real-time data. It doesn't matter which platform you use some form of this condition will manifest itself on your chart over time. The critical aspect being whether live trades on your broker’s account continue to match your TradingView study. Since this trading system is featured as two separate scripts, indicator repainting is addressed in the study version. The strategy (this script) is intended to be used on historical data to determine the appropriate trading inputs to apply in the study. As such, the higher time frame of this strategy will indeed repaint. Please do not attempt to trade from the strategy. Please see the study version for more information.
One issue that comes up when comparing the strategy with the study is that the strategy trades show on the chart one bar later than the study. This problem is due to the fact that “strategy.entry()” and “strategy_exit()” do not execute on the same bar called. The study, on the other hand, has no such limitation since there are no position routines. However, alerts that are subsequently fired off when triggered in the study are dispatched from the TradingView servers one bar later from the study plot. Therefore the alert you actually receive on your cell phone matches the strategy plot but is one bar later than the study plot. A lot can happen in four hours if you are trading off a 240 bar.
Please be aware that the data source matters. Cryptocurrency has no central tick repository so each exchange supplies TradingView its feed. Even though it is the same symbol the quality of the data and subsequently the bars that are supplied to the chart varies with the exchange. This script will absolutely produce different results on different data feeds of the same symbol. Be sure to backtest this script on the same data you intend to receive alerts for. Any example settings I share with you will always have the exchange name used to generate the test results.
Usage
The following steps provide a very brief set of instructions that will get you started but will most certainly not produce the best backtest. A trading system that you are willing to risk your hard earned capital will require a well crafted configuration that involves time, expertise and clearly defined goals. As previously mentioned, I have several example configs that I use for my own trading that I can share with you along with a PDF which describes each input in detail. To get hands on experience in setting up your own symbol from scratch please follow the steps below.
The input dialog box contains over 50 inputs separated into seven sections. Each section is identified as such with a makeshift separator input. There are three main areas that must to be configured: long side, short side and settings that apply to both. The rest of the inputs apply to pyramids, DCA, reporting and calibrations. The following steps address these three main areas only. You will need to get your backtest in the black before moving on to the more advanced features
Step 1. Setup the Base currency and order size in the properties tab.
Step 2. Select the calculation presets in the Instrument Type field.
Step 3. Select “No Trade” in the Trading Mode field.
Step 4. Select the Histogram indicator from section 3. You will be experimenting with different ones so it doesn’t matter which one you try first.
Step 5. Turn on Show Markers in Section 3.
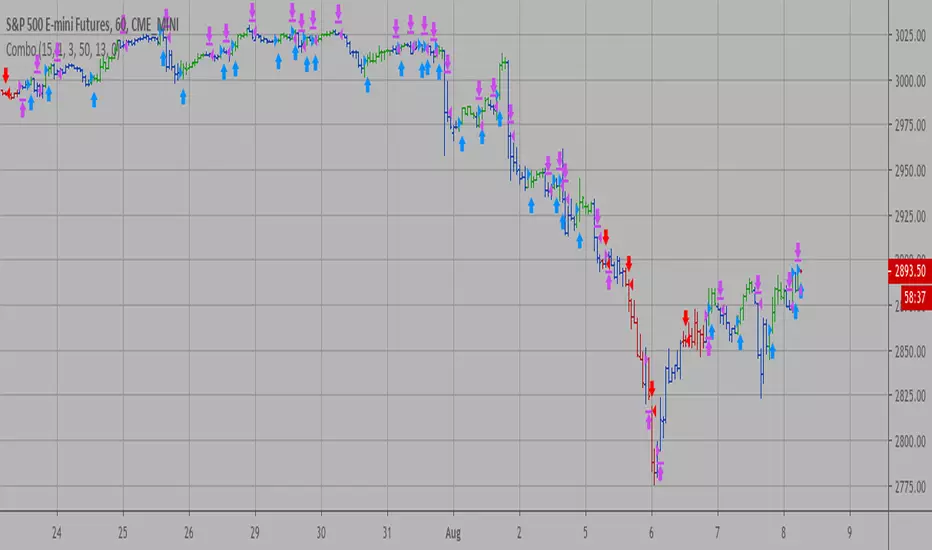
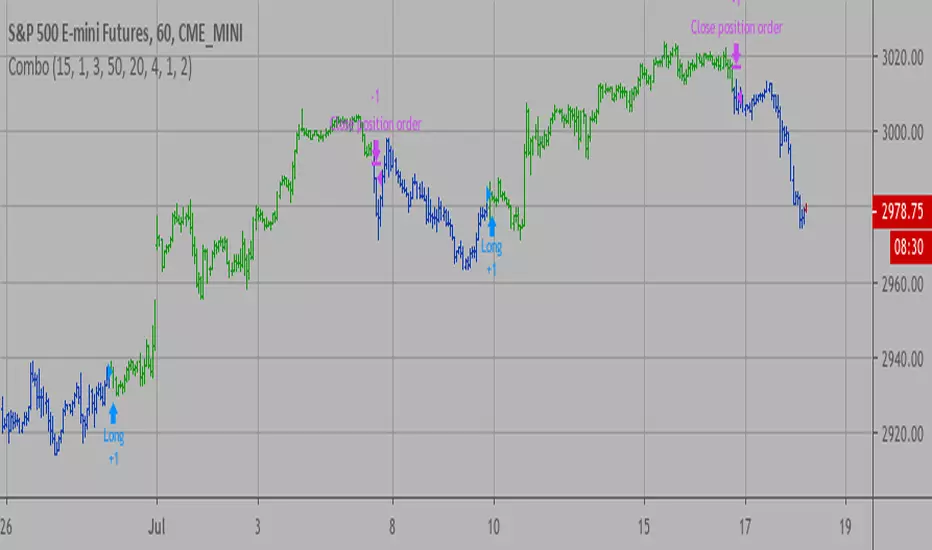
Step 6. Go to the chart and checkout where the markers show up. Blue is up and red is down. Long trades show up along the blue markers and short trades on the red.
Step 7. Make adjustments to Base To Vertex and Vertex To Base net change and roc in section 3. Use these fields to move the markers to where you want trades to be. Blue is long and red is short.
Step 8. Try a different indicator from section 3 and repeat Step 7 until you find the best match for this instrument on this interval. This step is complete when the Vertex settings and indicator combination produce the most favorable results.
Step 9. Turn off Show Markers in Section 3.
Step 10. Enable the Symmetrical and Deviation calculation models at the top of section 5 and 6 (Symmetrical, Deviation).
Step 11. Put in your Minimum Profit and Stop Loss in the first section. This is in pips or currency basis points (chart right side scale)
Step 12. Return to step 3 and select a Trading Mode (Long, Short, BiDir, Flip Flop). If you are planning to trade bidirectionally its best to configure long first then short. Combine them with BiDir or Flip Flop after setting up both sides of the trade individually.
Step 13. Trades should be showing on the chart.
Step 14. Make adjustments to the Vertex fields in section 3 until the TradingView performance report is showing a profit.
Step 15. Change indicators and repeat step 14. Pick the best indicator.
Step 16. Use the check boxes in sections 5 and 6 to improve the performance of each side.
Step 17. Try adding the Correlation calculation model to either side. This model can sometimes produce a negative result but can be improved by enabling “Adhere To Markers” or “Narrow Correlation Scope” in the sections 5 and 6.
Step 18. Enable the reporting conditions in section 7. Look for long runs of consecutive losses or high debt sequences. These are indications that your trading system cannot withstand sudden changes in market sentiment.
Step 19. Examine the chart and see that trades are being placed in accordance with your desired trading model.
Step 20. Apply the backtest settings to the study version and perform forward testing.
This script is open for beta testing. After successful beta test it will become a commercial application available by subscription only. I’ve invested quite a lot of time and effort into making this the best possible signal generator for all of the instruments I intend to trade. I certainly welcome any suggestions for improvements. Thank you all in advance.
Combo Backtest 123 Reversal & EMA & Volume WeightingThis is combo strategies for get a cumulative signal.
First strategy
This System was created from the Book "How I Tripled My Money In The
Futures Market" by Ulf Jensen, Page 183. This is reverse type of strategies.
The strategy buys at market, if close price is higher than the previous close
during 2 days and the meaning of 9-days Stochastic Slow Oscillator is lower than 50.
The strategy sells at market, if close price is lower than the previous close price
during 2 days and the meaning of 9-days Stochastic Fast Oscillator is higher than 50.
Second strategy
The related article is copyrighted material from Stocks & Commodities 2009 Oct
WARNING:
- For purpose educate only
- This script to change bars colors.

Combo Backtest 123 Reversal & DMI & Moving Average This is combo strategies for get a cumulative signal.
First strategy
This System was created from the Book "How I Tripled My Money In The
Futures Market" by Ulf Jensen, Page 183. This is reverse type of strategies.
The strategy buys at market, if close price is higher than the previous close
during 2 days and the meaning of 9-days Stochastic Slow Oscillator is lower than 50.
The strategy sells at market, if close price is lower than the previous close price
during 2 days and the meaning of 9-days Stochastic Fast Oscillator is higher than 50.
Second strategy
The related article is copyrighted material from Stocks & Commodities Aug 2009
WARNING:
- For purpose educate only
- This script to change bars colors.
Kase Dev Stops Backtest The Kase Dev Stops system finds the optimal statistical balance between letting profits run,
while cutting losses. Kase DevStop seeks an ideal stop level by accounting for volatility (risk),
the variance in volatility (the change in volatility from bar to bar), and volatility skew
(the propensity for volatility to occasionally spike incorrectly).
Kase Dev Stops are set at points at which there is an increasing probability of reversal against
the trend being statistically significant based on the log normal shape of the range curve.
Setting stops will help you take as much risk as necessary to stay in a good position, but not more.
WARNING:
- For purpose educate only
- This script to change bars colors.

Combo Backtest 123 Reversal & CMOfilt This is combo strategies for get a cumulative signal.
First strategy
This System was created from the Book "How I Tripled My Money In The
Futures Market" by Ulf Jensen, Page 183. This is reverse type of strategies.
The strategy buys at market, if close price is higher than the previous close
during 2 days and the meaning of 9-days Stochastic Slow Oscillator is lower than 50.
The strategy sells at market, if close price is lower than the previous close price
during 2 days and the meaning of 9-days Stochastic Fast Oscillator is higher than 50.
Second strategy
This indicator plots a CMO which ignores price changes which are less
than a threshold value. CMO was developed by Tushar Chande. A scientist,
an inventor, and a respected trading system developer, Mr. Chande developed
the CMO to capture what he calls "pure momentum". For more definitive
information on the CMO and other indicators we recommend the book The New
Technical Trader by Tushar Chande and Stanley Kroll.
The CMO is closely related to, yet unique from, other momentum oriented
indicators such as Relative Strength Index, Stochastic, Rate-of-Change, etc.
It is most closely related to Welles Wilder`s RSI, yet it differs in several ways:
- It uses data for both up days and down days in the numerator, thereby directly
measuring momentum;
- The calculations are applied on unsmoothed data. Therefore, short-term extreme
movements in price are not hidden. Once calculated, smoothing can be applied to the
CMO, if desired;
- The scale is bounded between +100 and -100, thereby allowing you to clearly see
changes in net momentum using the 0 level. The bounded scale also allows you to
conveniently compare values across different securities.
WARNING:
- For purpose educate only
- This script to change bars colors.

Combo Backtest 123 Reversal & CMOav This is combo strategies for get a cumulative signal.
First strategy
This System was created from the Book "How I Tripled My Money In The
Futures Market" by Ulf Jensen, Page 183. This is reverse type of strategies.
The strategy buys at market, if close price is higher than the previous close
during 2 days and the meaning of 9-days Stochastic Slow Oscillator is lower than 50.
The strategy sells at market, if close price is lower than the previous close price
during 2 days and the meaning of 9-days Stochastic Fast Oscillator is higher than 50.
Second strategy
This indicator plots average of three different length CMO's. This indicator
was developed by Tushar Chande. A scientist, an inventor, and a respected
trading system developer, Mr. Chande developed the CMO to capture what he
calls "pure momentum". For more definitive information on the CMO and other
indicators we recommend the book The New Technical Trader by Tushar Chande
and Stanley Kroll.
The CMO is closely related to, yet unique from, other momentum oriented
indicators such as Relative Strength Index, Stochastic, Rate-of-Change, etc.
It is most closely related to Welles Wilder?s RSI, yet it differs in several ways:
- It uses data for both up days and down days in the numerator, thereby directly
measuring momentum;
- The calculations are applied on unsmoothed data. Therefore, short-term extreme
movements in price are not hidden. Once calculated, smoothing can be applied to
the CMO, if desired;
- The scale is bounded between +100 and -100, thereby allowing you to clearly see
changes in net momentum using the 0 level. The bounded scale also allows you to
conveniently compare values across different securities.
WARNING:
- For purpose educate only
- This script to change bars colors.
Combo Backtest 123 Reversal & CMOabsThis is combo strategies for get a cumulative signal.
First strategy
This System was created from the Book "How I Tripled My Money In The
Futures Market" by Ulf Jensen, Page 183. This is reverse type of strategies.
The strategy buys at market, if close price is higher than the previous close
during 2 days and the meaning of 9-days Stochastic Slow Oscillator is lower than 50.
The strategy sells at market, if close price is lower than the previous close price
during 2 days and the meaning of 9-days Stochastic Fast Oscillator is higher than 50.
Second strategy
This indicator plots the absolute value of CMO. CMO was developed by Tushar
Chande. A scientist, an inventor, and a respected trading system developer,
Mr. Chande developed the CMO to capture what he calls "pure momentum". For
more definitive information on the CMO and other indicators we recommend the
book The New Technical Trader by Tushar Chande and Stanley Kroll.
The CMO is closely related to, yet unique from, other momentum oriented indicators
such as Relative Strength Index, Stochastic, Rate-of-Change, etc. It is most closely
related to Welles Wilder`s RSI, yet it differs in several ways:
- It uses data for both up days and down days in the numerator, thereby directly
measuring momentum;
- The calculations are applied on unsmoothed data. Therefore, short-term extreme
movements in price are not hidden. Once calculated, smoothing can be applied to
the CMO, if desired;
- The scale is bounded between +100 and -100, thereby allowing you to clearly see
changes in net momentum using the 0 level. The bounded scale also allows you to
conveniently compare values across different securities.
WARNING:
- For purpose educate only
- This script to change bars colors.

DAKELAX-XRPUSDT Bollinger Band Strategy for TradebotlerDAKELAX-XRPUSDT is a Tradebotler strategy designed to run on XRPUSDT for binance, it's a simple reverse to mean strategy and when backtested on may-aug 2019 on H1 timeframe it performs pretty well in backtest as well as running live.
In order to get started install the Tradebotler extension and connect the strategy with Binance or other crypto exchanges of your choice such as Kraken, Bitstamp, Bitmex, Bittrex, Polyneux etc, etc.

Combo Backtest 123 Reversal & CMO & WMA This is combo strategies for get a cumulative signal.
First strategy
This System was created from the Book "How I Tripled My Money In The
Futures Market" by Ulf Jensen, Page 183. This is reverse type of strategies.
The strategy buys at market, if close price is higher than the previous close
during 2 days and the meaning of 9-days Stochastic Slow Oscillator is lower than 50.
The strategy sells at market, if close price is lower than the previous close price
during 2 days and the meaning of 9-days Stochastic Fast Oscillator is higher than 50.
Second strategy
This indicator plots Chande Momentum Oscillator and its WMA on the
same chart. This indicator plots the absolute value of CMO.
The CMO is closely related to, yet unique from, other momentum oriented
indicators such as Relative Strength Index, Stochastic, Rate-of-Change,
etc. It is most closely related to Welles Wilder?s RSI, yet it differs
in several ways:
- It uses data for both up days and down days in the numerator, thereby
directly measuring momentum;
- The calculations are applied on unsmoothed data. Therefore, short-term
extreme movements in price are not hidden. Once calculated, smoothing
can be applied to the CMO, if desired;
- The scale is bounded between +100 and -100, thereby allowing you to clearly
see changes in net momentum using the 0 level. The bounded scale also allows
you to conveniently compare values across different securities.
WARNING:
- For purpose educate only
- This script to change bars colors.

JackTrendChaser V3Hi everyone! I am so thrilled to announce this!
>> LIMITED TIME OFFER, read below! <<
My name is Jack and I have been trading trends using TA on Forex for 10 years now and have within the past two years been trading Bitcoin and other cryptocurrencies.
I am a part time trader and developer. On a daily basis I work as a software developer creating various algorythms for big data usage - such as machine learning etc. and I have found a passion in creating scripts to predict major trend moves. Which is why I would like to share this script (strategy) with you all!
Looking at the stats it looks amazing! 100% profitability - who doesn't want that?! But that doesn't mean it cannot be improved - I am daily looking into how I can improve this to become even more profitable.
Currently the script have been tested with BTC and ETH:
BTC = 100% profitability and 9 trades since 2016
ETH = 83% profitability and 6 trades since 2016 with a drawdown of $5.
Now - 9 and 6 trades since 2016 isn't many trades but it suites my way of trading perfectly! I aim for the major trends and try to hit the pullbacks as soon as possible.
You can use this script alone or with other complimenting indicators. I like to draw some support and resistance levels for even further verification.
TRIAL OFFER:
Everyone is offered a 15 days trail.
Let me know in the comments if you would like a trail. Please do not PM me for trails.
>> LIMITED TIME OFFER <<
Since this is my first script to publish on TradingView I am offering the FIRST 10 traders a LIFETIME access to the script for a very small price! After that everyone else will be able to buy acces for 1m, 6m, 1y or lifetime (but at a higher price).
So how do you become one of the first 10?! Simpel - just PM me for the details.
I will update this post when the first 10 has been chosen.
>> OBS: I might be away from TradingView up to 24hours at a time because of my job - but don't panic! I will keep track of every message and get back to everyone as soon as possible!
Best regards
Jack

Kairos [Backtester]Kairos bot looks for the opportune time to buy low and sell high at targets
It provides signals to open and close trades, and indicates favorable positions for a stop loss and profit taking
The Kairos bot can be used on any chart and on any time frame
---BACKTESTER---
Using the backtester script the user can look at a chart's history between selected dates to find optimal bot settings and optimal time frames
The backtester is based on general percentages for profit taking as indicated below:
-------------T1 T2 T3 T4 T5 T6 CLOSE
1 Target: 50% 50%
2 Targets: 50% 25% 25%
3 Targets: 40% 30% 20% 10%
4 Targets: 40% 25% 20% 10% 5%
5 Targets: 35% 25% 20% 10% 5% 5%
6 Targets: 30% 25% 20% 10% 5% 5% 5%
ie: If 2 targets are selected:
- 50% of investment will be taken at target 1
- 25% of investment will be taken at target 2
- and the remainder 25% will be taken when the trade is closed on a close signal
However, it is up to the user's own risk appetite to determine where and how much profit to take
Note that the backtester does not have any on screen indicators other than OPEN and CLOSE, however profit taking can be indicated by ticking the Style -> Trades on Chart tick box on the settings userform
---SIGNALS---
The signals script can be used for automation and can indicate up to 6 potential Profit Targets, as well as a Stop Loss based on how many bars back needs to be taken into consideration
The signals (Open/Close) can be automated using TradingView alerts, however the Stop Loss and Profit Taking are only indicators and are for the users own interpretation
The user does not have to place a Stop Loss or take profit at the Targets if so wished, the bot can be used to simply buy on an OPEN signal and sell on a CLOSE signal, however, the backtester will indicate that it is far more profitable to take profits.
It is advised to take profits just below indicated Targets as these are potentially high selling zones and price action can sometimes turn down just short of these targets.
---INVITE-ONLY SCRIPT---
This is an invite-only script, so if you would like to try out Kairos Bot, send me a message

Combo Backtest 123 Reversal & Chande Forecast Oscillator This is combo strategies for get a cumulative signal.
First strategy
This System was created from the Book "How I Tripled My Money In The
Futures Market" by Ulf Jensen, Page 183. This is reverse type of strategies.
The strategy buys at market, if close price is higher than the previous close
during 2 days and the meaning of 9-days Stochastic Slow Oscillator is lower than 50.
The strategy sells at market, if close price is lower than the previous close price
during 2 days and the meaning of 9-days Stochastic Fast Oscillator is higher than 50.
Second strategy
The Chande Forecast Oscillator developed by Tushar Chande The Forecast
Oscillator plots the percentage difference between the closing price and
the n-period linear regression forecasted price. The oscillator is above
zero when the forecast price is greater than the closing price and less
than zero if it is below.
WARNING:
- For purpose educate only
- This script to change bars colors.
Combo Backtest 123 Reversal & Chaikin Volatility This is combo strategies for get a cumulative signal.
First strategy
This System was created from the Book "How I Tripled My Money In The
Futures Market" by Ulf Jensen, Page 183. This is reverse type of strategies.
The strategy buys at market, if close price is higher than the previous close
during 2 days and the meaning of 9-days Stochastic Slow Oscillator is lower than 50.
The strategy sells at market, if close price is lower than the previous close price
during 2 days and the meaning of 9-days Stochastic Fast Oscillator is higher than 50.
Second strategy
Chaikin's Volatility indicator compares the spread between a security's
high and low prices. It quantifies volatility as a widening of the range
between the high and the low price.
You can use in the xPrice1 and xPrice2 any series: Open, High, Low, Close, HL2,
HLC3, OHLC4 and ect...
WARNING:
- For purpose educate only
- This script to change bars colors.

Combo Backtest 123 Reversal & Center Of Gravity This is combo strategies for get a cumulative signal.
First strategy
This System was created from the Book "How I Tripled My Money In The
Futures Market" by Ulf Jensen, Page 183. This is reverse type of strategies.
The strategy buys at market, if close price is higher than the previous close
during 2 days and the meaning of 9-days Stochastic Slow Oscillator is lower than 50.
The strategy sells at market, if close price is lower than the previous close price
during 2 days and the meaning of 9-days Stochastic Fast Oscillator is higher than 50.
Second strategy
The indicator is based on moving averages. On the basis of these, the
"center" of the price is calculated, and price channels are also constructed,
which act as corridors for the asset quotations.
WARNING:
- For purpose educate only
- This script to change bars colors.
Combo Strategy 123 Reversal & CCI This is combo strategies for get a cumulative signal.
First strategy
This System was created from the Book "How I Tripled My Money In The
Futures Market" by Ulf Jensen, Page 183. This is reverse type of strategies.
The strategy buys at market, if close price is higher than the previous close
during 2 days and the meaning of 9-days Stochastic Slow Oscillator is lower than 50.
The strategy sells at market, if close price is lower than the previous close price
during 2 days and the meaning of 9-days Stochastic Fast Oscillator is higher than 50.
Second strategy
The Commodity Channel Index (CCI) is best used with markets that display cyclical or
seasonal characteristics, and is formulated to detect the beginning and ending of these
cycles by incorporating a moving average together with a divisor that reflects both possible
and actual trading ranges. The final index measures the deviation from normal, which indicates
major changes in market trend.
To put it simply, the Commodity Channel Index (CCI) value shows how the instrument is trading
relative to its mean (average) price. When the CCI value is high, it means that the prices are
high compared to the average price; when the CCI value is down, it means that the prices are low
compared to the average price. The CCI value usually does not fall outside the -300 to 300 range
and, in fact, is usually in the -100 to 100 range.
WARNING:
- For purpose educate only
- This script to change bars colors.

Combo Backtest 123 Reversal & Bull Power This is combo strategies for get a cumulative signal.
First strategy
This System was created from the Book "How I Tripled My Money In The
Futures Market" by Ulf Jensen, Page 183. This is reverse type of strategies.
The strategy buys at market, if close price is higher than the previous close
during 2 days and the meaning of 9-days Stochastic Slow Oscillator is lower than 50.
The strategy sells at market, if close price is lower than the previous close price
during 2 days and the meaning of 9-days Stochastic Fast Oscillator is higher than 50.
Second strategy
Bull Power Indicator
To get more information please see "Bull And Bear Balance Indicator"
by Vadim Gimelfarb.
WARNING:
- For purpose educate only
- This script to change bars colors.

Combo Backtest 123 Reversal & Breakout Range Short This is combo strategies for get a cumulative signal.
First strategy
This System was created from the Book "How I Tripled My Money In The
Futures Market" by Ulf Jensen, Page 183. This is reverse type of strategies.
The strategy buys at market, if close price is higher than the previous close
during 2 days and the meaning of 9-days Stochastic Slow Oscillator is lower than 50.
The strategy sells at market, if close price is lower than the previous close price
during 2 days and the meaning of 9-days Stochastic Fast Oscillator is higher than 50.
Second strategy
Breakout Range Short Strategy
WARNING:
- For purpose educate only
- This script to change bars colors.

Combo Backtest 123 Reversal & Breakout Range Long This is combo strategies for get a cumulative signal.
First strategy
This System was created from the Book "How I Tripled My Money In The
Futures Market" by Ulf Jensen, Page 183. This is reverse type of strategies.
The strategy buys at market, if close price is higher than the previous close
during 2 days and the meaning of 9-days Stochastic Slow Oscillator is lower than 50.
The strategy sells at market, if close price is lower than the previous close price
during 2 days and the meaning of 9-days Stochastic Fast Oscillator is higher than 50.
Second strategy
Breakout Range Long Strategy
WARNING:
- For purpose educate only
- This script to change bars colors.
