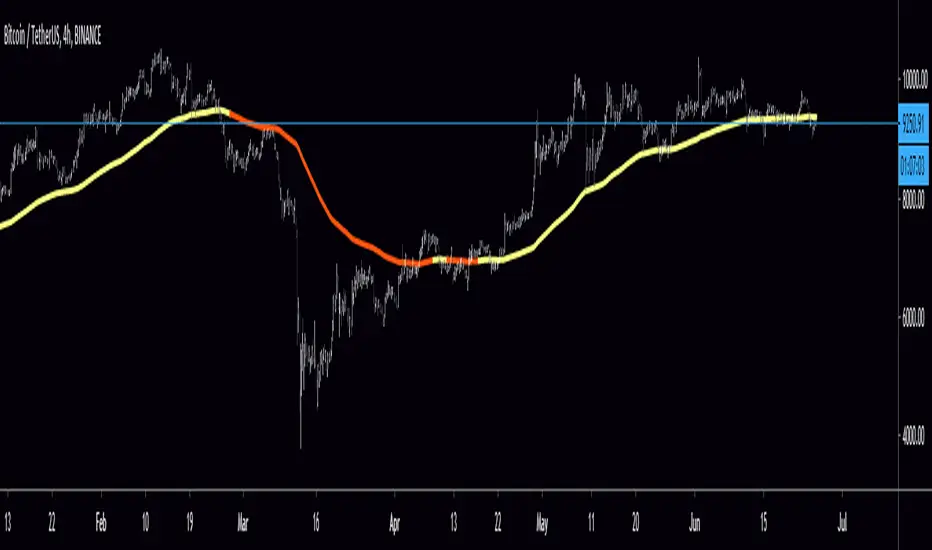
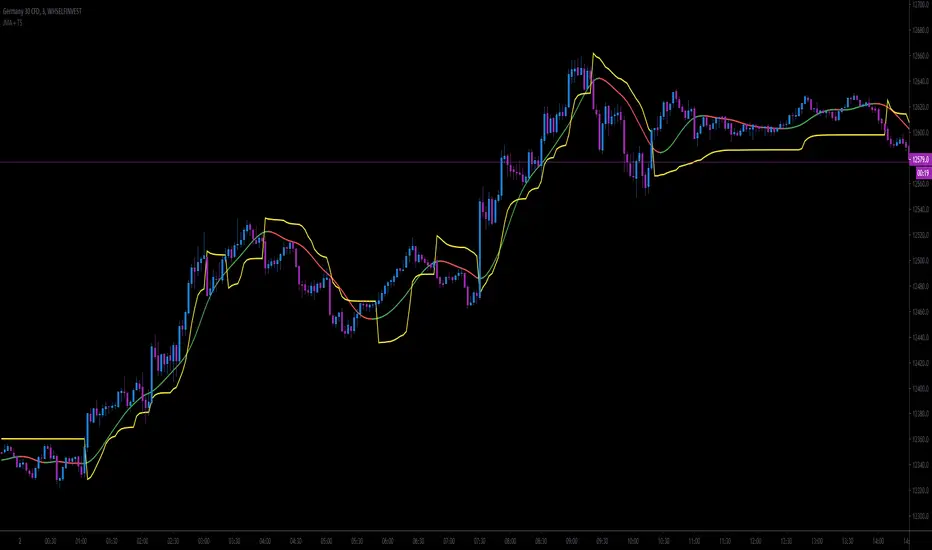
JMA + A2RTS + AlertsThe script is a combination of two high quality scripts Everget's JMA and Alex Grover's A2RTS script, all credit too them for the original code.
Additional thanks to Mango2Juice for the continued help as this is my first script published and it would not of been possible without the help.
The goal of this script is to allow for you to enter into trends and too keep you in them while maximizing profit.
Trade Conditions:
Buy Enter: when JMA goes from red to green and use yellow line (A2RTS) as a trail stop
Buy Exit: when A2RTS flips or JMA goes back to red
Sell Enter: when JMA goes from green to red and use yellow line (A2RTS) as a trail stop
Sell Exit: When A2RTS flips or JMA goes back to green
Alerts have also been added for when JMA changes color and when A2RTS flips
Please drop a comment below if this script is helpful or if you have any question
Once again this is my first script and I hope you all enjoy it.
Wyszukaj w skryptach "alert"
ck - EMA Cross with AlertsDisplays 5 popular EMAs (you can hide any you don’t want to see from the “Styles” screen when editing the config).
Set the values for your EMAs by clicking the cog after adding this indicator to your chart.
A Long or Short signal is fired when EMA1 crosses EMA2 - a cross up is a Long signal, a cross down is a Short signal.
Connect to your Bots (3commas / 3C.exchange recommended) to automate buys and sells!

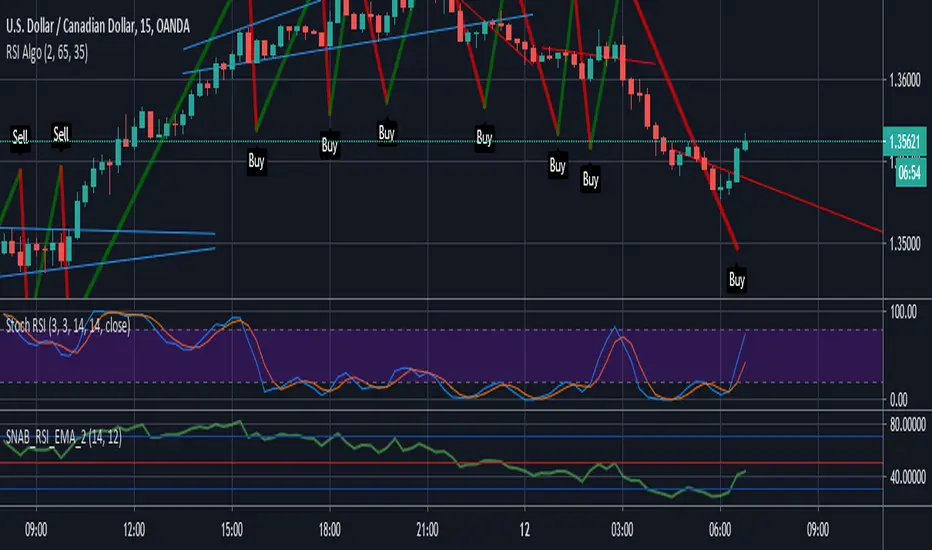
Trend Follow with kijun-sen/tenkan sen for 1 Hour SPX
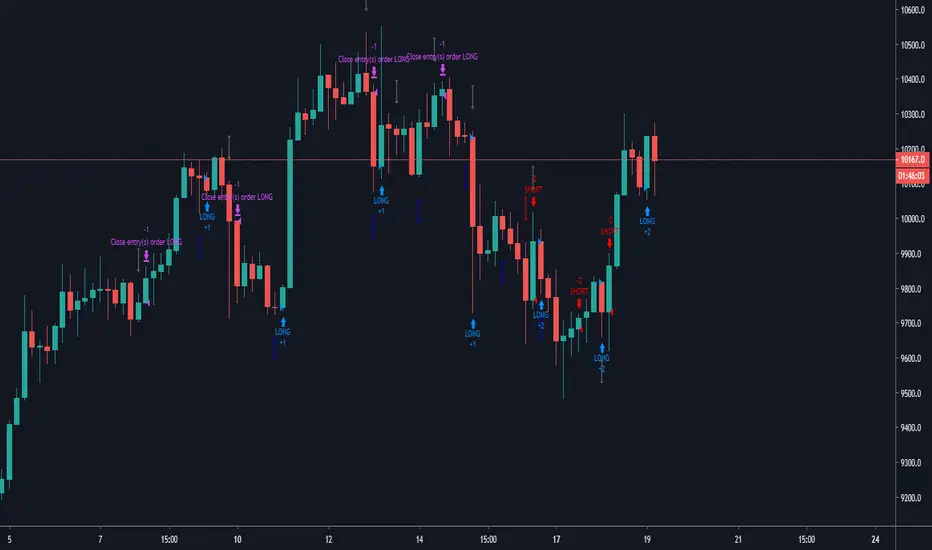
This script determines, plots and alerts on probable trend initiation and continuation points, using tenkan-sen(conversion line of ichimoku), kijun-sen(baseline of ichimoku) and stochastic RSI, for 1 H SPX.
New long/short trend initiates when prices cross above/below kijun sen. The trend continues when prices cross above/below tenkan-sen or stochastic RSI crosses up/down its signal line, while prices are above/below kijun-sen.
It is good to take partial profit between 10-15 points gain and trail the left with stops below kijun-sen line.
While placing the order, using 2-3 points buffer above/below of signal bars is recommended. Additionally, please be careful about clouds and do not place long/short orders below/above clouds.

RSI LookbackChecks RSI High/Low X candles in the past
Displays Green/Red circles at bottom of chart
Sends alerts

EMA 5/15/50/100/150/200 Strategy Alert By BDStrategy warns with minor alert conditions for the user. T-Do not trust just buy signal Confirm with MACD. EMA values are selectable optional for the user.Thanks to Nezir for his helps.

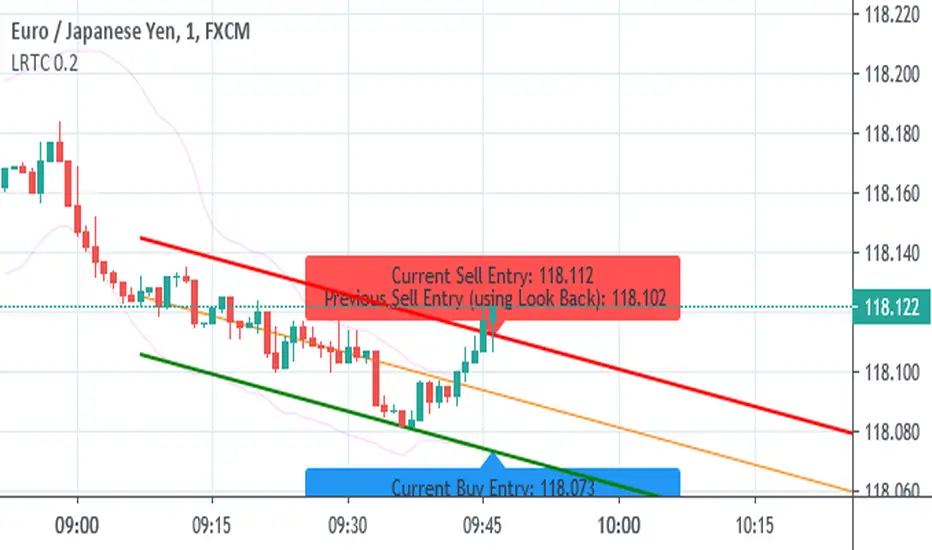
Linear Regression Trend Channel with Entries & AlertsPlease Use this Indicator If you understand the risk posed by linear regression trend channel
Features
Provides trend channel (best value for period is 40 on 5 minute timeframe
Provides BUY/SELL entries based on current channel
Provides custom color for channel
Best used with MattyPips strategy indicators
Risks : Please note, this script is the likes of Bollinger bands and poses a risk of falling in a trend range.
Entries may keep running on the same direction while the market is moving.
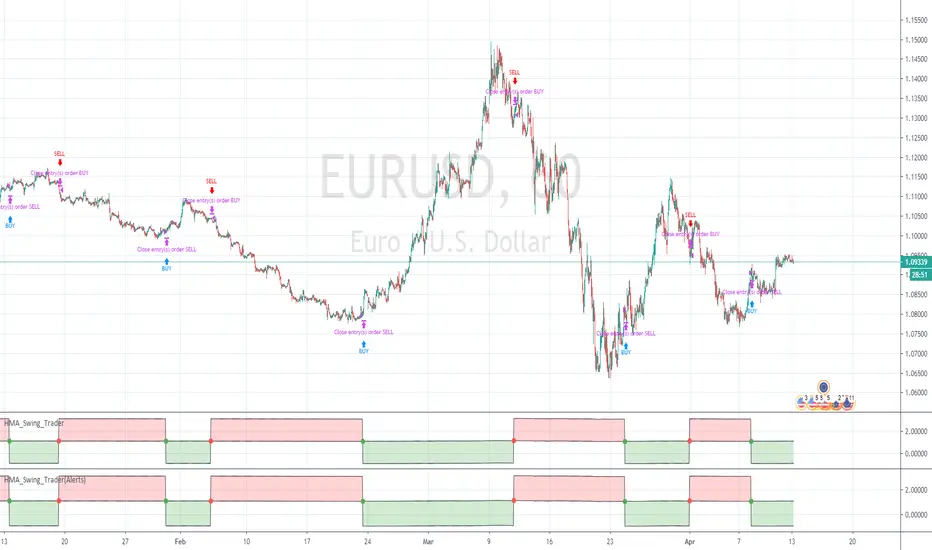
Hull Moving Average Swing Trader (Alerts)Hull Moving Average Strategy (Study version for ALERTS)
2 X HMA's,
1st HMA on current price (recommended source OPEN)
2nd HMA on previous candle. signal on crossover.
Buy and Sell signals on chart, red & green view pane (Green Buy, Red Sell) (RED & GREEN DOTS)
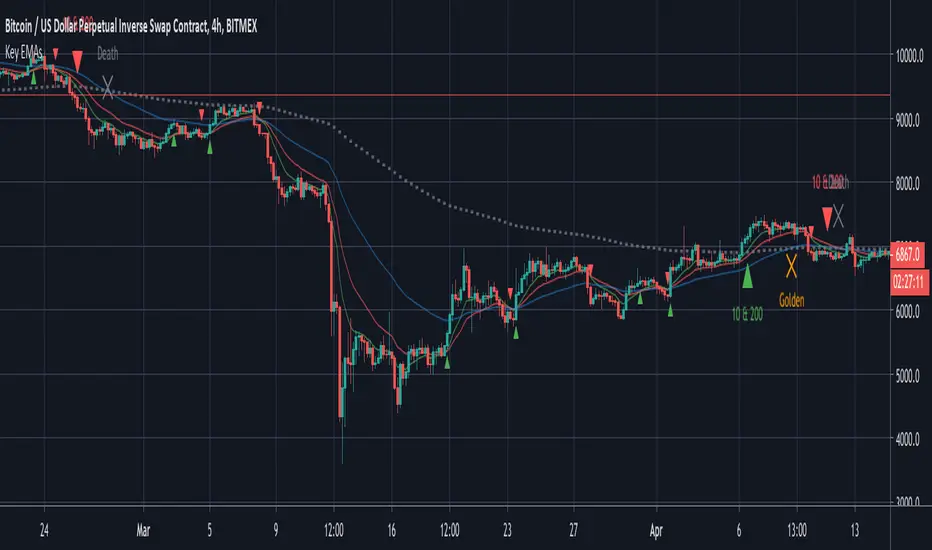
Key EMAsSimple trade helper script that plots:
- 10 & 20 EMA crosses for fast moves
- 10 & 200 EMA crosses for trends
- 50 & 200 EMA golden and death crosses
Alerts built in.
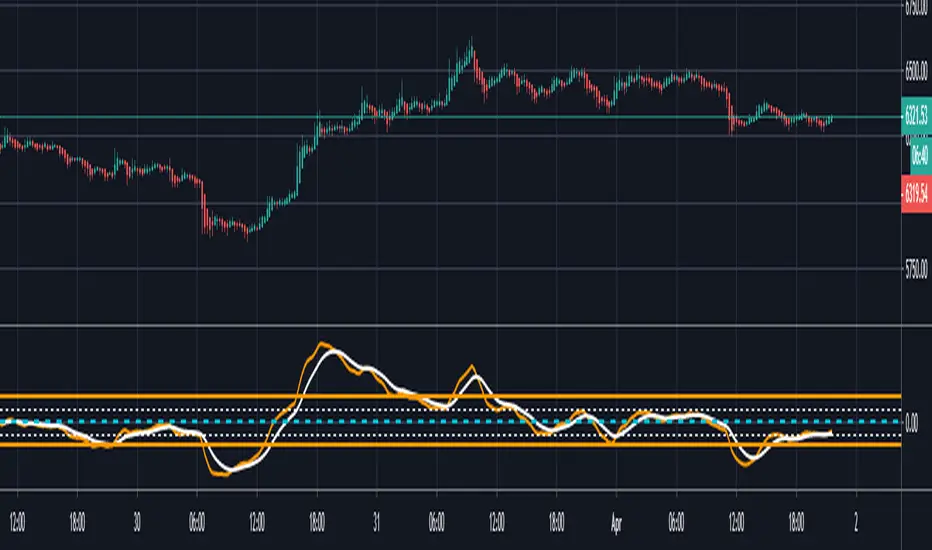
MACD At Scales with AlertsI use the horizontal scale lines on the MACD indicator as part of my scalping strategy along with other indicators like RSI/EMA and Market Cipher B when trading BTC
I am looking for a cross above or below the 12.5 and 25 horizontal scale lines, along with lining up other indicators
I set my alerts on the 5 min TF and look to the 15 and 30 min TF's for further confirmation.
I have find the scale lines to be very useful for visual reference of the crosses, above/below 25 lines is mostly a safer trade, crosses above/below 12.5 lines can have more risk, crosses between 0 baseline and 12.5 can have a higher return but have much more risk.
Don't ever use just this indicator by itself, you must always have at least 2 indicators running
This is an example of the TF's not lining up, so a entry here would be high risk
This is an example of the TF's lining up, so a entry here would be less risk
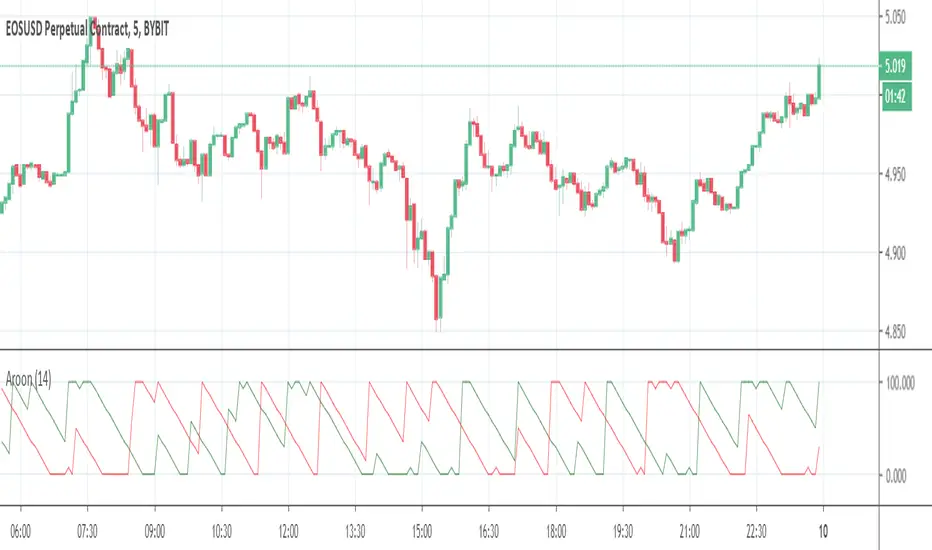
Aroon Crossing Alerts This script sends alerts when the aroon lines cross each other, the messages are in Spanish.
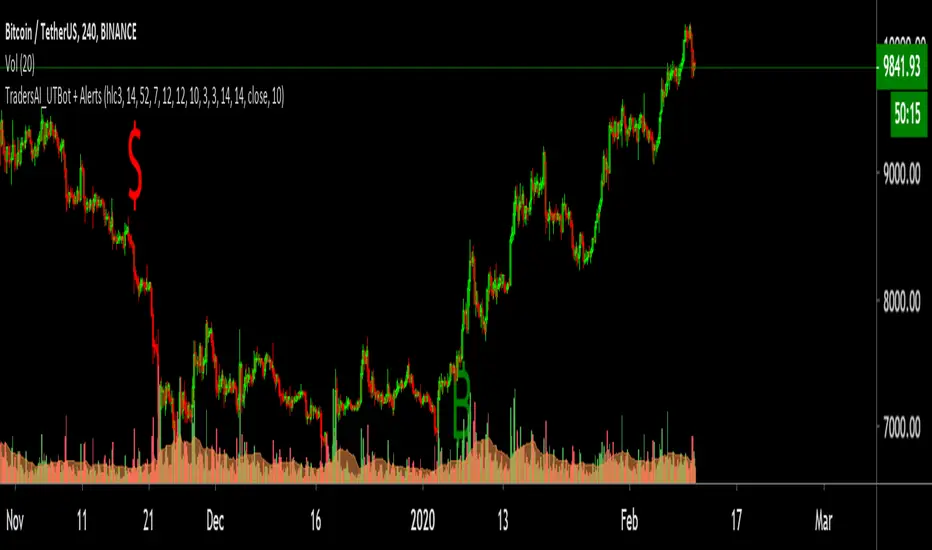
UT Bot AlertsUT Bot indicator was initially developer by @Yo_adriiiiaan
The idea of original code belongs @HPotter
These are v4 alerts for my previously published strategy:
Original script:

Slow Heiken Ashi and Exponential Moving average Strategy 2.2Strategy using Slow Heiken Ashi by Glaz and Exponential moving averages. Looking for someone to help me turn the strategy into non-reoccuring alerts as I am having trouble doing so.
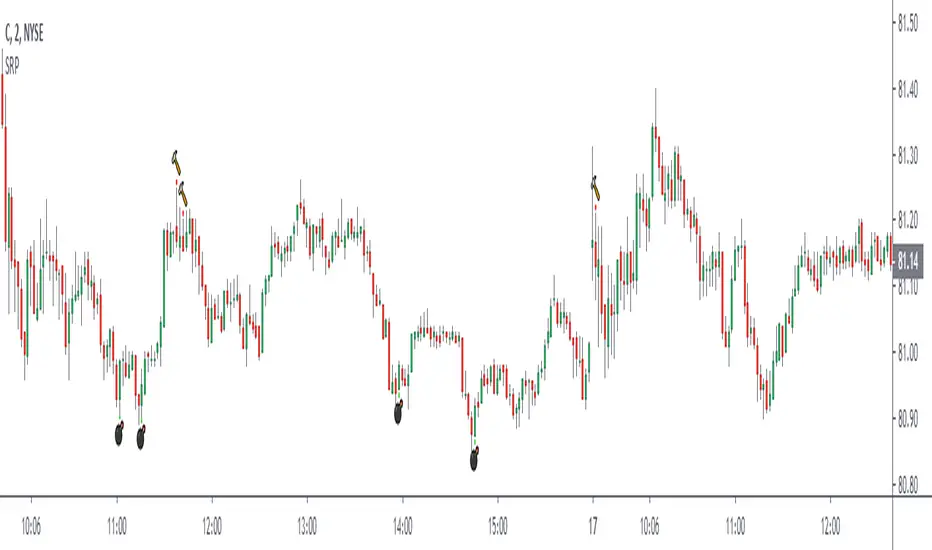
Simple Reversal PointThis indicator finds possible points of reversion, you can use it to stack positions and get a good average price for when the price changes direction, it is the trader responsibility to manage the position and make a profit.
-Added alerts
Simple EMA CrossQuick script I put together to complete the following:
---
- Simple EMA with the option to either display both or consolidate them as one
- Single EMA will change color based on a cross of the two EMA values entered
- Programmed alerts for bullish/bearish crossover
Enjoy!