Bollinger Band and ADX Retrace Alert v0.1 by JustUncleLThis script is an implementation of a well known Bollinger band + ADX retracement strategy for 1min to 15min charts. This variation uses my own settings, a market direction filter and has an alert that can be added to your trading alarms.
Wyszukaj w skryptach "adx"

Dynamic ADX - [The Pine Guru]Dynamic ADX by The Pine Guru
What is the Dynamic ADX?
The Dynamic ADX is an indicator created using the regular ADX, Line, and additional ADX Moving Average. This MA allows the script to calculate the ADX differently to the original ADX, providing greater input and accessibility to the user. As the ADX is a volatility indicator, it is communicates to trend strength in the markets. The Dynamic ADX displays these trending Periods through user controlled visualizers like Fills, Background Color, and Bar Color.
How do I use the Dynamic ADX?
This indicator has 4 different "versions" or "conditions" in which it displays trend strength. These are achieved by checking and unchecking ADX, ADX MA and Line. Different combinations of these 3 inputs will result in a change of true condition that the script outputs.
Dynamic ADX Achieved by checking the ADX and ADX MA, results in an ADX similar to an MA Crossover, with the ADX being over the MA indicating a true or strong trend condition.
Regular ADX Achieved by Checking the ADX and Line. Results in the regular calculation of the ADX.
Mixture Achieved by Checking all three sections, which results in the calculation a normal ADX as well as the MA. Provides and extra condition or confluence into the ADX.
MA and Line Achieved by checking the ADX MA and Line. Results in a similar calculation to an original ADX but with a smoother MA.
Recommendations
This indicator will work typically in all markets with high volume and volatility. It is recommended that it is used as a confluence in a trading system, and not as an outright indicator. As always do your own testing before live use with this indicator. Do your own Research and refinements.
Please Leave a like if you enjoy this Indicator

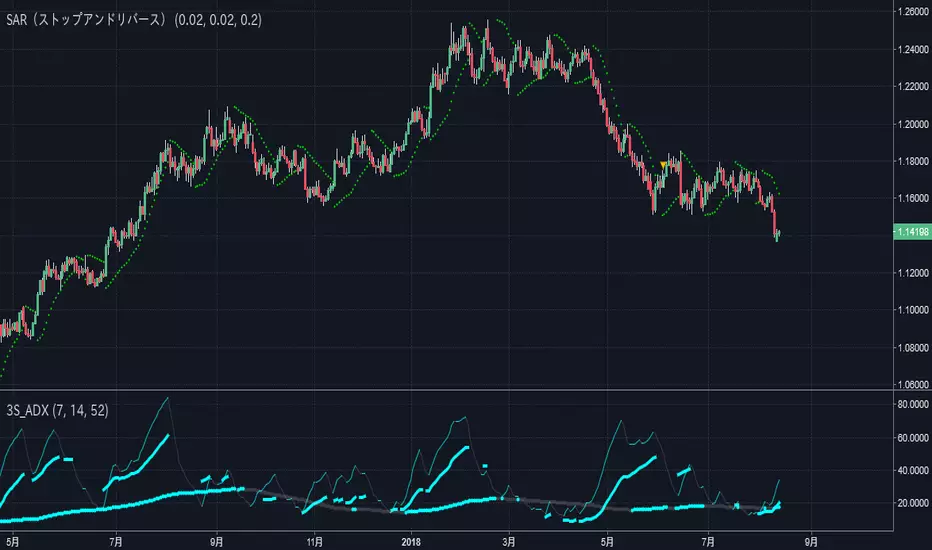
Triple Smoothed ADX==日本語説明も併記 // Japanese discription is following ==
■ Momentum index (Smoothed ADX triple display)
■ Effective assets: All
■Example of utilization
1) Trend generation is assumed at the timing when at least two lines including the blue thick line (14) are raised
2) Confirm the candlestick and if the price jumps out of the Bollinger band ± 1 σ, the trend toward that direction and recognition
3) If the closing price is confirmed within ± 1σ of the Bollinger band, close the position
■ Detailed explanation
Three Smoothed ADX with different parameters are displayed at the same time. As known as ADX included in DMI, it shows the strength of the trend.
It develops color in an upward phase to make it easy to recognize strengthening and weakening trends, and fades in a downward phase.
In addition, in accordance with the method of Wilder of the inventor in the calculation of ADX, a modified moving average (Smoothed Moving Average) is used instead of SMA.
Daily use is basic, but you can use it with the same parameters for other time feet.
The basic parameter (14) is set to a thick blue line for the most visibility.
Long-term parameters (52 * 26 is also acceptable) are indicated by blue circles as an auxiliary element for judging the rising margin of the basic line.
The short-term parameter (7) is displayed as a line as an auxiliary element for recognizing the peak out of the basic line in advance.
In some cases, changing the short term (7) to the very long term (100) allows you to recognize the major market price level once in several years.
Three periods The phrase "all lines" goes from "low position" to "rising together" is considered the strongest trend.
On the other hand, in the case where the short-term line rises backwards as the longer-term line goes down, it tends to end up with short-lived trends and failure to form trends.
Please note that there is no way to judge whether the trend suggested by this index rises or falls from this index, so it is necessary to confirm the main chart. (It is preferable to display parabolic SAR or Bollinger band)
■ Remarks
It is an index created assuming that it is used as Triple STD-ADX in combination with Triple Smoothed ADX(to be posted later).
■ About Triple STD-ADX
Triple Standard Deviation "and" Triple Smoothed ADX "are superimposed and displayed as" Screen (without scale) "to function as" Triple STD - ADX ".
The method of utilization is the same as Triple Standard Deviation and Triple Smoothed ADX, but by simultaneously displaying two momentum indicators with different calculation approaches with multiple parameters, we aim to mutually complement the cognitive power of trends.
STD (13, 26, 52, 100, 200) and ADX (7, 14, 26, 52, 100) correspond to reaction rates respectively.
By choosing different reaction rates you can expect to further increase reliability.
You can estimate the reliability of the trend most reliably in a situation where all six signals in total rise from low to high.
■Sample: STD-ADX Trade Signal
========================================================
モメンタム指標(Smoothed ADXの3連表示)
■ 有効アセット:すべて
■ 活用の一例
1)青の太線(14)を含む少なくとも2本のラインが上昇したタイミングでトレンド発生を想定
2)ローソク足を確認し、ボリンジャーバンド±1σの外に価格が飛び出している場合はその方向へのトレンドと認識
3)ボリンジャーバンド±1σ以内で終値が確定した場合にはポジションクローズ
■ 詳細説明
パラメーターの異なる3つのSmoothed ADXを同時に表示します。DMIに内包されるADXとして知られるように、トレンドの強度を示します。
トレンドの強化と弱化を認識しやすいように上昇局面で発色し、下降局面で退色します。
なお、ADXの計算において考案者ワイルダーの手法に倣い、SMAではなく修正移動平均(Smoothed Moving Average/ワイルダー移動平均)を使用しています。
活用は日足が基本ですが、他の時間足に対しても同一パラメーターで使用することができます。
基本パラメーター(14)は最も視認しやすいように青の太線にしています。
長期パラメーター(52※26も可)は基本線の上昇余力を判断するための補助要素として青色の丸点で表示しています。
短期パラメーター(7)は基本線のピークアウトを先行して認識するための補助要素としてラインで表示にしています。
場合によって、短期(7)を超長期(100)に変更することで数年に一度のレベルの大相場が認識できます。
3期間「全てのライン」が「低い位置」から「揃って上昇」する局面を最も強いトレンドと考えます。
一方、より長期のラインが低下する中、より短期のラインが逆行して上昇するケースでは、短命のトレンドやトレンド形成失敗に終わることが多くなります。
なお、本指標が示唆するトレンドが上昇か下降かは本指標からは判断する術はないため、必ずメインチャートを確認する必要があります。(パラボリックやボリンジャーバンドを表示すると好適)
■備考
先に掲載したTriple Standard Deviationと併用して、Triple STD-ADXとして使用することを想定して作成した指標です。
■Triple STD-ADXについて
「 Triple Standard Deviation 」と「Triple Smoothed ADX」を一方を「スクリーン(スケールなし)」として重ねて表示させることで「Triple STD-ADX」として機能します。
活用方法はTriple Standard DeviationやTriple Smoothed ADXと同じですが、算出アプローチの異なる2つのモメンタム指標を複数パラメーターで同時に表示させることで、トレンドの認識力を相互に補完する狙いがあります。
反応速度はそれぞれSTD(13,26,52,100,200)とADX(7,14,26,52,100)がほぼ対応します。
異なる反応速度を選択することで信頼度をさらに高めることを期待できます。
合計6本のシグナル全てが低い位置から揃って上昇する局面でトレンドの信頼性を最も高く見積もることができます。
ZenAlgo - ADXThis open-source indicator builds upon the official Average Directional Index (ADX) implementation by TradingView. It preserves the core logic of the original ADX while introducing additional visualization features, configurability, and analytical overlays to assist with directional strength analysis.
Core Calculation
The script computes the ADX, +DI, and -DI based on smoothed directional movement and true range over a user-defined length. The smoothing is performed using Wilder’s method, as in the original implementation.
True Range is calculated from the current high, low, and previous close.
Directional Movement components (+DM, -DM) are derived by comparing the change in highs and lows between consecutive bars.
These values are then smoothed, and the +DI and -DI are expressed as percentages of the smoothed True Range.
The difference between +DI and -DI is normalized to derive DX, which is further smoothed to yield the ADX value.
The indicator includes a selectable signal line (SMA or EMA) applied to the ADX for crossover-based visualization.
Visualization Enhancements
Several plots and conditions have been added to improve interpretability:
Color-coded histograms and lines visualize DI relative to a configurable threshold (default: 25). Colors follow the ZenAlgo color scheme.
Dynamic opacity and gradient coloring are used for both ADX and DI components, allowing users to distinguish weak/moderate/strong directional trends visually.
Mirrored ADX is internally calculated for certain overlays but not directly plotted.
The script also provides small circles and diamonds to highlight:
Crossovers between ADX and its signal line.
DI crossing above or below the 25 threshold.
Rising ADX confirmed by rising DI values, with point size reflecting ADX strength.
Divergence Detection
The indicator includes optional detection of fractal-based divergences on the DI curve:
Regular and hidden bullish and bearish divergences are identified based on relative fractal highs/lows in both price and DI.
Detected divergences are optionally labeled with 'R' (Regular) or 'H' (Hidden), and color-coded accordingly.
Fractal points are defined using 5-bar patterns to ensure consistency and reduce false positives.
ADX/DI Table
When enabled, a floating table displays live values and summaries:
ADX value , trend direction (rising/falling), and qualitative strength.
DI composite , trend direction, and relative strength.
Contextual power dynamics , describing whether bulls or bears are gaining or losing strength.
The background colors of the table reflect current trend strength and direction.
Interpretation Guidelines
ADX indicates the strength of a trend, regardless of its direction. Values below 20 are often considered weak, while those above 40 suggest strong trending conditions.
+DI and -DI represent bullish and bearish directional movements, respectively. Crossovers between them are used to infer trend direction.
When ADX is rising and either +DI or -DI is dominant and increasing, the trend is likely strengthening.
Divergences between DI and price may suggest potential reversals but should be interpreted cautiously and not in isolation.
The threshold line (default 25) provides a basic filter for ignoring low-strength conditions. This can be adjusted depending on the market or timeframe.
Added Value over Existing Indicators
Fully color-graded ADX and DI display for better visual clarity.
Optional signal MA over ADX with crossover markers.
Rich contextual labeling for both divergence and threshold events.
Power dynamics commentary and live table help users contextualize current momentum.
Customizable options for smoothing type, divergence display, table position, and visual offsets.
These additions aim to improve situational awareness without altering the fundamental meaning of ADX/DI values.
Limitations and Disclaimers
As with any ADX-based tool, this indicator does not indicate market direction alone —it measures strength, not trend bias.
Divergence detection relies on fractal patterns and may lag or produce false positives in sideways markets.
Signal MA crossovers and DI threshold breaks are not entry signals , but contextual markers that may assist with timing or filtering other systems.
The table text and labels are for visual assistance and do not replace proper technical analysis or market context.

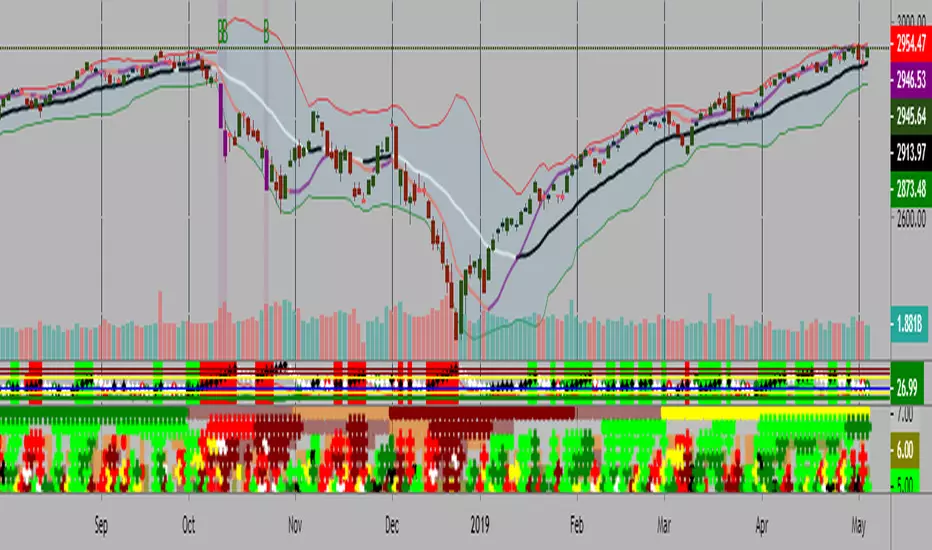
Adv EMA Cloud v6 (ADX, Alerts)Summary:
This indicator provides a multi-faceted view of market trends using Exponential Moving Averages (EMAs) arranged in visually intuitive clouds, enhanced with an optional ADX-based range filter and configurable alerts for key market conditions. It aims to help traders quickly gauge trend alignment across short, medium, and long timeframes while filtering signals during potentially choppy market conditions.
Key Features:
Multiple EMAs: Displays 10-period (Fast), 20-period (Mid), and 50-period (Slow) EMAs.
Long-Term Trend Filter: Includes a 200-period EMA to provide context for the overall dominant trend direction.
Dual EMA Clouds:
Fast/Mid Cloud (10/20 EMA): Fills the area between the 10 and 20 EMAs. Defaults to Green when 10 > 20 (bullish short-term momentum) and Red when 10 < 20 (bearish short-term momentum).
Mid/Slow Cloud (20/50 EMA): Fills the area between the 20 and 50 EMAs. Defaults to Aqua when 20 > 50 (bullish mid-term trend) and Fuchsia when 20 < 50 (bearish mid-term trend).
Optional ADX Range Filter: Uses the Average Directional Index (ADX) to identify potentially non-trending or choppy markets. When enabled and ADX falls below a user-defined threshold, the EMA clouds will turn grey, visually warning that trend-following signals may be less reliable.
Configurable Alerts: Provides several built-in alert conditions using Pine Script's alertcondition function:
Confluence Condition: Triggers when a 10/20 EMA crossover occurs while both EMA clouds show alignment (both bullish/green/aqua or both bearish/red/fuchsia) and price respects the 200 EMA filter and the ADX filter indicates a trend (if filters are enabled).
MA Filter Cross: Triggers when price crosses above or below the 200 EMA filter line.
Full Alignment Start: Triggers on the first bar where full bullish or bearish alignment occurs (both clouds aligned + MA filter respected + ADX trending, if filters are enabled).
How It Works:
EMA Calculation: Standard Exponential Moving Averages are calculated for the 10, 20, 50, and 200 periods based on the closing price.
Cloud Creation: The fill() function visually shades the area between the 10 & 20 EMAs and the 20 & 50 EMAs.
Cloud Coloring: The color of each cloud is determined by the relationship between the two EMAs that define it (e.g., if EMA 10 is above EMA 20, the first cloud is bullish-colored).
ADX Filter Logic: The script calculates the ADX value. If the "Use ADX Trend Filter?" input is checked and the calculated ADX is below the specified "ADX Trend Threshold", the script considers the market potentially ranging.
ADX Visual Effect: During detected ranging periods (if the ADX filter is active), the plotCloud12Color and plotCloud23Color variables are assigned a neutral grey color instead of their normal bullish/bearish colors before being passed to the fill() function.
Alert Logic: Boolean variables track the specific conditions (crossovers, cloud alignment, filter positions, ADX state). The alertcondition() function creates triggerable alerts based on these pre-defined conditions.
Potential Interpretation (Not Financial Advice):
Trend Alignment: When both clouds share the same directional color (e.g., both bullish - Green & Aqua) and price is on the corresponding side of the 200 EMA filter, it may suggest a stronger, more aligned trend. Conversely, conflicting cloud colors may indicate indecision or transition.
Dynamic Support/Resistance: The EMA lines themselves (especially the 20, 50, and 200) can sometimes act as dynamic levels where price might react.
Range Warning: Greyed-out clouds (when ADX filter is enabled) serve as a visual warning that trend-based strategies might face increased difficulty or whipsaws.
Confluence Alerts: The specific confluence alerts signal moments where multiple conditions align (crossover + cloud agreement + filters), which some traders might view as higher-probability setups.
Customization:
All EMA lengths (10, 20, 50, 200) are adjustable via the Inputs menu.
The ADX length and threshold are configurable.
The MA Trend Filter and ADX Trend Filter can be independently enabled or disabled.
Disclaimer:
This indicator is provided for informational and educational purposes only. Trading financial markets involves significant risk. Past performance is not indicative of future results. Always conduct your own thorough analysis and consider your risk tolerance before making any trading decisions. This indicator should be used in conjunction with other analysis methods and tools. Do not trade based solely on the signals or visuals provided by this indicator.

Adaptive Fusion ADX VortexIntroduction
The Adaptive Fusion ADX DI Vortex Indicator is a powerful tool designed to help traders identify trend strength and potential trend reversals in the market. This indicator uses a combination of technical analysis (TA) and mathematical concepts to provide accurate and reliable signals.
Features
The Adaptive Fusion ADX DI Vortex Indicator has several features that make it a powerful tool for traders. The Fusion Mode combines the Vortex Indicator and the ADX DI indicator to provide a more accurate picture of the market. The Hurst Exponent Filter helps to filter out choppy markets (inspired by balipour). Additionally, the indicator can be customized with various inputs and settings to suit individual trading strategies.
Signals
The enterLong signal is generated when the algorithm detects that it's a good time to buy a stock or other asset. This signal is based on certain conditions such as the values of technical indicators like ADX, Vortex, and Fusion. For example, if the ADX value is above a certain threshold and there is a crossover between the plus and minus lines of the ADX indicator, then the algorithm will generate an enterLong signal.
Similarly, the enterShort signal is generated when the algorithm detects that it's a good time to sell a stock or other asset. This signal is also based on certain conditions such as the values of technical indicators like ADX, Vortex, and Fusion. For example, if the ADX value is above a certain threshold and there is a crossunder between the plus and minus lines of the ADX indicator, then the algorithm will generate an enterShort signal.
The exitLong and exitShort signals are generated when the algorithm detects that it's a good time to close a long or short position, respectively. These signals are also based on certain conditions such as the values of technical indicators like ADX, Vortex, and Fusion. For example, if the ADX value crosses above a certain threshold or there is a crossover between the minus and plus lines of the ADX indicator, then the algorithm will generate an exitLong signal.
Usage
Traders can use this indicator in a variety of ways, depending on their trading strategy and style. Short-term traders may use it to identify short-term trends and potential trade opportunities, while long-term traders may use it to identify long-term trends and potential investment opportunities. The indicator can also be used to confirm other technical indicators or trading signals. Personally, I prefer to use it for short-term trades.
Strengths
One of the strengths of the Adaptive Fusion ADX DI Vortex Indicator is its accuracy and reliability. The indicator uses a combination of TA and mathematical concepts to provide accurate and reliable signals, helping traders make informed trading decisions. It is also versatile and can be used in a variety of trading strategies.
Weaknesses
While this indicator has many strengths, it also has some weaknesses. One of the weaknesses is that it can generate false signals in choppy or sideways markets. Additionally, the indicator may lag behind the market, making it less effective in fast-moving markets. That's a reason why I included the Hurst Exponent Filter and special smoothing.
Concepts
The Adaptive ADX DI Vortex Indicator with Fusion Mode and Hurst Filter is based on several key concepts. The Average Directional Index (ADX) is used to measure trend strength, while the Vortex Indicator is used to identify trend reversals. The Hurst Exponent is used to filter out noise and provide a more accurate picture of the market.
In conclusion, the Adaptive Fusion ADX DI Vortex Indicator is a versatile and powerful tool for traders. By combining technical analysis and mathematical concepts, this indicator provides accurate and reliable signals for identifying trend strength and potential trend reversals. While it has some weaknesses, its many strengths and features make it a valuable addition to any trader's toolbox.
---
Credits to:
▪️@cheatcountry – Hann Window Smoohing
▪️@loxx – VHF and T3
▪️@balipour – Hurst Exponent Filter

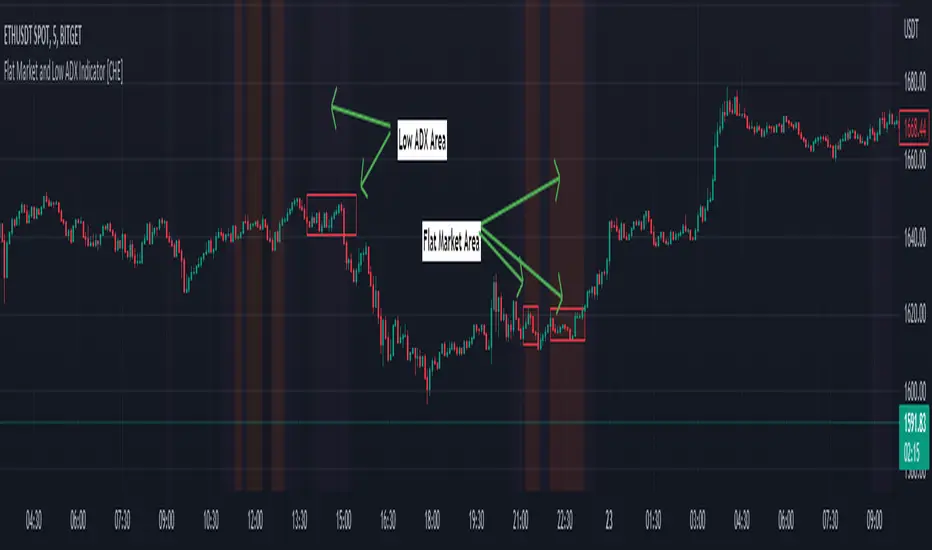
Flat Market and Low ADX Indicator [CHE]Why use the Flat Market and Low ADX Indicator ?
Flat markets, where prices remain within a narrow range for an extended period, can be both critical and dangerous for traders. In a flat market, the price action becomes less predictable, and traders may struggle to find profitable trading opportunities. As a result, many traders may decide to take a break from the market until a clear trend emerges.
However, flat markets can also be dangerous for traders who continue to trade despite the lack of clear trends. In the absence of a clear direction, traders may be tempted to take larger risks or make impulsive trades in an attempt to capture small profits. Such behavior can quickly lead to significant losses, especially if the market suddenly breaks out of its flat range, causing traders to experience large drawdowns.
Therefore, it is essential to approach flat markets with caution and to have a clear trading plan that incorporates strategies for both trending and flat markets. Traders may also use technical indicators, such as the Flat Market and Low ADX Indicator, to help identify flat markets and determine when it is appropriate to enter or exit a position.
The confluence between flat markets and low ADX readings can further increase the risk of trading during these periods. The ADX (Average Directional Index) is a technical indicator used to measure the strength of a trend. A low ADX reading indicates that the market is in a consolidation phase, which can coincide with a flat market. When a flat market occurs during a period of low ADX, traders should be even more cautious, as there is little to no directional bias in the market. In this situation, traders may want to consider waiting for a clear trend to emerge or using range-bound trading strategies to avoid taking excessive risks.
Introduction:
Pine Script is a programming language used for developing custom technical analysis indicators and trading strategies in TradingView. This particular script is an indicator designed to identify flat markets and low ADX conditions. In this description, we will delve deeper into the functionality of this script and how it can be used to improve trading decisions.
Description:
The first input in the script is the length of the moving average used for calculating the center line. This moving average is used to define the high and low range of the market. The script then calculates the middle value of the range by taking the double exponential moving average (EMA) of the high, low, and close prices.
The script then determines whether the market is flat by comparing the middle value of the range with the high and low values. If the middle value is greater than the high value or less than the low value, the market is not flat. If the middle value is within the high and low range, the script considers the market to be flat. The script also uses RSI filter settings to further confirm if the market is flat or not. If the RSI value is between the RSI min and max values, then the market is considered flat. If the RSI value is outside this range, the market is not considered flat.
The script also calculates the ADX (Average Directional Index) to determine whether it's in a low area. ADX is a technical indicator used to measure the strength of a trend. The script uses the ADX filter settings to define the ADX threshold value. If the ADX value is below the threshold value, the script considers the market to be in a low ADX area.
The script provides various input options to customize the display settings, including the option to show the flat market and low ADX areas. Users can choose their preferred colors for the flat market and low ADX areas and adjust the transparency levels to suit their needs.
Conclusion:
In conclusion, this Pine Script indicator is designed to identify flat market and low ADX conditions, which can help traders make informed trading decisions. The script uses a range of inputs and calculations to determine the market direction, RSI filter, and ADX filter. By customizing the display settings, users can adjust the indicator to suit their preferences and improve their trading strategies. Overall, this script can be a valuable tool for traders looking to gain an edge in the markets.
Acknowledgments:
Thanks to the Pine Script™ v5 User Manual www.tradingview.com
MM SIGMA STC+ADXThe Schaff Trend Cycle (STC) is a charting indicator that is commonly used to identify market trends and provide buy and sell signals to traders. Developed in 1999 by noted currency trader Doug Schaff, STC is a type of oscillator and is based on the assumption that, regardless of time frame, currency trends accelerate and decelerate in cyclical patterns.12
How STC Works
Many traders are familiar with the moving average convergence/divergence (MACD) charting tool, which is an indicator that is used to forecast price action and is notorious for lagging due to its slow responsive signal line . By contrast, STC’s signal line enables it to detect trends sooner. In fact, it typically identifies up and downtrends long before MACD indicator.
While STC is computed using the same exponential moving averages as MACD, it adds a novel cycle component to improve accuracy and reliability. While MACD is simply computed using a series of moving average, the cycle aspect of STC is based on time (e.g., number of days).
It should also be noted that, although STC was developed primarily for fast currency markets, it may be effectively employed across all markets, just like MACD. It can be applied to intraday charts, such as five minutes or one-hour charts, as well as daily, weekly, or monthly time frames.
Introduction to ADX
ADX is used to quantify trend strength. ADX calculations are based on a moving average of price range expansion over a given period of time. The default setting is 14 bars, although other time periods can be used.1 ADX can be used on any trading vehicle such as stocks, mutual funds, exchange-traded funds and futures.
ADX is plotted as a single line with values ranging from a low of zero to a high of 100. ADX is non-directional; it registers trend strength whether price is trending up or down.2 The indicator is usually plotted in the same window as the two directional movement indicator (DMI) lines, from which ADX is derived (shown below).Quantifying Trend Strength
ADX values help traders identify the strongest and most profitable trends to trade. The values are also important for distinguishing between trending and non-trending conditions. Many traders will use ADX readings above 25 to suggest that the trend is strong enough for trend-trading strategies. Conversely, when ADX is below 25, many will avoid trend-trading strategies.
ADX Value Trend Strength
0-25 Absent or Weak Trend
25-50 Strong Trend
50-75 Very Strong Trend
75-100 Extremely Strong Trend
Low ADX is usually a sign of accumulation or distribution. When ADX is below 25 for more than 30 bars, price enters range conditions, and price patterns are often easier to identify. Price then moves up and down between resistance and support to find selling and buying interest, respectively. From low ADX conditions, price will eventually break out into a trend. Below, the price moves from a low ADX price channel to an uptrend with strong ADX.
Added Buy/Sell alerts
ADX filters based on the threshold you put in the settings.
great for trend and trade confirmation

Kal’s MTF ADX Rangoli RollerKaly MTF ADX Rangoli Roller is a method/study for finding trending stocks, indexes and cryptocurrencies using two different data periods (10, 5) of ADX Overlap over different time-frames (10m, 1H, 4H, 1D, 1W, 1M). In the study, I used 5-Period ADX for all mentioned time-frames. You may use 10-Period ADX for lower time-frames especially 10m and 1H.
Sample Image of the pinescript code(at the end of this post) in Tradingview looks as follows:
Note: Kal's MTF ADX Rangoli Roller is the lower Plot. The upper plot is KAL’s ADX Overlap Technical Study with MACD Filter( )
Description:
----------------
In the study plot, the lowest row is 10m, row above is 1H, row above is 4H, then 1D, then 1W and highest row is 1M
Lime(Bright Green) dot implies Trending Uptrend for that time-frame (first phase)
Green dot implies Trending Uptrend for that time-frame (second phase near exhaustion)
Red dot implies Trending Downward for that time-frame (first phase)
Maroon dot implies Trending Downward for that time-frame (second phase near exhaustion)
Lime cross implies Strong Trending Uptrend for that time-frame (first phase)
Green cross implies Strong Trending Uptrend for that time-frame (second phase near exhaustion)
Red cross implies Trending Strong Downward for that time-frame (first phase)
Maroon cross implies Trending Strong Downward for that time-frame (second phase near exhaustion)
Yellow is ‘Squeeze On’ setting. During the squeeze period, the ADX signals are almost always ineffective. One may wait and watch over during this time. Once the Squeeze is released (i.e. no longer yellow), the trend corresponds to the color of the dots and crosses.
Black is CRSI Overbought condition for that time-frame. It’s best to wait and research for possibility of trend reversal because
1. Profit-booking/trimming happens after CRSI Overbought condition.
2. Large Short-sellers may take huge positions during this time pushing the stock prices up.
White is CRSI Oversold condition for that time-frame. It’s best to wait and research for possibility of trend reversal because
1. Profit-booking/trimming happens after CRSI Oversold conditions.
2. Large buyers may take huge positions during this time pushing the stock prices down.
I am a disabled man. Therefore, I am not able to write in detail here today. More Details will follow as time permits. Please let me know if I am missing anything…
Legal Disclaimer: I published here so I get replies from fellow viewers to educate myself and for my daily expenses. Hence, if anyone uses this script for making their decisions, I am not responsible for any failures incurred.
Safe Trading!
Kal Gandikota
PS: If you found this script interesting and edifying please follow and upvote.
PS2: Please kindly donate for my daily expenses (atleast as you would on streets) at the following addresses:
BTC Wallet: 1NeDC1GvpFa49DFLuT1v28ohFjqtoWXNQ5
ETH Wallet: 0x35e557F39A998e7d35dD27c6720C3553e1c65053
NEO Wallet: AUdiNJDW7boeUyYYNhX86p2T8eWwuELSGr
PS3: For more information on ADX and CRSI, please 'Google' or search here yourself.
PS4: This study is intended for research in creating automated Python Trading Systems using Pandas( steemit.com ).
Screenshots of the pinescript code looks as follows:
10minute Screenshot of Kal's MTF ADX Rangoli Roller (Above)
1 Hour Screenshot of Kal's MTF ADX Rangoli Roller (Above)
4 Hour Screenshot of Kal's MTF ADX Rangoli Roller (Above)
1 Day Screenshot of Kal's MTF ADX Rangoli Roller (Above)
1 Week Screenshot of Kal's MTF ADX Rangoli Roller (Above)
1 Month Screenshot of Kal's MTF ADX Rangoli Roller (Above)
MTF ADX and DMI Grid with RSIHello and welcome to my latest revision of my ADX and DMI series.
This indicator features the Average Directional Index (ADX) and the Directional Moving Index (DMI), with a multi-timeframe (MTF) grid that shows you the dominant DMI on the select timeframes. There are four grid rows, allowing you to select four different timeframes to show in the study. In addition to this, the colors displayed in the grid will reflect RSI levels, when the RSIs on the select timeframes exceed 70 or 80, or fall below 30 or 20.
For example, if one of your select timeframes is 4h, the standard settings will display a blue block in the relative row of the grid if the +DMI is above the -DMI on the 4h timeframe. If the RSI exceeds 70, the shade of blue will become darker, and become even darker if the 4h RSI exceeds 80. This will apply for the inverse case, where if the -DMI is dominant, the grid will display a darker shade of red as the 4h RSI falls below 30 and 20.
The ADX is the line in the oscillator that changes between black, white, and gray. ADX will be black when it is rising, white when it is falling, and gray when it is below the key level value (default set to 20). When ADX is below 20, you can assume the dominant DMI is irrelevant as there is no real trend strength. You can change your set key value in the oscillator settings, as well as all the colors, and so on.
If you are not familiar with the ADX and DMI indicator, a useful guide can be found below:
1) An ADX reading below 20 signifies that there is no prevailing trend in play. This means that, regardless of DMI dominance, there is no real strength. This is a good measure for sideways price action.
2) If +DMI is above -DMI, this means that a bullish trend is in play, and vice versa (where a -DMI dominance shows a bearish trend in play). Make sure to pay attention to the value of ADX, as this will show the significance of DMI dominance.
3) The strongest possible position you can have is one where the DMIs have a crossover on an ADX that is perking or sloping upwards.
4) You should be exiting your positions at the peak of the ADX , shown by the color changes, as this is often the furthest extent of the dominant trend. Once the ADX tips, the trend weakens and is less likely to see continuation. NOTE: Divergences are possible, where the ADX may be falling, but the dominant trend sees continuation. This simply means that the dominant trend is weakening, but still going.
5) Speculating on DMI crossovers is dangerous, especially on larger timeframes. Be careful when doing so if you are not familiar with the calculations behind the DMIs and if you are not familiar with how movements on lower timeframes translate to larger timeframes.
Additional resources to learn about ADX & DMI:
1) seekingalpha.com
2) stockcharts.com
Previous versions:
1)
2)
Happy trading and feel free to reach out with any question, suggestions, or concerns!
ADX and DI - Trader FelipeADX and DI - Trader Felipe
This indicator combines the Average Directional Index (ADX) and the Directional Indicators (DI+ and DI-) to help traders assess market trends and their strength. It is designed to provide a clear view of whether the market is in a trending phase (either bullish or bearish) and helps identify potential entry and exit points.
What is ADX and DI?
DI+ (Green Line):
DI+ measures the strength of upward (bullish) price movements. When DI+ is above DI-, it signals that the market is experiencing upward momentum.
DI- (Red Line):
DI- measures the strength of downward (bearish) price movements. When DI- is above DI+, it suggests that the market is in a bearish phase, with downward momentum.
ADX (Blue Line):
ADX quantifies the strength of the trend, irrespective of whether it is bullish or bearish. The higher the ADX, the stronger the trend:
ADX > 20: Indicates a trending market (either up or down).
ADX < 20: Indicates a weak or sideways market with no clear trend.
Threshold Line (Gray Line):
This horizontal line, typically set at 20, represents the threshold for identifying whether the market is trending or not. If ADX is above 20, the market is considered to be in a trend. If ADX is below 20, it suggests that the market is not trending and is likely in a consolidation phase.
Summary of How to Use the Indicator:
Trend Confirmation: Use ADX > 20 to confirm a trending market. If ADX is below 20, avoid trading.
Long Entry: Enter a long position when DI+ > DI- and ADX > 20.
Short Entry: Enter a short position when DI- > DI+ and ADX > 20.
Avoid Sideways Markets: Do not trade when ADX is below 20. Look for other strategies for consolidation phases.
Exit Strategy: Exit the trade if ADX starts to decline or if the DI lines cross in the opposite direction.
Combine with Other Indicators: Use additional indicators like RSI, moving averages, or support/resistance to filter and confirm signals.

GKD-V Average Directional Index (ADX) [Loxx]Giga Kaleidoscope Average Directional Index (ADX) is a Volatility/Volume module included in Loxx's "Giga Kaleidoscope Modularized Trading System".
█ Giga Kaleidoscope Modularized Trading System
What is Loxx's "Giga Kaleidoscope Modularized Trading System"?
The Giga Kaleidoscope Modularized Trading System is a trading system built on the philosophy of the NNFX (No Nonsense Forex) algorithmic trading.
What is an NNFX algorithmic trading strategy?
The NNFX algorithm is built on the principles of trend, momentum, and volatility. There are six core components in the NNFX trading algorithm:
1. Volatility - price volatility; e.g., Average True Range, True Range Double, Close-to-Close, etc.
2. Baseline - a moving average to identify price trend
3. Confirmation 1 - a technical indicator used to identify trends.
4. Confirmation 2 - a technical indicator used to identify trends.
5. Continuation - a technical indicator used to identify trends.
6. Volatility/Volume - a technical indicator used to identify volatility/volume breakouts/breakdown.
7. Exit - a technical indicator used to determine when a trend is exhausted.
How does Loxx's GKD (Giga Kaleidoscope Modularized Trading System) implement the NNFX algorithm outlined above?
Loxx's GKD v1.0 system has five types of modules (indicators/strategies). These modules are:
1. GKD-BT - Backtesting module (Volatility, Number 1 in the NNFX algorithm)
2. GKD-B - Baseline module (Baseline and Volatility/Volume, Numbers 1 and 2 in the NNFX algorithm)
3. GKD-C - Confirmation 1/2 and Continuation module (Confirmation 1/2 and Continuation, Numbers 3, 4, and 5 in the NNFX algorithm)
4. GKD-V - Volatility/Volume module (Confirmation 1/2, Number 6 in the NNFX algorithm)
5. GKD-E - Exit module (Exit, Number 7 in the NNFX algorithm)
(additional module types will added in future releases)
Each module interacts with every module by passing data between modules. Data is passed between each module as described below:
GKD-B => GKD-V => GKD-C(1) => GKD-C(2) => GKD-C(Continuation) => GKD-E => GKD-BT
That is, the Baseline indicator passes its data to Volatility/Volume. The Volatility/Volume indicator passes its values to the Confirmation 1 indicator. The Confirmation 1 indicator passes its values to the Confirmation 2 indicator. The Confirmation 2 indicator passes its values to the Continuation indicator. The Continuation indicator passes its values to the Exit indicator, and finally, the Exit indicator passes its values to the Backtest strategy.
This chaining of indicators requires that each module conform to Loxx's GKD protocol, therefore allowing for the testing of every possible combination of technical indicators that make up the six components of the NNFX algorithm.
What does the application of the GKD trading system look like?
Example trading system:
Backtest: Strategy with 1-3 take profits, trailing stop loss, multiple types of PnL volatility, and 2 backtesting styles
Baseline: Leader Exponential Moving Average
Volatility/Volume: Average Directional Index (ADX) as shown on the chart above
Confirmation 1: Double Smoothed Stochastic of Momentum
Confirmation 2: Jurik Turning Point Oscillator
Continuation: Fisher Transform
Exit: Rex Oscillator
Each GKD indicator is denoted with a module identifier of either: GKD-BT, GKD-B, GKD-C, GKD-V, or GKD-E. This allows traders to understand to which module each indicator belongs and where each indicator fits into the GKD protocol chain.
Giga Kaleidoscope Modularized Trading System Signals (based on the NNFX algorithm)
Standard Entry
1. GKD-C Confirmation 1 Signal
2. GKD-B Baseline agrees
3. Price is within a range of 0.2x Volatility and 1.0x Volatility of the Goldie Locks Mean
4. GKD-C Confirmation 2 agrees
5. GKD-V Volatility/Volume agrees
Baseline Entry
1. GKD-B Baseline signal
2. GKD-C Confirmation 1 agrees
3. Price is within a range of 0.2x Volatility and 1.0x Volatility of the Goldie Locks Mean
4. GKD-C Confirmation 2 agrees
5. GKD-V Volatility/Volume agrees
6. GKD-C Confirmation 1 signal was less than 7 candles prior
Continuation Entry
1. Standard Entry, Baseline Entry, or Pullback; entry triggered previously
2. GKD-B Baseline hasn't crossed since entry signal trigger
3. GKD-C Confirmation Continuation Indicator signals
4. GKD-C Confirmation 1 agrees
5. GKD-B Baseline agrees
6. GKD-C Confirmation 2 agrees
1-Candle Rule Standard Entry
1. GKD-C Confirmation 1 signal
2. GKD-B Baseline agrees
3. Price is within a range of 0.2x Volatility and 1.0x Volatility of the Goldie Locks Mean
Next Candle:
1. Price retraced (Long: close < close or Short: close > close )
2. GKD-B Baseline agrees
3. GKD-C Confirmation 1 agrees
4. GKD-C Confirmation 2 agrees
5. GKD-V Volatility/Volume agrees
1-Candle Rule Baseline Entry
1. GKD-B Baseline signal
2. GKD-C Confirmation 1 agrees
3. Price is within a range of 0.2x Volatility and 1.0x Volatility of the Goldie Locks Mean
4. GKD-C Confirmation 1 signal was less than 7 candles prior
Next Candle:
1. Price retraced (Long: close < close or Short: close > close )
2. GKD-B Baseline agrees
3. GKD-C Confirmation 1 agrees
4. GKD-C Confirmation 2 agrees
5. GKD-V Volatility/Volume Agrees
PullBack Entry
1. GKD-B Baseline signal
2. GKD-C Confirmation 1 agrees
3. Price is beyond 1.0x Volatility of Baseline
Next Candle:
1. Price is within a range of 0.2x Volatility and 1.0x Volatility of the Goldie Locks Mean
3. GKD-C Confirmation 1 agrees
4. GKD-C Confirmation 2 agrees
5. GKD-V Volatility/Volume Agrees
█ Average Directional Index (ADX)
What is Average Directional Index (ADX)
Trading in the direction of a strong trend reduces risk and increases profit potential. The average directional index (ADX) is used to determine when the price is trending strongly. In many cases, it is the ultimate trend indicator. After all, the trend may be your friend, but it sure helps to know who your friends are.
ADX is used to quantify trend strength. ADX calculations are based on a moving average of price range expansion over a given period of time. The default setting is 14 bars, although other time periods can be used. ADX can be used on any trading vehicle such as stocks, mutual funds, exchange-traded funds and futures.
ADX is plotted as a single line with values ranging from a low of zero to a high of 100. ADX is non-directional; it registers trend strength whether price is trending up or down. The indicator is usually plotted in the same window as the two directional movement indicator (DMI) lines, but for our purposes here, we are only concerned with the ADX itself.
Signals
Traditional: ADX is above the threshold cutoff; both longs/shorts triggered when ADX is above the threshold cutoff
Crossing: ADX crosses above/below the threshold cutoff; longs or shorts are only valid on the candle where the cross happens. Both cross-ups and cross-downs are valid for both shorts and longs
Signal Modifiers
X-Bar Rule: If signals occur within XX bars, then the signal is still valid
Bars Rising: This is for traditional signals only. This requires that an upward slop of ADX be present over XX bars
Other things to note
The GKD trading system requires that a GKD-V indicator be present in the indicator chain, but the GKD-V indicator doesn't need to be active. You can turn on/off the Volatility Ratio as you wish so you can backtest your trading strategy with the filter on or off.
Additional features will be added in future releases.
This indicator is only available to ALGX Trading VIP group members . You can see the Author's Instructions below to get more information on how to get access.
Range Opening (ADX)▶ OVERVIEW
Range Opening (ADX) dynamically detects market opening ranges triggered by ADX (Average Directional Index) momentum shifts. Upon a user-defined ADX crossover or crossunder event, it builds a volume-based range box that tracks high and low prices over a fixed bar length and visualizes order flow pressure with delta volume and breakout buffer zones.
▶ RANGE TRIGGER VIA ADX CROSSOVER
The range begins when ADX crosses a custom threshold, indicating a shift in trend strength:
Users choose between ADX crossover or crossunder as the trigger.
Once triggered, the indicator starts collecting price and volume data for the specified “Range Opening Length.”
The ADX plot on the subchart is colored dynamically using a green-to-magenta gradient based on its strength.
A small label marks the ADX crossover/crossunder event visually.
▶ RANGE DEVELOPMENT BOX
While the range is forming:
Price highs and lows over the defined period are collected and stored.
A temporary gray box is drawn between the maximum high and minimum low, showing the developing range.
At each bar, delta volume is updated:
Positive if close > open
Negative if close < open
A total delta volume value is shown inside the developing box for real-time monitoring.
▶ RANGE COMPLETION & BREAKOUT LINES
Once the range completes (after the defined bar count):
The gray box is replaced with a finalized, color-coded range box.
Color Logic:
Green box if delta volume is positive (bullish bias)
Magenta box if delta is negative (bearish bias)
Two solid horizontal lines are drawn:
Top line from the range high
Bottom line from the range low
Two dashed lines are added above and below the range using ATR-based buffers, acting as buffer zones.
These lines extend until a new ADX trigger occurs, helping track future price interaction with the range.
▶ INFO PANEL & STATUS MONITORING
A compact data table appears in the top-right corner, offering quick insight:
ADX: Current value, color-coded to strength.
Threshold: User-defined trigger level.
Range Status:
Shows a green diamond when range is still forming.
Shows a magenta diamond after the range has completed.
Tooltip updates to “Developing” or “Formatted” based on stage.
▶ USAGE
Traders can use Range Opening (ADX) to:
Identify periods of strength expansion and price consolidation using ADX signals.
Track breakout potential and liquidity zones formed during opening-type setups.
Monitor delta volume to gauge buying/selling bias inside short-term ranges.
Use ATR buffer zones for breakout confirmation or fade setups.
Visually mark where the most recent structured range was defined.
▶ CONCLUSION
Range Opening (ADX) offers a systematic method to detect and monitor market ranges triggered by volatility surges. With real-time delta volume insight, persistent breakout levels, and ADX-driven logic, it serves as a versatile tool for both breakout traders and range strategists looking to capitalize on momentum-based setups.

ADX by GTCADX with 6 configurable lines
Average Directional Index (ADX)
Definition
The Average Directional Index (ADX) is a specific indicator used by technical analysts and traders to determine the strength of a trend. The trend can be either bullish or bearish, which is shown by two indicators that often accompany the ADX, the positive directional indicator, commonly known as +DI, and the negative directional indicator, also known as -DI. For this reason, the Average Directional Index is presented with three separate lines, which symbolize each indicator. Each line is used to help evaluate a trade and whether it should be taken long or short, if at all. The ADX indicator on TradingView does not show the +DI and -DI lines by itself, but you can use the Directional Movement Index (DMI) indicator to view all three at the same time.
History
The Average Directional Index was initially designed by Welles Wilder for daily commodity charts, but was later modified so that it could be used in other markets and for various time frames. These modifications allowed the ADX to become what it is today: an indicator for tracking the strength of market trends and analyzing those trends with the help of additional directional indicators.
Calculations
Due to the fact that the Average Directional Index includes multiple lines, the indicator requires a sequence of calculations, which are outlined below.
Start by calculating the +DM, -DM, and True Range (TR) for each period you are analyzing. Please note:
+DM = Current High - Previous High
-DM = Previous Low - Current Low
You can use +DM when Current High - Previous High > Previous Low - Current Low.
Use -DM when Previous Low - Current Low > Current High - Previous High.
The TR is the largest of the following values: Current High - Current Low, Current High - Previous Close, or Current Low - Previous Close.
Go ahead and smooth your +DM, -DM, and TR period averages. Then plug in the -DM and +DM values to calculate the smoothed averages of them.
First xTR = Sum of first x TR readings (x = number of...)
Next xTR value = First xTR - (Previous xTR/14) + Current TR
Next, divide the smoothed +DM value by the smoothed TR value to get your +DI value. Multiply this value by 100.
Divide the smoothed -DM value by the smoothed TR value to get your -DI value. Multiply this value by 100.
The formula for the Directional Movement Index (DX) is +DI minus -DI, then divided by the sum of +DI and -DI (these are all absolute values). Multiply this value by 100.
To get the ADX, you will need to keep calculating the DX values for x periods. Smooth the results over the periods to get your ADX value.
First ADX = the sum of x periods of DX / x
Lastly, ADX = ((Previous ADX * 13) + Current DX) / x
Conclusions and what to look for
The Average Directional Index (ADX), as well as the Negative (-DI) / Positive (+DI) Directional Indicators, are momentum indicators and help investors determine the strength of a trend and the direction of the trend...
The Average Directional Index projects the market price and is clearly seen when prices are rising (when +DI is above -DI), and when prices are falling (when -DI is above +DI). When there are crossovers between the +DI and -DI lines, it can mean potential trading signals as a bearish or bullish market is emerging.
A trend shows the most strength when the Average Directional Index is above 25 (potential buy signal), and a trend is weak or the price is considered trendless if the ADX is below 20, according to the creator of the concept, Wilder. Thought, if the ADX is below 20, it may not be the most suitable time to enter a trade.
If the market presents itself as not following a particular trend, this does not mean that the price is not moving, but it could be making a change or that the direction is not present at that moment.
Limitations
Crossovers between the lines of the indicators can occur quite frequently. In the event that this occurs too frequently, there is most likely to be confusion among traders and the potential for losing money can be high. These moments in question are known as "false signals" and are more frequent when the ADX is calculated below 25.
The Average Directional Index should be combined with other indicators that examine price and with others that can help filter signals and control risk to get the most out of the tool. Like most indicators, it works best when combined with well-functioning data processors and other analytical tools.
Summary
In short, the Average Directional Index
ADX Divergence and Gap Monitor [theUltimator5]ADX Divergence and Gap Monitor is a custom technical analysis tool designed to visualize momentum imbalances and sudden shifts in trend participation using the ADX system. It combines traditional ADX, DI+ and DI− calculations with dynamic filtering and visual highlighting to help identify key moments of directional acceleration or weakening.
🔍 What It Does:
This indicator builds on the Average Directional Index (ADX) system to detect conditions where market trend strength diverges significantly from directional input (DI) activity. It includes two major visual signals:
Highlight Backgrounds
These appear when the indicator detects a “gap” or sudden acceleration in DI values while ADX remains low, suggesting early-stage momentum bursts or signal noise spikes.
The trigger threshold for DI change can be adjusted using the Gap Trigger Level input.
A background highlight is shown when DI+ or DI− increases sharply, either from a low-ADX environment or from a rapid standalone spike.
GAP Markers
Optional yellow label markers display the word "GAP" just below the lowest line (ADX, DI+, or DI−) whenever a gap condition is triggered. These provide a more noticeable visual cue without crowding the chart.
You can enable or disable the markers with the Show GAP Markers toggle.
🧠 Advanced Divergence Detection:
The script also scans for dominant ADX divergence events, where ADX is significantly higher than DI+ or DI−, indicating strong trend force with weak directional participation. When these conditions are met:
Red or green background fills appear depending on whether DI+ or DI− is being overpowered.
These conditions are based on customizable moving averages and DI strength relationships.
⚙️ Key Inputs:
ADX Length: Period for ADX calculation
DI Moving Average: Smoothing length for directional index signals
Gap Trigger Level: Minimum DI change needed to trigger a GAP highlight
Show Highlight Backgrounds: Toggle to display or hide background signals
Show GAP Markers: Toggle to show or hide text-based GAP labels
🧪 Use Cases:
Spot early breakouts or reversals when DI activity spikes while ADX is still low
Identify periods of trend exhaustion or false breakouts using divergence logic
Confirm trade entry points when ADX begins to rise after a GAP event

QZMOM & ADX PRO+The Momentum Squeeze Indicator is a momentum oscillator that indicates how explosively the price will move. Its first known version was called "TTM Squeeze" by John Carter explained in his book "Mastering the Trade" (chapter 11) and popularized in TradingView by a developer named LazyBear.
The black crosses on the center line show that the market has just entered a consolidation. This means low volatility, the market is preparing for an explosive move (up or down). The gray crosses mean the "Squeeze". Carter suggests waiting until the first gray after a black cross and taking a position in the direction of the oscillator. For its part, LazyBear recommends using an additional indicator such as ADX to improve the effectiveness of entry points and position closures.
Oscillator understanding improvements:
During the indicator creation process we were able to better understand the logic of the oscillator and based on that knowledge we implemented improvements.
Oscillator development improvements:
Side panel:
The ADX algorithm was incorporated, which is displayed numerically on the right panel of the indicator, shows the value of ADX and its directionality.
Added an arrow pointer to indicate oscillator directionality.
Two exponential moving averages of 11 and 55 periods have been added to the right panel, this will mark if the trend is bullish or bearish depending on the crossover of the EMAs.
An indicator of the Indicator Squeeze was also included, which marks the periods of price consolidation (OFF) and the periods in which the price should react explosively.
Added a feature that allows automatic color changing of the panels based on the color of the oscillator and the ADX.
o ADX: Dark green (bullish force).
o ADX: Light green (loss of bullish strength).
o ADX: Dark red (bearish force).
o ADX: Light red (loss of bearish strength).
o ADX: Orange (loss of strength, disinterest and low volume).
Signs:
A very famous strategy that we have learned is that of the trading expert Jaime Merino, who by combining the Momentum Squeeze Indicator and a ADX común, logró vincular eficientemente la debilidad del ADX con el inicio de un momentum alcista o bajista. La parametrización de su estrategia se señaló en alertas de compra y venta, que se representan de la siguiente manera:
B (Comprar): se activa cuando un movimiento bajista marcado por el ADX (pendiente negativa) termina y el oscilador toma direccionalidad alcista (impulso alcista).
S (Vender): se activa cuando un movimiento alcista marcado por el ADX (pendiente negativa) termina y el oscilador toma direccionalidad bajista (momentum bajista).
Filter:
To prevent any trader from trading against the trend, a filter was added that limits bearish entry alerts when the trend is up and vice versa, that is, when the EMA 10 is above the EMA 55, it is understood that the trend is up in that time frame, therefore bearish entry alerts will not be triggered. It will be the decision of each trader to activate or deactivate this function.
Alerts:
This is without a doubt the most awaited function for all Latin American traders, (Just kidding), but being aware, I am very proud of the implementation of alerts for each improvement made to this indicator, if you decide to use the Momentum Squeeze Indicator you can automate alerts for the following actions:
Buy and sell alerts.
Alerts to activate the Squeeze to (ON).
Oscillator quadrant change alerts
or bullish momentum.
or bearish momentum.
o Bullish force.
o Bearish force.
Recommendations:
One of the things that became clearer in the development of this indicator is the coloring of the dials, which is why we recommend the use of four colors, one for each oscillator grid.
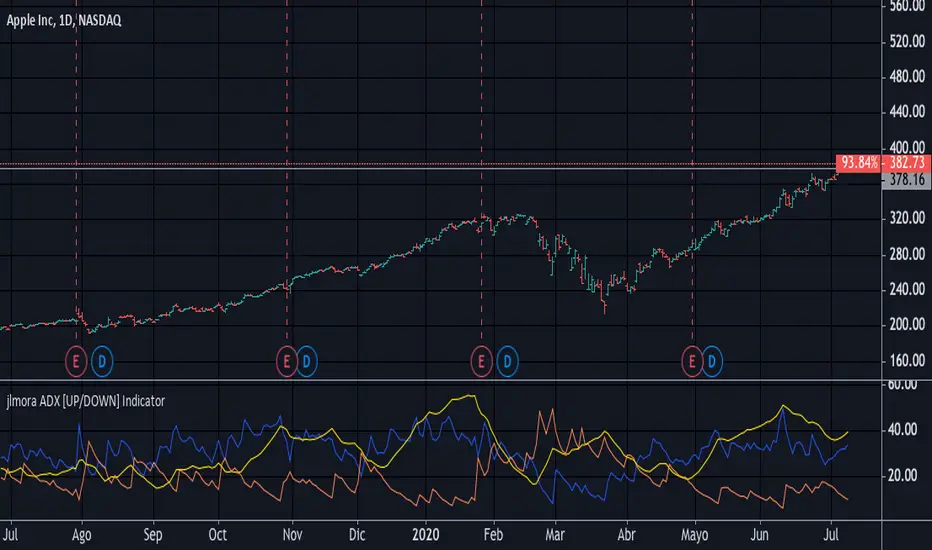
jlmora ADX IndicatorThe ADX also informs us of the prevailing market trend through the positive / negative movement indicators. Being able to determine the existence of a trend in the market and its strength is fundamental, since not all indicators or systems work correctly in different types of markets.
1. Operate only from long positions when the positive directional line is above the negative. Trade only from short positions when the negative directional line is above the positive. The best time to trade is when the ADX is on the rise, showing that the dominant group is strengthening.
2. When the ADX falls, it shows that the market is becoming less discretionary. There are likely to be a few unexpected turns. When the ADX points down, it is preferable not to use trend tracking methods.
3. When the ADX falls below both directional lines, this identifies a flat and sleepy market. Do not use a trend tracking system, but be prepared to trade as major trends emerge from such calm periods.
4. The best individual directional signal is given after the ADX falls below both directional lines. The longer it stays there, the stronger the base of the next move will be. When the ADX rebounds from below both directional lines, it shows that the market is waking up from a calm period. When the ADX grows four or more steps (for example, 9 to 13) from its lowest point below both directional lines, it is "ringing the bell" on a new trend. It shows that a new bull or bear market is emerging, depending on which directional line is above it. When the ADX rebounds above both directional lines, it is identifying an overheated market. When the ADX crosses both directional lines down, it shows that a major trend has entered. It is a good time to collect benefits in a directional operation. If you trade from long positions, you will definitely want to pick up partial gains. Market indicators give strong signals and weak signals. For example, when a moving average changes direction, it is a strong signal. A downward inflection of the ADX is a weak signal. Once you see that the ADX has been turned down, you should be very careful adding to open positions. You should start to collect profits, reduce positions and try to exit.
Triple SWMA + EMA Crossover Color Candle+ ADX Color Candle V2! IMPORTANT !
To better see the color of the bars I suggest you deactivate the Borders option in the chart settings / Symbol, LIKE THIS:
════════════════════════════════════════════════════════════════════════════════════════════════════════════════════
The indicator is the same as the previous version, with the only difference that now the indicator is composed of an addition of secondary candles colored according to the EMA cross, while the main candles based on the ADX, the SWMA are inserted into secondary candles
════════════════════════════════════════════════════════════════════════════════════════════════════════════════════
1) SWMA
There are 3 SWMA , with the possibility of modifying the Source and the length of each one, also each SWMA can be removed or can all of them be removed with the ON / OFF option in Inputs-STYLE. (ALL SWMA?)
════════════════════════════════════════════════════════════════════════════════════════════════════════════════════
2) EMA Fast and Slow, Cross
There are two EMAs, fast and slow, both with the possibility of changing the source and length, in the chart settings it is possible to change the color of EMA Long and EMA Short:
EMA Long = Ema Fast > Ema Slow
EMA Short = Ema Slow > Ema Fast
Ema cross has a style choice option, the possible choices are:
NONE = nothing
ALL = all choices
LINE = ema200 colored based on Ema Long-Short
BAR COLOR = color candles based on Ema Long-Short
PLOTSHAPE = signals based on Ema Long-Short
LINE + BAR COLOR = line + bar color
BAR COLOR + PLOTSHAPE = bar color + plotshape
════════════════════════════════════════════════════════════════════════════════════════════════════════════════════
3) ADX Candle
The candles are colored according to 4 inputs:
Color 1 ( Silver ) = ADX < 20
Color 2 (Black) = ADX cross-ADX Index (adx+adx 14 period back) / 2
Color 3 (Lime) = ADX > 0 and DI delta (DI plus - DI minus) > 0
Color 4 (Red) = ADX > 0 and DI delta (DI plus - DI minus) < 0
all colors are editable and if you don't want to have ADX Candle on the chart, just remove the ON / OFF option in Inputs-STYLE. (BAR COLOR ADX )

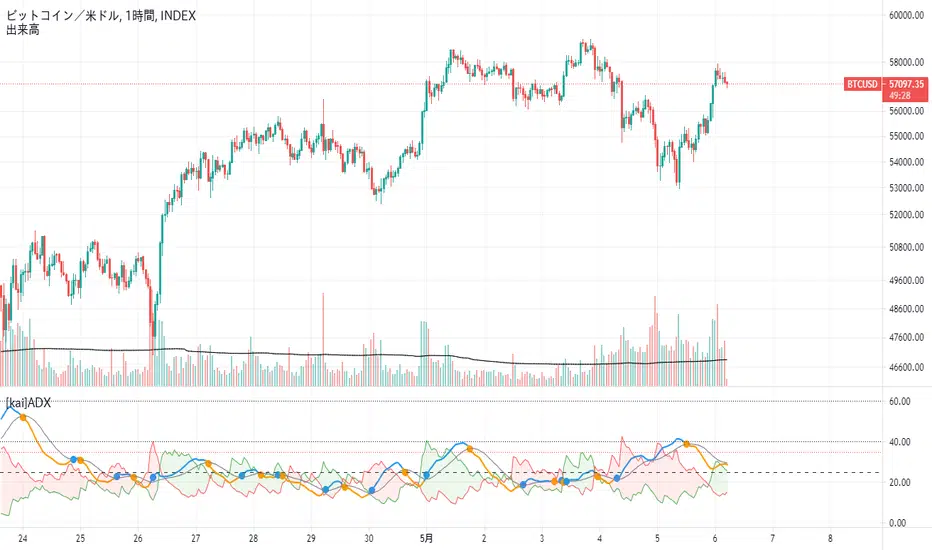
[kai]ADXIt is an indicator that makes it easy to understand the change of ADX by adding a moving average to the famous indicator ADX.
Since ADX and DI have a part where the calculation formula of DI + and DI- is fixed to one bar, there was a problem that it does not make much sense to increase the length.
The biggest feature of this indicator is that it allows you to calculate multiple bars by increasing the multipler option.
For example, by setting multipler = 4 in the 1-hour time frame, it is possible to resemble the calculation result of the 4-hour bar in a multi-time frame.
How to use this Inge is the same as how to use ADX and DI
When ADX (orange) GX (blue circle), take a position in the direction of DI (green zone, red zone),
I think the payment is good when ADX (blue) is DX (orange circle)
when DI +(green), DI-(red) is 35 or more, contrarian is dangerous.
有名なインジケーターのADXに移動平均を付けてADXの変化をわかりやすくしたインジケーターです
ADXとDIはDI+,DI-の計算式がバー一本固定の部分があるので、lengthを増やしてもあまり意味がない問題がありました
このインジではmultiplerオプションを増やすことによって、複数のバーを計算できるようにしたのが最大の特徴になります
例えば1時間足でmultipler=4にすることでかなりマルチタイムフレームの4時間足の計算結果に似せることができます
このインジの使い方は、ADX、DIの使い方と同じです
ADX(オレンジ)がGX(青丸)した時にDI(緑塗り、赤塗り)の方向にポジションを取って、
ADX(青)がDX(オレンジ丸)した時に、決済がよいと思います
DI+(緑),DI-(赤)が35以上の時に逆張りは危険です
Volatility Adjusted ADX (VADX)I sincerely wish to express my heartfelt gratitude to the vast community of coders on TradingView who have previously crafted various Average Directional Index (ADX) scripts. Their innovative approaches have laid a solid foundation, and I'm incredibly grateful for their inspiring work. In essence, their accomplishments have ignited the creative spark that led to the development of the Volatility Adjusted ADX (VADX) script.
VADX is not your run-of-the-mill script. It distinguishes itself from the myriad of ADX indicators on TradingView due to its unique volatility-adjustment mechanism. The primary purpose of this script is to augment the ADX's ability to quantify trend strength by introducing a layer of sensitivity to volatility shifts through the Average True Range (ATR). The interaction between these two crucial market measurements is where the novelty lies.
While the standard ADX does an excellent job of diagnosing the trend's vigor, its evaluation can sometimes be skewed when markets oscillate between periods of high and low volatility. Integrating the ATR – a reliable indicator of market volatility – into the ADX calculation mitigates this limitation, resulting in a more robust, volatility-adjusted trend strength measurement.
The specifics of the mathematical adjustment, our secret ingredient, will remain undisclosed for proprietary reasons. Nevertheless, I assure you that it creates a dynamic and balanced interplay between the trend strength and volatility, enabling a more nuanced understanding of the market.
The VADX script is user-friendly and includes three main inputs: ADX Smoothing, DI Length, and ATR Length. The ADX Smoothing parameter refines the ADX calculation, DI Length determines the period for the Directional Movement System calculation, and the ATR Length sets the period for the Average True Range.
Using this indicator is as easy as pie. After adding it to your chart, VADX will manifest itself as a separate panel beneath your price chart. When the VADX is escalating, it indicates that the strength of the trend is intensifying. Conversely, a declining VADX suggests diminishing trend strength. Two horizontal lines at the 25 and 75 levels provide a simple interpretation guide – they denote weak and strong trend phases, respectively.
This robust indicator is adaptable and can be effectively applied across multiple markets - from stocks, forex, and futures to cryptocurrencies. It also delivers valuable insights on any timeframe. However, as with any new indicator, I highly recommend initial testing and optimization to match your unique trading style and objectives.
To wrap up, the VADX indicator sets itself apart with its novel volatility adjustment, a feature not commonly found in existing TradingView scripts. This distinctive capability affords traders a more comprehensive view of the trend's strength by accounting for market volatility, adding an extra layer of depth to traditional ADX interpretation. I sincerely hope that this script enriches your trading arsenal and assists you in navigating the market with enhanced precision. As always, happy trading!

RiverFlow ADX ScreenerRiverFlow ADX Screener, Scans ADX and Donchian Trend values across various Timeframes. This screener provides support to the Riverflow indicator. Riverflow concept is based on Two indicators. Donchian Channel and ADX or DMI.
How to implement?
1.Donchian Channel with period 20
2. ADX / DMI 14,14 threshold 20
Entry / Exit:
1. Buy/Sell Signal from ADX Crossovers.
2. Trend Confirmation Donchian Channel.
3. Major Trend EMA 200
Buy/Sell:
After a buy/sell is generated by ADX Crossover, Check for Donchian Trend. it has to be in same direction as trend. for FTT trades take 2x limit. for Forex and Stocks take 1:1.5, SL must be placed below recent swing. One can use Riverflow indicator for better results.
ADX Indicator is plotted with
Plus: Green line
Minus: Red Line
ADX strength: plotted as Background area.
TREND: Trend is represented by Green and Red Area around Threshold line
Table:
red indicates down trend
green indicates up trend
grey indicates sideways
Weak ADX levels are treated sideways and a channel is plotted on ADX and PLUS and MINUS lines . NO TRADES are to be TAKEN on within the SIDEWAYS region.
Settings are not required as it purely works on Default settings. However Donchian Length can be changed from settings.
Timeframes below 1Day are screened. Riverflow strategy works on timeframe 5M and above timeframe. so option is not provided for lower timeframes.
Best suits for INTRADAY and LONG TERM Trading

Triple SWMA + EMA Crossover Color Candle+ ADX Color CandleIMPORTANT
The indicator allows you to view the Color Bars only if it is in the foreground, to do this just put the indicator before the description of the symbol, LIKE THIS:
════════════════════════════════════════════════════════════════════════════════════════════════════════════════════════════════
This indicator is composed of:
1) Tiple SWMA
There are 3 SWMA, with the possibility of modifying the Source and the length of each one, also each SWMA can be removed or can all of them be removed with the ON / OFF option in Inputs-STYLE. (ALL SWMA?)
════════════════════════════════════════════════════════════════════════════════════════════════════════════════════════════════
2) EMA Fast and Slow, Cross
There are two EMAs, fast and slow, both with the possibility of changing the source and length, in the chart settings it is possible to change the color of EMA Long and EMA Short
EMA Long = Ema Fast > Ema Slow
EMA Short = Ema Slow > Ema Fast
Ema cross has a style choice option, the possible choices are:
ALL = all choices
LINE = ema200 colored based on Ema Long-Short
BAR COLOR = color candles based on Ema Long-Short
PLOTSHAPE = signals based on Ema Long-Short
LINE + BAR COLOR = line + bar color
BAR COLOR + PLOTSHAPE = bar color + plotshape
if you don't want to have EMA Fast and Slow, Cross on the chart, just remove the ON / OFF option in Inputs-STYLE. (EMA style)
════════════════════════════════════════════════════════════════════════════════════════════════════════════════════════════════
3) ADX Candle
The candles are colored according to 4 inputs:
Color 1 (Silver) = ADX < 20
Color 2 (Black) = ADX cross-ADX Index (adx+adx 14 period back) / 2
Color 3 (Lime) = ADX > 0 and DI delta (DI plus - DI minus) > 0
Colo 4 (Red) = ADX > 0 and DI delta (DI plus - DI minus) < 0
all colors are editable and if you don't want to have ADX Candle on the chart, just remove the ON / OFF option in Inputs-STYLE. (BAR COLOR ADX)
