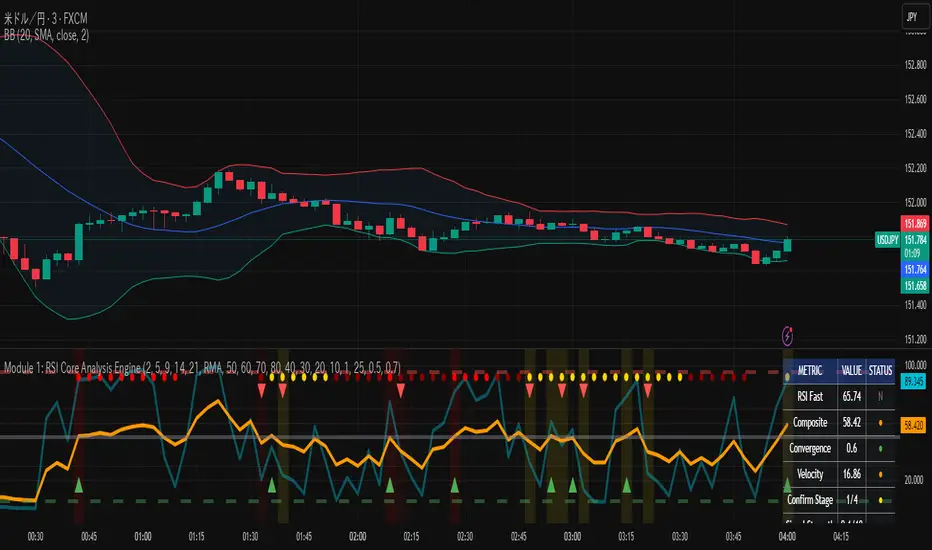
Directional Movement Index color alertThis script is changed from the classic DMI.
I add 4 colors and setup two alerts as well.
- +DI cross up -DI is a long signal
- +DI cross down -DI is a short signal
- ADX keeps increasing means strong trend
- ADX keeps decreasing means swing
Wyszukaj w skryptach "adx"
Multiple Screeners with AlertsI already published few version of my custom screeners. Unfortunately, because of TradingView's security function call limit you can't use more than 40 stocks in 1 screener.
Fortunately, you can compute multiple values in your function and screen few indicators at once.
In this script I show how you can compute 5 indicators at the same time for 40 instruments. I display then in different labels.
Every label consist of list of instruments satisfying current indicator conditions and a value for it. It can be absolute value as for RSI or -1/1 representing Bullish/Bearish event.
Also you can create 1 alert with result of all screeners inside.
In this example I took 5 indicators with following conditions:
RSI - "RSI < 30" or "RSI > 70"
TSI - "TSI < -30" or "RSI >30"
ADX - "ADX > 40"
MACD - "MACD Bullish Cross" or "MACD Bearish Cross" (1 and -1 in screener)
AO - "AO Crosses 0 UP" or "AO Crosses 0 DOWN" (1 and -1 in screener)
Params
- bars_apart - this parameter define how may bars apart you labels are on your chart. If you see labels overlapping, increase this number.
- Parameters for all used indicators
- 40 symbol inputs for instruments you want to use in this screener
Alerts
You can create an alert from it easily by selecting screener name from the list and then selecting "Any alert() function call".
No additional configuration is required, message and alert on close is generated in the code.
You should better change default name for your alert. Sometimes because of big amount of inputs you might receive an error.
Disclaimer
Please remember that past performance may not be indicative of future results.
Due to various factors, including changing market conditions, the strategy may no longer perform as good as in historical backtesting.
This post and the script don’t provide any financial advice.
Bull Call Spread Entry StrategyThis strategy script uses the "Spread Entry Strength" overlay indicator script I designed to show entry timing optimized for an Option Bull
Call Spread.
As for this strategy...
The defaults for the strategy itself are as follows:
Period for strategy: 1/1/18 to 12/1/2021. This can be changed to a different period using the settings.
Condition for entry:
Bull Spread Entry Strength >= "Overlay Signal Strength Level"
Limit entry is used, price must be <= close when signaled
Entry occurs by next day or the order is cancelled
Condition for exit (uses a timed exit):
Bars passed since order entry >= 30 (6 weeks..~42 calendar days)
Thursday (day before "option" expiration date... assuming weekly options exist)
All of the user settings from the overlay are pulled into this for customization purposes. Details of the actual Spread Entry Strength overlay are as follows (copied from my shared indicator):
2 background shadings will occur:
The background will shade blue if the ticker is prime for a Bullish Call spread.
The background will shade purple if the the ticker is prime for a Bearish Put spread.
In theory, if the SE Strength is at one of the extremes of the Bear or Bull side, then a spread is prime for entry.
To calculate this, 8 conditions receive a 1 or zero dependent on whether the condition is true (1) or false (0), and then all of those are summed. The primary gist of the strength comes from Nishant's book, or my interpretation thereof, with some additives that limits what I need to review (such as condition 8 below.)
The 8 Bull Conditions are:
1) Bollinger Bands are outside of the Keltner Channels
2) ADX is trending up
3) RSI is trending up
4) -DI is trending down
5) RSI is under 30
6) Price is below the lower Keltner Channel
7) Price is between the lower Bollinger Band and the Bollinger basis.
8) Price at one point within the last 5 bars was below the lower Bollinger Band
The 8 Bear Conditions are the inverse conditions (except the first):
1) Bollinger Bands are outside of the Keltner Channels
2) ADX is trending down
3) RSI is trending down
4) +DI is trending up
5) RSI is over 70
6) Price is above the upper Keltner Channel
7) Price is between the upper Bollinger Band and the Bollinger basis.
8) Price at one point within the last 5 bars was above the upper Bollinger Band
There is a "market noise" filter that will filter out shading when another market move is considered, i.e. if you don't want to see the potential trade when QQQ moves more than 1% then do the following in the settings:
Check "Market Filter"
Enter QQQ in the "Market Ticker To Use"
Enter 1 in the "Market Too Hot Level"
Press Ok
Obviously, the same holds true for the "Market Too Cool Filter."
Second release notes:
Overlay Signal Strength Level - You can set your own "level" for the overlay in the settings, instead of having to change the script code itself. I have the default set to 6. A lower number shows more overlays, a higher number shows fewer (i.e. more conditions have been met.).
Provide Narrative (Troubleshooting) - Narrative label created with several outputs that will show after the last bar. This narrative needs to be turned on in the settings, as the default is "off" ... unchecked.
Remove Strength Indicator When Squeezed - when checked no overlays will be produced regardless of "scoring." Default is off.
Show Squeezes (Will Override Indicator When Concurrent) - overlays an orange background when the ticker is in a squeeze. I am still working on the accuracy here, but it's usable. This will override the strength indicator as well. This needs to be turned on, if you want it.
Short SMA Period - period used to calculate the short SMA, used in the narrative only, at this point in time.
Medium SMA Period - period used to calculate the medium SMA, used in the narrative only, at this point in time.
Long SMA Period - period used to calculate the medium SMA, used in the narrative only, at this point in time.
Outside of the settings... a few calculation adjustments here and there have occurred and some color shading adjustments to allow for the adjustable level setting.
Spread Entry StrengthThis is an overlay indicator showing a strong potential for entry into an option spread trade.
2 background shadings will occur:
The background will shade blue if the ticker is prime for a Bullish Call spread.
The background will shade purple if the the ticker is prime for a Bearish Put spread.
In theory, if the SE Strength is at one of the extremes of the Bear or Bull side, then a spread is prime for entry.
To calculate this, 8 conditions receive a 1 or zero dependent on whether the condition is true (1) or false (0), and then all of those are summed. The primary gist of the strength comes from Nishant's book, or my interpretation thereof, with some additives that limits what I need to review (such as condition 8 below.)
The 8 Bull Conditions are:
1) Bollinger Bands are outside of the Keltner Channels
2) ADX is trending up
3) RSI is trending up
4) -DI is trending down
5) RSI is under 30
6) Price is below the lower Keltner Channel
7) Price is between the lower Bollinger Band and the Bollinger basis.
8) Price at one point within the last 5 bars was below the lower Bollinger Band
The 8 Bear Conditions are the inverse conditions (except the first):
1) Bollinger Bands are outside of the Keltner Channels
2) ADX is trending down
3) RSI is trending down
4) +DI is trending up
5) RSI is over 70
6) Price is above the upper Keltner Channel
7) Price is between the upper Bollinger Band and the Bollinger basis.
8) Price at one point within the last 5 bars was above the upper Bollinger Band
There is a "market noise" filter that will filter out shading when another market move is considered, i.e. if you don't want to see the potential trade when QQQ moves more than 1% then do the following in the settings:
Check "Market Filter"
Enter QQQ in the "Market Ticker To Use"
Enter 1 in the "Market Too Hot Level"
Press Ok
Obviously, the same holds true for the "Market Too Cool Filter."
Spread Entry Balance of PowerThis is a bar chart showing the strength of a potential option spread entry using 8 conditions for each side of a trade, bull or bear.
In theory, if the SE Strength (Spread Entry Strength) is at one of the extremes of the Bear or Bull side, then a spread is prime for entry.
To calculate this, the 8 conditions receive a 1 or zero dependent on whether the condition is true (1) or false (0), and then all of those are summed. The primary gist of the strength comes from Nishant's book, or my interpretation thereof, with some additives that limits what I need to review (such as condition 8 below.)
The 8 Bull Conditions are:
1) Bollinger Bands are outside of the Keltner Channels
2) ADX is trending up
3) RSI is trending up
4) -DI is trending down
5) RSI is under 30
6) Price is below the lower Keltner Channel
7) Price is between the lower Bollinger Band and the Bollinger basis.
8) Price at one point within the last 5 bars was below the lower Bollinger Band
The 8 Bear Conditions are the inverse conditions (except the first), and the conditions are given a negative disposition (meaning they sum to -8 :)):
1) Bollinger Bands are outside of the Keltner Channels
2) ADX is trending down
3) RSI is trending down
4) +DI is trending up
5) RSI is over 70
6) Price is above the upper Keltner Channel
7) Price is between the upper Bollinger Band and the Bollinger basis.
8) Price at one point within the last 5 bars was above the upper Bollinger Band
MACD+ Strategy [SystemAlpha]This is a strategy based on MACD Oscillator . Instead of using just the normal crossovers, we use trend filters, trailing stop loss and take profit targets. This strategy was developed for crypto, forex and stocks on daily timeframe but feel free to experiment on 15 minutes or higher using heikin ashi or normal candles
In this strategy you have a choice of:
Trend Filters:
- Average Directional Index ( ADX ) – buy when price is trend is up and sell when trend is down.
- Moving Average (MA) – buy when price close above the defined moving average and sell when price close below moving average
- Parabolic SAR – buy when SAR is above price is above price and sell when SAR is below price.
- All - Use ADX , MA and SAR as filters
For MA Filter , you can use the “TF MA Type” and "TF MA Period" parameter to select Simple or Exponential Moving Average and length.
Stop Loss:
- Average True Range (ATR) – ATR % stop as trailing stop loss.
- Parabolic SAR ( SAR ) – Parabolic SAR adapted as trailing stop loss.
For ATR , you can use the “ATR Trailing Stop Multiplier” parameter to set an initial offset for trailing stop loss.
Take Profit Target:
- Average True Range (ATR) – ATR % stop as trailing stop loss.
- Standard % – Percent as target profit
For ATR , you can use the “ATR Take Profit Multiplier” parameter to set an initial offset for trailing stop loss.
Additional feature include:
- Regular and Hidden Divergence display and alerts
STRATEGY ONLY:
- Set back test date range
- Set trade direction - Long, Short or Both
- Use timed exit - Select method and bars
- Method 1: Exit after specified number of bars.
- Method 2: Exit after specified number of bars, ONLY if position is currently profitable.
- Method 3: Exit after specified number of bars, ONLY if position is currently losing.
TradingView Links:
Alerts:
MACD:
How to use:
1. Apply the script by browsing through Indicators --> Invite-Only scripts and select the indicator
2. Once loaded, click the gear (settings) button to select/adjust the parameters based on your preference.
3. Wait for the next BUY or SELL signal to enter the trade!
Disclaimer:
The indicator and signals generated do not constitute investment advice; are provided solely for informational purposes and therefore is not an offer to buy or sell a security; are not warranted to be correct, complete or accurate; and are subject to change without notice.
Bull vs Bear Power by DGTElder-Ray Bear and Bull Power
Dr. Alexander Elder cleverly named his first indicator Elder-Ray because of its function, which is designed to see through the market like an X-ray machine. Developed in 1989, the Elder-Ray indicator can be applied to the chart of any security and helps traders determine the strength of competing groups of bulls and bears by gazing under the surface of the markets for data that may not immediately be ascertainable from a superficial glance at prices
The Elder-Ray indicator is comprised by three elements – Bear Power, Bull Power and a 13-period Exponential Moving Average.
As the high price of any candle shows the maximum power of buyers and the low price of any candle shows the maximum power of sellers, Elder uses the 13-period EMA in order to present the average consensus of price value. Bull power shows whether buyers are capable of pushing prices above the average consensus of value. Bear power shows whether sellers are capable of pushing prices below the average consensus of value. Mathematically, Bull power is the result of subtracting the 13-period EMA from the high price of the day, and Bear power is the result of subtracting the 13-period EMA from the low price of the day.
What does this study implements
Attempts to customize interpretation of Alexander Elder's Elder-Ray Indicator (Bull and Bear Power) by
• adding additional insights to support/confirm Elder’s strategy with different indicators related with the Elder’s concept
• providing different options of visualization of the indicator
• providing smoothing capability
Other Indicators to support/confirm Elder-Ray Indicator:
Colored Directional Movement Index (CDMI) , a custom interpretation of J. Welles Wilder’s Directional Movement Index (DMI) , where :
DMI is a collection of three separate indicators ( ADX , +DI , -DI ) combined into one and measures the trend’s strength as well as its direction
CDMI is a custom interpretation of DMI which presents ( ADX , +DI , -DI ) with a color scale - representing the trend’s strength, color density - representing momentum/slope of the trend’s strength, and triangle up/down shapes - representing the trend’s direction. CDMI provides all the information in a single line with colored triangle shapes plotted on the top. DMI can provide quality information and even trading signals but it is not an easy indicator to master, whereus CDMI simplifies its usage.
Alexander Elder considers the slope of the EMA, which gives insight into the recent trend whether is up or down, and CDMI adds additional insight of verifying/confirming the trend as well as its strength
Note : educational content of how to read CDMI can be found in ideas section named as “Colored Directional Movement Index”
different usages of CDMI can be observed with studies “Candlestick Patterns in Context by DGT", “Ichimoku Colored SuperTrend + Colored DMI by DGT”, “Colored Directional Movement and Bollinger Band's Cloud by DGT”, and “Technical Analyst by DGT”
Price Convergence/Divergence , if we pay attention to mathematical formulations of bull power, bear power and price convergence/divergence (also can be expressed as price distance to its ma) we would clearly observe that price convergence/divergence is in fact the result of how the market performed based on the fact that we assume 13-period EMA is consensus of price value. Then, we may assume that the price convergence/divergence crosses of bull power, or bear power, or sum of bull and bear power could be considered as potential trading signals
Additionally, price convergence/divergence visualizes the belief that prices high above the moving average or low below it are likely to be remedied in the future by a reverse price movement
Alternatively, Least Squares Moving Average of Price Convergence/Divergence (also known as Linear Regression Curve) can be plotted instead of Price Convergence/Divergence which can be considered as a smoothed version of Price Convergence/Divergence
Note : different usages of Price Convergence/Divergence can be observed with studies “Trading Psychology - Fear & Greed Index by DGT”, “Price Distance to its MA by DGT”, “P-MACD by DGT”, where “Price Distance to its MA by DGT” can also be considered as educational content which includes an article of a research carried on the topic
Options of Visualization
Bull and Bear Power plotted as two separate
• histograms
• lines
• bands
Sum of Bull and Bear Power plotted as single
• histogram
• line
• band
Others
Price Convergence/Divergence displayed as Line
CDMI is displayed as single colored line of triangle shapes, where triangle shapes displays direction of the trend (triangle up represents bull and triangle down represent bear), colors of CDMI displays the strength of the trend (green – strong bullish, red – strong bearish, gray – no trend, yellow – week trend)
In general with this study, color densities also have a meaning and aims to displays if the value of the indicator is falling or growing, darker colors displays more intense move comparing to light one
Note : band's upper and lower levels are calculated by using standard deviation build-in function with multiply factor of 0.236 Fibonacci’s ratio (just a number for our case, no any meaning)
Smoothing
No smoothing is applied by default but the capability is added in case Price Convergence/Divergence Line is assumed to be used as a signal line it will be worth smoothing the bear, bull or sum of bear and bull power indicators
Interpreting Elder-Ray Indicator, according to Dr. Alexander Elder
Bull Power should remain positive in normal circumstances, while Bear Power should remain negative in normal circumstances. In case the Bull Power indicator enters into negative territory, this implies that sellers have overcome buyers and control the market. In case the Bear Power indicator enters into positive territory, this indicates that buyers have overcome sellers and control the market. A trader should not go long at times when the Bear Power indicator is positive and he/she should not go short at times when the Bull Power indicator is negative.
13-period EMAs slope can be used in order to identify the direction of the major trend. According to Elder, the most reliable buy signals are generated, when there is a bullish divergence between the Bear Power indicator and the price (Bear Power forms higher lows, while the market forms lower lows). The most reliable sell signals are generated, when there is a bearish divergence between the Bull Power indicator and the price (Bull Power forms lower highs, while the market forms higher highs).
There are four basic conditions, required to go long or short, with the use of the Elder-Ray method alone.
In order to go long:
1. The market is in a bull trend, as indicated by the 13-period EMA
2. Bear Power is in negative territory, but increasing
3. The most recent Bull Power top is higher than its prior top
4. Bear Power is going up from a bullish divergence
The last two conditions are optional that fine-tune the buying decision
In order to go short:
1. The market is in a bear trend, as indicated by the 13-period EMA
2. Bull Power is in positive territory, but falling
3. The most recent Bear Power bottom is lower than its prior bottom
4. Bull Power is falling from a bearish divergence
The last two conditions are optional, they provide a stronger signal for shorting but they are not absolutely essential
If a trader is willing to add to his/her position, he/she needs to:
1. add to his/her long position, when the Bear Power falls below zero and then climbs back into positive territory
2. add to his/her short position, when the Bull Power increases above zero and then drops back into negative territory.
note : terminology of the definitions used herein are as per TV dictionary
Trading success is all about following your trading strategy and the indicators should fit within your trading strategy, and not to be traded upon solely
Disclaimer : The script is for informational and educational purposes only. Use of the script does not constitute professional and/or financial advice. You alone have the sole responsibility of evaluating the script output and risks associated with the use of the script. In exchange for using the script, you agree not to hold dgtrd TradingView user liable for any possible claim for damages arising from any decision you make based on use of the script
ADX_ProFirst Thank you very much "TradingView" for providing such a Wonderful plateform.
Also very thankful to all TradingView's known & unknown authors who provides superb learnings.
Special thanks to "Mr.Bharat Jhunjhunwala" who provides a Superb learnings and Great inspirations always.
ADX_Pro is just an Average Directional Index with default settings as:
ADX length = 8
DMI length = 13
Should Above Band Level = 20
with marked (adjustable with seetings) level from which ADX should be above for our trade set up.
Simple Harmonic Oscillator (SHO)The indicator is based on Akram El Sherbini's article "Time Cycle Oscillators" published in IFTA journal 2018 (pages 78-80) (www.ftaa.org.hk)
The SHO is a bounded oscillator for the simple harmonic index that calculates the period of the market’s cycle. The oscillator is used for short and intermediate terms and moves within a range of -100 to 100 percent. The SHO has overbought and oversold levels at +40 and -40, respectively. At extreme periods, the oscillator may reach the levels of +60 and -60. The zero level demonstrates an equilibrium between the periods of bulls and bears. The SHO oscillates between +40 and -40. The crossover at those levels creates buy and sell signals. In an uptrend, the SHO fluctuates between 0 and +40 where the bulls are controlling the market. On the contrary, the SHO fluctuates between 0 and -40 during downtrends where the bears control the market. Reaching the extreme level -60 in an uptrend is a sign of weakness. Mostly, the oscillator will retrace from its centerline rather than the upper boundary +40. On the other hand, reaching +60 in a downtrend is a sign of strength and the oscillator will not be able to reach its lower boundary -40.
Centerline Crossover Tactic
This tactic is tested during uptrends. The buy signals are generated when the WPO/SHI cross their centerlines to the upside. The sell signals are generated when the WPO/SHI cross down their centerlines. To define the uptrend in the system, stocks closing above their 50-day EMA are considered while the ADX is above 18.
Uptrend Tactic
During uptrends, the bulls control the markets, and the oscillators will move above their centerline with an increase in the period of cycles. The lower boundaries and equilibrium line crossovers generate buy signals, while crossing the upper boundaries will generate sell signals. The “Re-entry” and “Exit at weakness” tactics are combined with the uptrend tactic. Consequently, we will have three buy signals and two sell signals.
Sideways Tactic
During sideways, the oscillators fluctuate between their upper and lower boundaries. Crossing the lower boundary to the upside will generate a buy signal. On the other hand, crossing the upper boundary to the downside will generate a sell signal. When the bears take control, the oscillators will cross down the lower boundaries, triggering exit signals. Therefore, this tactic will consist of one buy signal and two sell signals. The sideway tactic is defined when stocks close above their 50-day EMA and the ADX is below 18
Bull Club BiasThe script intends to eliminate noise from the chart. It uses a combination of multiple indicators into 1.
For long bias:
Close is greater than the ADX
15 Period EMA on close is greater than SMA on high
13 period RSI is greater than 25 periods RSI
MACD is greater than 0
For short bias:
Close is lower than the ADX
15 Period EMA on close is lower than SMA on high
13 period RSI is lower than 25 periods RSI
MACD is lower than 0
For every other combination, it is a range-bound bias. NSE:BANKNIFTY
A green background indicates long bias
A Red background indicates short bias
An Orange background indicates range-bound bias
Strategija 3This one is the combination of BBsqueeze, ADX and EMA's.
On Weekly TF we wait for the BBsqueeze signal to fire. We also check if the ADX is above 20 so we know that we are in a trend. If in a window of less than 10 weekly bars (default setting) we gewt a pullback to the active 21 EMA and the bounce is significant, we get the entry arrow. Conversely for shorts.
Please use it, edit and comment if you like (or dislike) it.
Stay safe
Directional Movement Index + Average Directional IndexPersonal DMI and ADX script
ADX color change from positive vs negative momentum
DMI Color fill based on DMI+/- positive momentum
No fill color during lack of momentum
Apirine Slow Candlestick RSI [ChuckBanger]This is just a candle stick version of Apirine Slow RSI. The yellow line is Apirine Slow RSI with the option to set an offset to it to filter out nice. RSI oscillating between 0 and 100. And whats good with Apirine version is it generates both OB/OS signals and midline (50) cross over signals and divergences. As author suggests, bullish/bearish divergences generated by the indicator are not as effective during strong trends. To avoid fading an established trend, the system is used in conjunction with a trend confirmation tool like ADX indicator.
The script spits out red and green diamonds as a potential long and short signals when the yellow line crosses close of the RSI candles. And combine it with trend confirmation tool like ADX, and if you apply it correctly. You have a very robust trading system. Good luck traders
DAX Shooter 5M StrategyThis is a simple strategy that applies very well for scaling indices to 5 minutes especially for the DAX. The algorithm provides for buying or selling when the market is very "pulled". The rules are as follows:
you buy when:
1- The ADX indicator with the standard settings is greater than 32.
2- the RSI indicator set to 7 periods is crossing upwards the oversold line at 30
3- the candle minimum is lower than the lower band of bollinger bands set to 50 periods.
is sold when:
1- ADX indicator with standard settings is greater than 32.
2 - the RSI indicator set to 7 periods is crossing downwards the overbought line at 70
3- the maximum of the candle is higher than the upper band of the bollinger bands set to 50 periods.
Money management is at the discretion of the trader but usually it is better to set a fixed stop loss and a take profit on reaching the opposite bollinger band.
Enjoy trading at all!
90009If( MDI(14)>40 AND ADX(14)>40 AND PDI(14)<15 AND RSI(14)<30,1,0)
;If( MDI(14)<15 AND ADX(14)<15 AND PDI(14)>40 AND RSI(14)>70,-1,0)
Pro Volume & Momentum Dashboard [CONFIRMED ENTRY v2.1]🎯 Key Upgrades in This Version:
1. 10-Point Confluence Scoring System
# Factor Description
1 Volume Spike RVOL ≥ threshold with directional candle
2 Volume Delta Buy vs Sell pressure analysis
3 VWAP Position Institutional fair value
4 200 EMA Macro trend alignment
5 EMA Stack 9 > 21 > 50 alignment
6 ADX Trend strength + direction
7 RSI Momentum confirmation
8 MACD Histogram momentum
9 HTF Trend Higher timeframe alignment
10 Candle Quality Strong body, minimal wicks
2. Confirmed Entry Logic
✅ Requires minimum 7/10 confluence score (adjustable)
✅ Waits for candle close to avoid fakeouts
✅ 5-bar cooldown prevents duplicate signals
✅ Potential setups warned when score is 5-6/10
3. Risk Management
Auto-calculated Stop Loss (ATR-based)
Two Take Profit levels (TP1 & TP2)
Visual risk zones on chart
Risk/Reward ratio displayed
4. Higher Timeframe Confirmation
Checks 1H (or custom) timeframe trend
Ensures trade aligns with bigger picture
📌 How to Use:
Wait for ◆ CONFIRMED BUY/SELL label (not triangles)
Check dashboard for 7+/10 score
Entry: On signal candle close
Stop Loss: Red line below/above
Take Profit: Green lines (scale out at TP1, full exit TP2)
🕯️ Candlestick Patterns Added
Bullish Patterns (11 Total)
Pattern Description Strength
Bullish Engulfing Green candle engulfs prior red ⭐⭐⭐ Strong
Hammer Long lower wick at bottom ⭐⭐ Medium
Morning Star 3-candle reversal pattern ⭐⭐⭐ Strong
Bullish Harami Small green inside large red ⭐⭐ Medium
Piercing Line Opens gap down, closes above mid ⭐⭐ Medium
Three White Soldiers 3 consecutive strong green candles ⭐⭐⭐ Strong
Dragonfly Doji Long lower wick, no body ⭐⭐ Medium
Tweezer Bottom Equal lows at support ⭐⭐ Medium
Bullish Marubozu Full body, no wicks ⭐⭐⭐ Strong
Rising Three Continuation after pullback ⭐⭐ Medium
Bearish Patterns (11 Total)
Pattern Description Strength
Bearish Engulfing Red candle engulfs prior green ⭐⭐⭐ Strong
Shooting Star Long upper wick at top ⭐⭐ Medium
Evening Star 3-candle reversal pattern ⭐⭐⭐ Strong
Bearish Harami Small red inside large green ⭐⭐ Medium
Dark Cloud Cover Opens gap up, closes below mid ⭐⭐ Medium
Three Black Crows 3 consecutive strong red candles ⭐⭐⭐ Strong
Gravestone Doji Long upper wick, no body ⭐⭐ Medium
Tweezer Top Equal highs at resistance ⭐⭐ Medium
Bearish Marubozu Full body, no wicks ⭐⭐⭐ Strong
Falling Three Continuation after pullback ⭐⭐ Medium
Hanging Man Long lower wick at top ⭐⭐ Medium
Institutional Flow DetectorOverview
InstFlow 1S Delta identifies institutional order flow by analyzing volume anomalies and directional bias using 1-second sub-bar data. The indicator detects when large players are likely entering or exiting positions, providing actionable trade recommendations with confidence scoring.
Unlike traditional volume indicators that only show total volume, InstFlow breaks down each bar into 1-second micro-bars, classifies buying vs selling pressure, and identifies statistically significant volume events that likely represent institutional activity.
How It Works
1-Second Delta Analysis
The indicator fetches all 1-second bars within each candle and classifies each micro-bar as buying (close ≥ open) or selling (close < open). This achieves ~85-90% directional accuracy compared to ~55-65% from traditional bar-based methods.
Delta = Buy Volume - Sell Volume
Delta Ratio = |Delta| / Total Volume
Volume Anomaly Detection (Z-Score)
Volume is compared to a rolling 20-bar average using statistical z-scores:
- T1: Z-Score ≥ 1.5 (top ~7% of volume bars)
- T2: Z-Score ≥ 2.0 (top ~2% of volume bars)
- T3: Z-Score ≥ 3.0 (top ~0.1% of volume bars)
Signal Types
- Big Trades (T1/T2/T3) : Unusual volume with clear directional bias
- Absorption (ABS) : High volume + small price move + delta imbalance = hidden liquidity absorbing orders
- Exhaustion (EXH) : Capitulation pattern - big flush followed by immediate reversal with opposing delta
- Divergence (DIV) : Price and cumulative delta disagreeing over 5 bars
ACTION Recommendation System
Synthesizes all signals into a single trade direction (LONG/SHORT/WAIT) with confidence scoring (1-10):
- Exhaustion signals: +5 points (strongest reversal)
- Counter-trend absorption: +4 points
- Volume tier: +1 to +3 points
- Divergence confirmation: +2 points
- Strong trend (ADX>30): +1 point
- High delta imbalance (>50%): +1 point
Features
Real-time 1-second delta classification for accurate buy/sell detection
Statistical volume anomaly detection adapts to each instrument
Absorption detection finds hidden liquidity/iceberg orders
Exhaustion patterns catch capitulation reversals
Delta divergence warns of weakening moves
ACTION + Confidence system provides clear trade recommendations
Price-locked markers stay fixed at detection level (don't float)
Info table displays all metrics in real-time
RTH session filtering
Comprehensive alert conditions
Settings Guide
Detection Settings
Volume Lookback (20): Bars for calculating average volume and standard deviation
T1/T2/T3 Thresholds : Z-score thresholds for volume tiers. Lower = more signals.
1-Second Delta
Delta Resolution (1S): Use 1S for ES/NQ. Try 5S if 1S unavailable.
Min Delta Imbalance (10%): Minimum ratio to classify direction.
Absorption Detection
Min Volume Multiple (1.2x): Volume must exceed average by this multiple
Max Price Move Multiple (0.5x): Price move must be less than this × average range
Delta Imbalance Threshold (20%): Minimum delta ratio for absorption
Exhaustion Detection
Minimum Tier for Flush (T1): Required volume tier for the flush bar
New High/Low Lookback (10): Bars to check for price extremes
Min Reversal Size (0.3x ATR): Required body size for reversal bar
Divergence Detection
Divergence Lookback (5): Bars to compare price vs cumulative delta
Delta Trend Threshold (0.4): Sensitivity for divergence detection
How to Use
Add to ES, NQ, MES, or MNQ chart (1-5 minute timeframe)
Check 1S Data quality in table (green = 30+ bars = reliable)
Monitor ACTION field for trade direction
Use Confidence score for position sizing: HIGH (7+) = full size, GOOD (5-6) = standard, MED (3-4) = reduced
EXH signals are highest priority reversals
ABS + DIV combination is strong reversal confirmation
T2/T3 with trend are continuation signals
Avoid counter-trend T1/T2 without EXH/ABS/DIV confirmation
Visual Guide
Green circles below bar = Buy pressure (T1 small, T2 medium, T3 large)
Red circles above bar = Sell pressure (T1 small, T2 medium, T3 large)
Purple diamond + "ABS" = Absorption detected
Cyan label + "EXH" = Exhaustion pattern
Orange triangle + "DIV" = Delta divergence
Yellow background = Counter-trend warning
Best Practices
Trade during RTH (9:30am - 4:00pm ET) for most reliable signals
Wait for HIGH or GOOD confidence before full position
Use EXH as primary reversal trigger
Check cumulative delta supports trade direction
Combine with price action and support/resistance levels
Limitations
Requires 1-second data availability (ES, NQ, MES, MNQ have this)
ETH signals less reliable due to lower volume
EMA-based trend lags on sharp reversals
Not suitable for stocks without adjusting parameters significantly
Absorption/Exhaustion patterns may not occur every session
Disclaimer
This indicator is for educational and informational purposes only. It does not constitute financial advice.
Past performance does not guarantee future results
The indicator shows where institutional activity is LIKELY - it does not predict the future
Always conduct your own research and analysis
Never risk more than you can afford to lose
Paper trade any new strategy before using real capital
Smart Signal Assistant (Kewme)Smart Signal Assistant (Kewme) – Professional Trading Suite
Overview The Smart Signal Assistant (Kewme) is a comprehensive, all-in-one trading toolkit designed to bring institutional-grade discipline and visual clarity to your trading. Unlike clutter-heavy indicators, this system focuses on precision and risk management. It combines a powerful trend-following engine with an automated trade manager that visualizes your risk and reward in real-time.
Key Features
1. 🛡️ Disciplined Trade Management (One Trade at a Time) Stop over-trading with the built-in "Focus Mode."
No Signal Spam: The system will never generate a new signal while a trade is currently running.
Active Management: A new signal is only generated after the current trade has either hit the Take Profit (TP) or the Stop Loss (SL). This enforces strict trading discipline.
2. 📦 Dynamic Risk/Reward Boxes Visualizing your trade has never been easier.
Instant Zones: Upon a signal, the script automatically draws a Green Profit Zone and a Red Loss Zone directly on the chart.
ATR-Based Precision: Stop Loss levels are calculated dynamically using Average True Range (ATR), ensuring your stops breathe with market volatility.
Auto-Cutoff: The boxes automatically stop drawing the moment price hits your TP or SL, keeping your chart clean and historical performance visible.
3. 🎯 Clear Exit Labels No more guessing. The script clearly marks the exact candle where your trade closed:
TP Hit 🎯: Appears when your target is reached.
SL Hit ❌: Appears if the market goes against you.
4. 🚀 Smart Trend Engine & Filters
Hybrid Modes: Choose between "Swing" (for reliable, long-term trends) or "Scalping" (for quick, short-term moves).
Trend-Range Classifier (TRC): An intelligent filter system that monitors ADX and market volatility. It automatically blocks signals during choppy, sideways markets to protect your capital.
5. 📊 Live Status Dashboard A sleek, on-chart dashboard provides real-time data at a glance:
Trade Status: Shows if a trade is "RUNNING" or "SEARCHING."
Market Bias: Bullish or Bearish.
Trend Strength: Indicates if the market is Strong or Sideways.
How to Use
Select Mode: Choose 'Swing' for higher timeframes or 'Scalping' for lower timeframes in settings.
Adjust Risk: Set your preferred Risk/Reward Ratio (e.g., 1:2) and SL Multiplier.
Follow the Boxes: Enter when the box appears, and exit exactly when the "TP Hit" or "SL Hit" label pops up.
Disclaimer: This tool is for educational and assistance purposes only. Always use proper risk management.
Neeson Crypto Cycle - Super Enhanced EditionThe "Neeson Crypto Cycle - Super Enhanced Edition": A Philosophical and Practical Framework for Market Analysis
Originality & Core Philosophy
Most trading indicators focus on a single domain: pure price action, a specific economic theory, or a handful of technical oscillators. The "Neeson Crypto Cycle" breaks this paradigm. Its fundamental originality lies not in inventing one new mathematical formula, but in architecting a multi-dimensional, multi-timeframe convergence framework. It operates on a core philosophical premise: financial markets are Complex Adaptive Systems (CAS) influenced by a symphony of concurrent cycles. These cycles range from mathematical and technical ones visible on the chart, to fundamental economic rhythms, down to collective human psychology and even speculative meta-patterns.
The script is built as a "dashboard of dashboards," attempting to quantify and visualize these disparate layers on a single pane. It does not claim predictive certainty but aims to provide a holistic situational awareness, allowing the trader to identify when multiple, unrelated cycles from different domains align (convergence) or conflict (divergence).
What It Does & How It Achieves It
The indicator functions as a comprehensive market-phase and sentiment analysis engine implemented directly on the TradingView chart. It is an overlay indicator that provides visual plots, background coloring, signal labels, and, most notably, extensive multi-table data panels.
Its implementation can be broken down into several operational layers:
1. The Core Technical Cycle Layer:
This is the foundational price-based engine. It simultaneously tracks multiple proprietary cyclical models derived from moving average crossovers with non-standard periods believed to capture crypto-specific rhythms.
CCT Pi Cycle: Uses the interaction between a 150-period EMA / 471-period SMA pair (for "bottom" identification) and a 111-period SMA / (350-period SMA * 2) pair (for "top" identification). It identifies golden/death crosses within these specific pairs.
Atlantean Signals: A variant using similar periods (471, 150, 350, 111) but with different multipliers (e.g., 0.745) and crossover logic to define "Market Bottom," "Bull Market Start," and "Market Top" events.
Bitcoin Cycle: Based on the interaction between a 116-period SMA and a doubled 365-period SMA.
Golden Pi Cycle: Another variant using SMAs of 111, 350, 150, and 471 periods.
These are not just four random moving average systems; they are distinct models targeting different aspects of the purported "Pi-based" and long-term cyclicality in Bitcoin's price history. The script visually plots these lines and labels their crossover events.
2. The Market Phase & Structural Context Layer:
Background Coloring: It dynamically colors the chart background (blue for "Bottom to Top" phase, orange for "Top to Bottom" phase) based on the sequential logic of Atlantean signals, providing immediate visual context for the perceived market regime.
Halving Event Annotations: It marks key historical and projected Bitcoin halving dates with vertical lines and labels, anchoring price action to this fundamental supply schedule.
3. The Quantitative Dashboard Layer (Technical & On-Chain):
This is where the script transitions from chart plotting to an information system. It renders multiple fixed tables on the chart (bottom-left, bottom-center, bottom-right) only on the last bar.
Technical Sentiment Dashboard (Right): A massive table aggregating over a dozen classic and advanced technical indicators (RSI, MACD, Bollinger Bands, Stochastic, ADX, Ichimoku, Parabolic SAR, Fibonacci levels, etc.). For each, it shows a calculated Status (e.g., "Overbought"), a numeric Value, and a concise Advice (e.g., "Sell"). It then groups these into "Cycle Indicators" (status of the core models above) and "Risk Management" metrics (Max Drawdown, Sharpe Ratio simulation, volatility).
Synthetic On-Chain Metrics Dashboard (Center): Since TradingView cannot pull real on-chain data, the script ingeniously simulates 80 different on-chain metrics (NVT, MVRV, Hash Rate, Exchange Flows, HODL Waves, S2F, etc.) by deriving them from price and volume data. Each metric displays a name, a simulated value, a signal ("Overvalued"), and a color code. This provides a proxy for the fundamental/network health narrative.
Multi-Cycle Systems Dashboard (Left): This table transcends traditional finance, cataloging the status of various long-wave cycles:
Economic Cycles: Kondratieff (50-60yr), Kuznets (15-25yr), Juglar (7-11yr), Kitchin (3-5yr), etc., each with a hardcoded current phase (e.g., "Recession (2020-2030)"), impact, and advice.
Speculative & Novel Cycles: Lunar, Seasonal, Commodity Super, Debt, and Innovation cycles.
Esoteric Systems: A full celestial (astrological) positioning of planets and a Four Pillars of Destiny (Bazi) reading, each with assigned market "impact" and "advice."
4. The Synthesis & Alert Layer:
Comprehensive Statistics: The right dashboard concludes with a tally of "Bullish vs. Bearish Signals" from across all technical and cycle indicators, generating an "Overall Sentiment" score.
Alert System: It creates TradingView alert conditions for every major crossover event from the core cycle models (CCT, Atlantean, Bitcoin, Golden Pi), allowing for automated notifications.
Underlying Calculation Logic & Rationale
The logic is built on convergence and weighted evidence. The creator's hypothesis appears to be that significant market turning points are rarely signaled by one indicator in isolation. Instead, they occur when:
Multiple Price-Based Cycle Models Align: When the CCT, Atlantean, and Bitcoin cycles all approach a "bottom" or "top" signal near the same time, the probability of a true phase change is considered higher.
Technical Conditions Match the Cycle Phase: A "Bull Market Start" signal is more credible if accompanied by oversold RSI/Stochastic, bullish MACD, and money flowing in (rising OBV).
The Macro Backdrop Supports the Narrative: The script hardcodes a specific macroeconomic worldview (e.g., "Tightening Credit Cycle," "AI Revolution Tech Cycle") to remind the user of the broader environment the price cycles are operating within.
Awareness of "Non-Rational" Drivers: By including astrological and Bazi elements, the script acknowledges that market narratives and crowd psychology can sometimes be influenced by or framed within these non-traditional systems. It doesn't necessarily predict with them but tracks them as potential sentiment catalysts.
The calculations for technical indicators are standard. The novelty is in their collective presentation and the synthetic creation of supporting data realms (on-chain, economic, esoteric) to form a complete, albeit highly speculative, "universe" of market-influencing factors.
How to Use It: A Practical Guide
This is not a "set and forget" system that generates simple buy/sell arrows. It is a decision-support and research tool.
Market Phase Identification: First, look at the background color and the status of the core cycle models in the right dashboard. Are you in a blue "Bottom to Top" phase? Check if the Atlantean "Bull Market Start" is active. This sets your primary bias.
Seeking Convergent Signals: Before acting on a cycle signal, cross-reference it with the Technical Sentiment dashboard. For example, an Atlantean "Market Top" signal is stronger if the RSI and Stochastic also show "Overbought," the MACD is "Bearish," and the Fear & Greed Index is in "Extreme Greed." Look for clusters of agreement.
Context from Other Dimensions: Check the On-Chain dashboard. Does the synthetic data suggest the network is "Overheated" or "Undervalued"? Check the Economic Cycle table. Does the perceived long-wave phase (e.g., "Kondratieff Recession") support a risk-on or risk-off stance? This provides narrative context for your trade thesis.
Risk Management Integration: Before sizing a position, check the Risk Management section. What is the current "Max Drawdown" and "Volatility Risk"? The dashboard suggests position sizing ("Light," "Medium," "Heavy") based on this.
Utilizing Alerts: Set alerts for the key cycle crossovers (CCT, Atlantean, etc.). When an alert triggers, it's your cue to open the chart and perform the full multi-dimensional convergence analysis described above, rather than acting on the alert alone.
In essence, the "Neeson Crypto Cycle" is a conceptual trading terminal. It posits that the modern trader, especially in crypto, must synthesize information from technicals, fundamentals, macroeconomics, and market psychology. By attempting to model all these facets in one place—even through estimation and simulation—it aims to give the user a structured framework for asking the right questions about the current state of the market, rather than providing simplistic, one-dimensional answers. Its value is in the breadth of its perspective and the discipline of multi-factor confirmation it encourages.
(5M) REG SuperTrend Pullback SystemThis indicator implements a rule-based SuperTrend pullback system
designed for short-term trend continuation.
Core features:
• Regression-based SuperTrend with flip detection
• Pullback + reclaim entry logic (non-repainting, bar-close confirmed)
• Regime filter (Trend vs Range suppression)
• Exhaustion detection to avoid late entries
• ADX + EMA bias alignment
• USDT Dominance risk filter (risk-on / risk-off)
• Clear BUY / SELL and Pullback AI-style entry labels
This is NOT a trading bot and does NOT place orders.
All signals are for analytical and educational purposes only.
Dynamic Zone TraderDynamic Zone Trader - MACD-based trading system with adaptive stop loss and take profit zones.
This indicator generates buy/sell signals from MACD histogram crossovers and automatically adjusts position sizing based on market conditions.
Key Features:
Detects breakout trades and expands targets to capture larger moves
Identifies choppy/ranging conditions and tightens stops to reduce risk
Shows supply and demand zones based on pivot highs/lows
Displays three take profit levels (TP1, TP2, TP3) that scale with trade quality
Entry signals filtered by 50 EMA to trade with the trend
Signal strength score displayed on each entry marker
How It Works:
The indicator analyzes recent price structure and movement to classify each trade:
Breakout trades (breaking recent highs/lows) get 1.6x larger zones
Normal trades get standard 1.0x sizing
Choppy weak signals get 0.75x smaller zones
This allows you to take bigger positions on high-conviction setups while limiting risk during low-quality trades.
Settings:
MACD parameters (default 8/21/5)
Base stop loss: 60 ticks
Base take profit: 80 ticks
EMA filter: 50 period
Optional ADX trend filter
Adjustable breakout detection sensitivity
Works on any timeframe and instrument, but optimized for index futures like NQ/MNQ.
Absorption Pro V4This indicator detects absorption-style reversal setups and scores them with a multi-factor model.
It builds key levels from ZigZag/Fibonacci and round numbers across multiple timeframes, then flags potential absorption candles using volume and a delta-proxy filter plus strict candle-structure rules. Signals are validated with trend context (MA/SMMA/EMA/ATR), VWAP positioning, and optional momentum/volatility filters (RSI, Stoch, CCI, MACD, ADX, Volume Profile). Only score-threshold crosses can trigger long/short markers and alerts (defaults tuned for NQ).


