Trend with ADX, multiple EMAs - Buy & Sell✔ Trend Direction
Via DI+ > DI–
✔ Trend Strength
Via ADX
✔ Fast Entry Signals
5/8 EMA crossovers
✔ Larger Trend Confirmation
13/48 EMA crossovers
✔ Macro Trend
EMA 200
✔ Intraday Bias
VWAP
✔ Visual Trend (background)
✔ Alerts for signals + trend shifts
Wyszukaj w skryptach "adx"

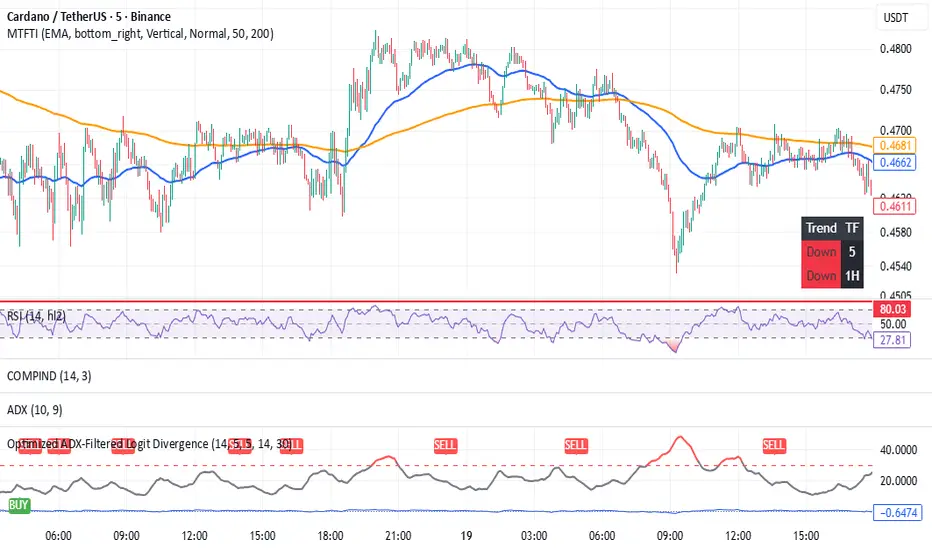
Optimized ADX-Filtered Logit DivergenceTrend-filtered Logit RSI divergence detector that only marks bullish/bearish divergences when momentum weakens and ADX confirms a weak trend.
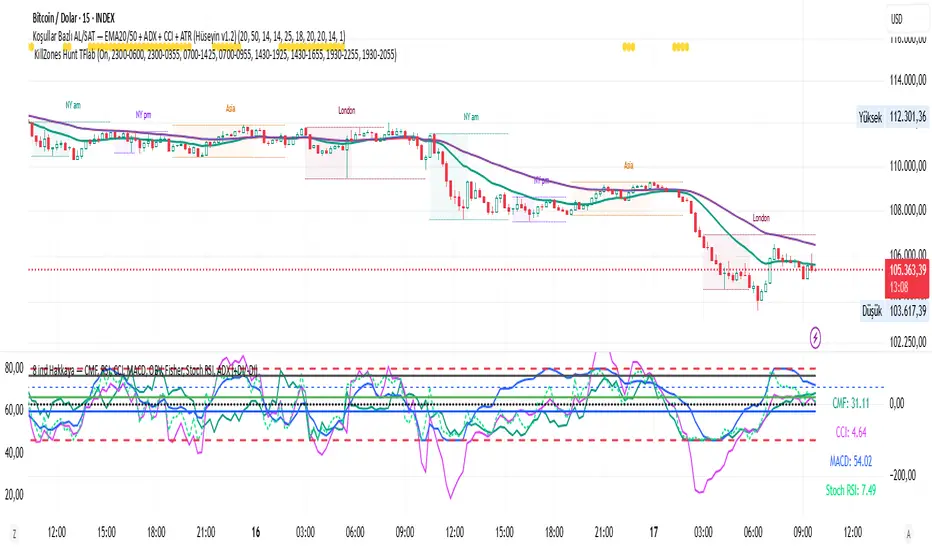
CMF, RSI, CCI, MACD, OBV, Fisher, Stoch RSI, ADX (+DI/-DI)
Stoch RSINine indicators in one, CMF, RSI, CCI, MACD, OBV, Fisher, Stoch RSI, ADX (+DI/-DI) You can use whichever of the nine indicators you want. I use CFM, CCI, MACD, Stoch RSI.
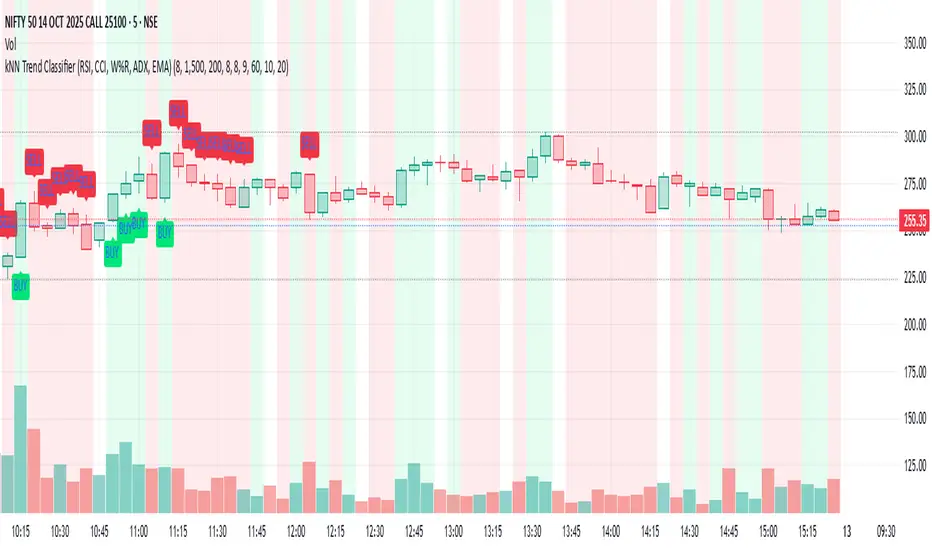
kNN Trend Classifier (RSI, CCI, W%R, ADX, EMA)This Pine Script indicator, "kNN Trend Classifier," is a specialized tool for identifying market trends using a combination of classic technical indicators and a simple machine learning approach. The script is designed for traders who want to blend quantitative analysis with visual chart signals to improve decision-making.
At its core, the indicator utilizes six key features: RSI (14), RSI (9), CCI, Williams %R, ADX, and 9-period EMA. Each of these measures different dimensions of momentum, trend strength, and market positioning. These values are normalized to ensure they are fairly compared across different market conditions. For every bar close, the script stores a historical snapshot of these features and uses a k-Nearest Neighbor (kNN) technique to classify the current trend as bullish or bearish. The kNN algorithm works by calculating the Euclidean distance between the present market state and all stored historical states, then referencing the majority label among the closest neighbors to decide on the market regime.
The script also provides powerful customization. Users can adjust the number of neighbors (k) to make signals more reactive or more stable; increase the training window for a deeper historical perspective; and fine-tune the lookback window for feature normalization. Two optional filters—based on volume percentile and ATR volatility—help to screen out signals in low-liquidity or low-volatility periods, reducing false positives and improving reliability.
To modify the behavior, traders should experiment with the inputs: lower k for faster signal changes, raise k or the training window for smoother signals, and adjust normalization length for different levels of trend sensitivity. Activating the volume and volatility filters is highly recommended during choppy markets. Altogether, this script gives users a robust framework to catch bullish or bearish trends with a blend of proven technical analysis and adaptive pattern recognition.
OBV Cloud v1.0 [PriceBlance]🌐 English
OBV Cloud v1.0 – Free & Open-Source
OBV Cloud v1.0 integrates On-Balance Volume (OBV) with a Cloud model and enhanced trend filters.
It helps traders quickly identify:
Money Flow Trend: OBV Cloud acts as a dynamic support/resistance zone.
Trend Filters: EMA9 (short-term) and WMA45 (medium-term) directly applied on OBV.
OBV–Price Divergence: Detects both regular and hidden bullish/bearish divergences.
Trend Strength: Measured with ADX calculated on OBV.
OBV Cloud is suitable for both swing and day trading, allowing traders to spot breakouts, reversals, or sustained trends through volume-based analysis.

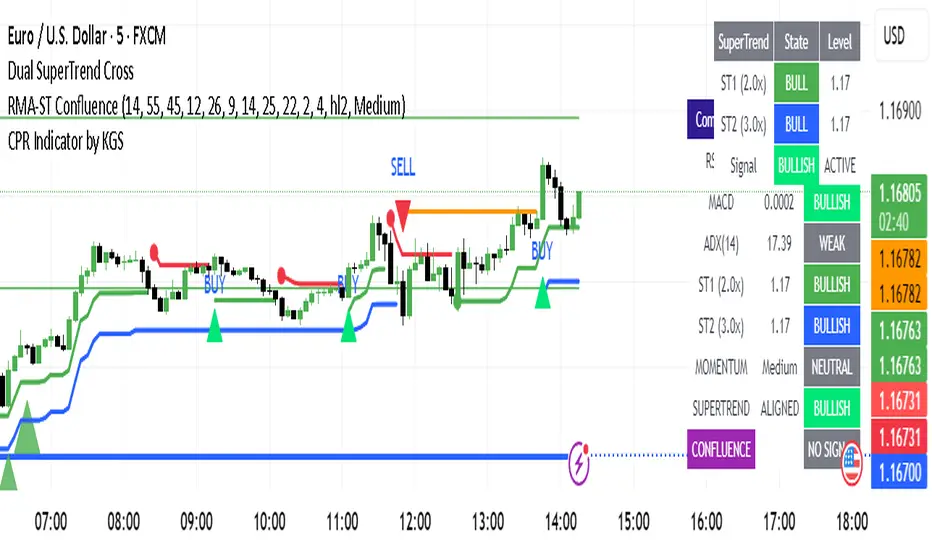
RSI-MACD-ADX + Dual SuperTrend ConfluenceKey Features:
Confluence Logic:
Buy signals only trigger when BOTH momentum AND SuperTrend are bullish
Sell signals only trigger when BOTH momentum AND SuperTrend are bearish
No conflicting signals - eliminates false entries when systems disagree
Signal Types:
STRONG BUY/SELL: Fresh momentum signal + Fresh SuperTrend alignment (maximum confidence)
Regular BUY/SELL: Momentum bullish + Both SuperTrends bullish (high confidence)
Customizable Settings:
RSI Momentum Zones: Bullish (>55), Bearish (<45), Neutral (45-55)
MACD Parameters: Fast (12), Slow (26), Signal (9)
ADX Trend Filter: Threshold (25) for trend strength
Dual SuperTrend: Two multipliers (2.0x and 3.0x) for confluence
Signal Strength: Choose between Weak/Medium/Strong momentum requirements
Visual Elements:
SuperTrend Lines: Both multipliers displayed with different colors
Background Highlighting: Green for bullish confluence, red for bearish
Signal Arrows: Large arrows for strong signals, smaller for regular
Comprehensive Table: Shows all component states and final confluence signal
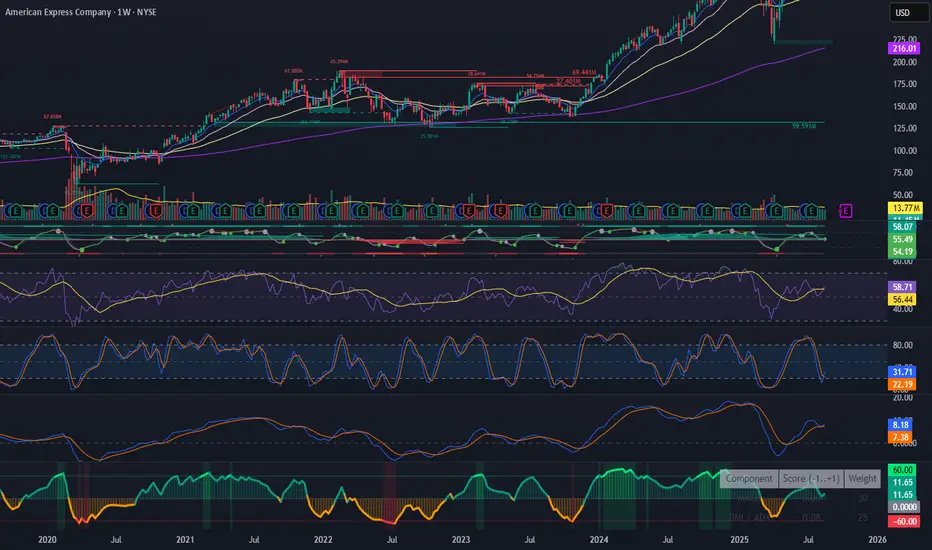
Fear & Greed Oscillator — LEAPs (v6, manual DMI/ADX)Fear & Greed Oscillator for LEAPs — a composite sentiment/trend tool that highlights long-term fear/greed extremes and trend quality for better LEAP entries and exits.
This custom Fear & Greed Oscillator (FGO-LEAP) is designed for swing trades and long-term LEAP option entries. It blends multiple signals — MACD (trend), ADX/DMI (trend quality), OBV (accumulation/distribution), RSI & Stoch RSI (momentum), and volume spikes — into a single score that ranges from –100 (extreme fear) to +100 (extreme greed). The weights are tuned for LEAPs, emphasizing slower trend and accumulation signals rather than short-term noise.
Use Weekly charts for the main signal and Daily only for entry timing. Entries are strongest when the score is above zero and rising, with both MACD and DMI positive. Extreme Fear (< –60) can mark long-term bottoms when followed by a recovery, while Extreme Greed (> +60) often signals overheated conditions. A cross below zero is an early warning to reduce or roll positions.
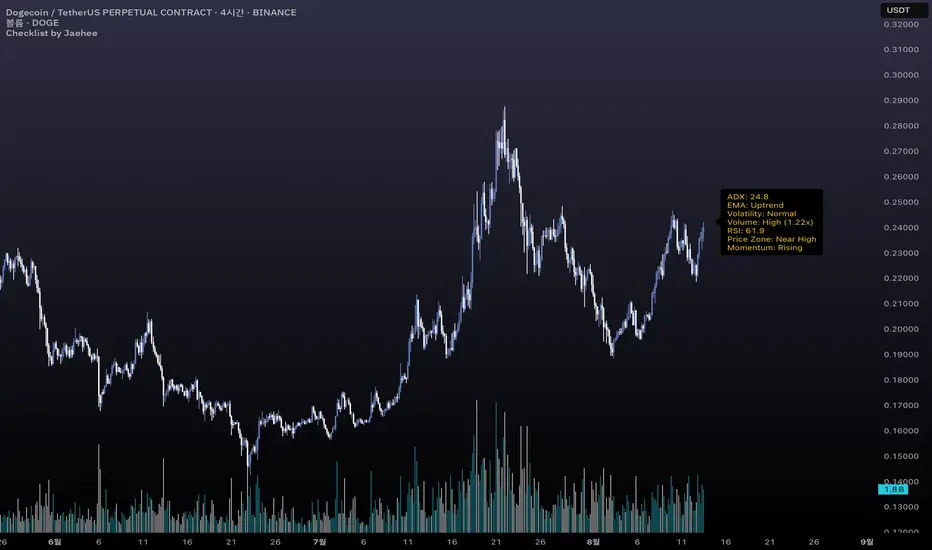
Checklist by JaeheeThe checklist is a market context tool that consolidates seven key metrics into a single on-chart panel, helping traders quickly gauge market conditions without switching between multiple indicators.
1. Display Panel (7 metrics):
ADX: Trend intensity (Above 20 often indicates a stronger, more reliable trend)
EMA Structure: 5/20/60/120/240 EMA alignment (Uptrend, Downtrend, or Mixed state)
Volatility: ATR regime classification (High volatility may require wider stops)
Volume State: Relative to 20-bar SMA with spike multiple (High volume often confirms price moves)
RSI: Current RSI(14) value (Above 70 = overbought zone, below 30 = oversold zone)
Price Zone: Location within the last 20-bar range (Near High, Mid, or Near Low)
Momentum Slope: MACD histogram slope (Rising suggests building momentum; Falling suggests fading momentum)
2. Purpose & Use:
Designed for traders—especially beginners—who want to speed up market scanning.
Keeps a concise, standardized “checklist” visible on the right side of the chart.
Use as a contextual reference, not as an entry/exit signal.
3. Features:
Compact label HUD anchored to the chart’s right margin.
Automatic refresh on each bar close with only one label to avoid clutter.
Works on any timeframe and symbol that supports OHLCV data.
Holy Grail Signal op EMA + ADXHolygrail + adx indicator with buy signals so you can buy at the yellow arrow

QuantumSync Pulse [ w.aritas ]QuantumSync Pulse (QSP) is an advanced technical indicator crafted for traders seeking a dynamic and adaptable tool to analyze diverse market conditions. By integrating momentum, mean reversion, and regime detection with quantum-inspired calculations and entropy analysis, QSP offers a powerful histogram that reflects trend strength and market uncertainty. With multi-timeframe synchronization, adaptive filtering, and customizable visualization, it’s a versatile addition to any trading strategy.
Key Features
Hybrid Signals: Combines momentum and mean reversion, dynamically weighted by market regime.
Quantum Tunneling: Enhances responsiveness in volatile markets using volatility-adjusted calculations.
3-State Entropy: Assesses market uncertainty across up, down, and neutral states.
Regime Detection: Adapts signal weights with Hurst exponent and volatility ROC.
Multi-Timeframe Alignment: Syncs with higher timeframe trends for context.
Customizable Histogram: Displays trend strength with ADX-based visuals and flexible styling.
How to Use and Interpret
Histogram Interpretation
Positive (Above Zero): Bullish momentum; color intensity shows trend strength.
Negative (Below Zero): Bearish momentum; gradients indicate weakness.
Overlaps: Alignment of final_z (signal) and ohlc4 (price) histograms highlights key price levels or turning points.
Regime Visualization
Green Background: Trending market; prioritize momentum signals.
Red Background: Mean-reverting market; focus on reversion signals.
Blue Background: Neutral state; balance both signal types.
Trading Signals
Buy: Histogram crosses above zero or shows positive divergence between histograms.
Sell: Histogram crosses below zero or exhibits negative divergence.
Confirmation: Match signals with regime background—green for trends, red for ranges.
Customization
Tweak Momentum Length, Entropy Lookback, and Hurst Exponent Lookback for sensitivity.
Adjust color themes and transparency to suit your charts.
Tips for Optimal Use
Timeframes: Use higher timeframes (1h, 4h) for trend context and lower (5m, 15m) for entries.
Pairing: Combine with RSI, MACD, or volume indicators for confirmation.
Backtesting: Test settings on historical data for asset-specific optimization.
Overlaps: Watch for histogram overlaps to identify support, resistance, or reversals.
Simulated Performance
Trending Markets: Histogram stays above/below zero, with overlaps at retracements for entries.
Range-Bound Markets: Oscillates around zero; overlaps signal reversals in red regimes.
Volatile Markets: Quantum tunneling ensures quick reactions, with filters reducing noise.
Elevate your trading with QuantumSync Pulse—a sophisticated tool that adapts to the market’s rhythm and your unique style.

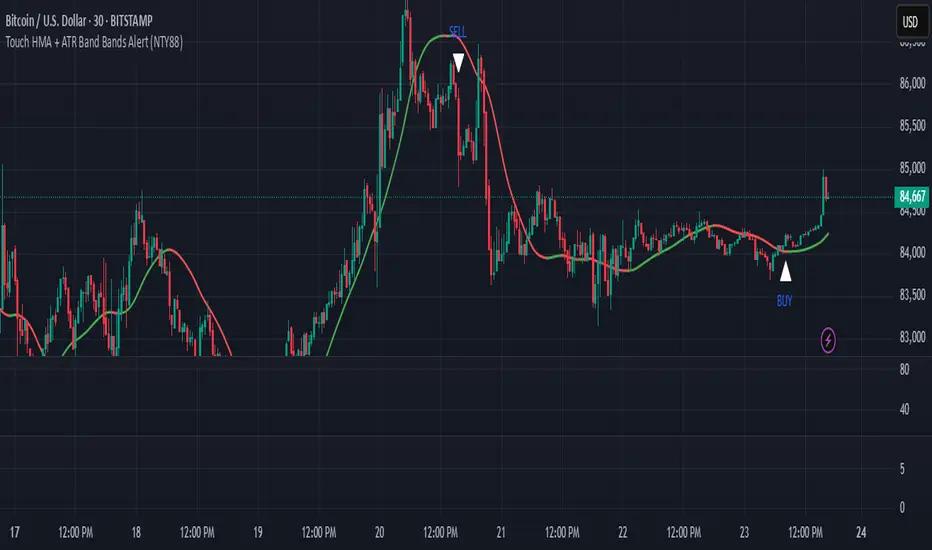
Touch HMA + ATR Band Bands Alert (NTY88)🔔 Precision Alerts | No Repainting | ATR-Based Touch Detection | HMA Trend Coloring
This script is a clean and powerful tool designed to help you catch precise market reversals using ATR Band touches combined with trend-following logic.
📌 How It Works
A custom Hull Moving Average (HMA) is used to track the trend.
Two dynamic ATR-based bands are drawn above and below the HMA.
A signal is generated when the closing price touches the upper or lower ATR band within a small tolerance zone.
✅ Key Features
🔁 Alternating Signals: Only one Buy → then one Sell → then Buy again. No signal spam.
🟢🔴 Color-Changing HMA Line: Green = HMA rising | Red = HMA falling
📏 Price Tolerance Input: Define how close the candle must be to the ATR band to trigger a signal.
🔔 Real-Time Alerts: Easily set alerts for Buy and Sell signals — works in live markets.
🚫 No Repainting: All signals are confirmed at candle close and will not change afterward.
🎯 When to Use
Great for trend reversals, scalping zones, or identifying potential exhaustion points.
Works well on any timeframe or market (crypto, stocks, forex).
💬 Pro Tip:
Combine this with RSI, Volume, or ADX filters to build a complete confluence system.
📈 Built for traders who love clean logic, precision entries, and visual clarity.
All-in-One BB Stoch RSI + PSAR + Keltner + ADX + Trailing StopThis invite-only indicator combines multiple advanced tools into a single script, generating buy/short signals alongside comprehensive alerts. Priced at just $25/month, it’s ideal for both manual trading and integration with bots.
Key Features & Alerts
Buy & Short Signals
Quickly identify potential long or short entries.
Three Take-Profit (TP) Lines
Long: After a BUY signal, three lines appear (TP1, TP2, TP3), allowing you to take partial profits—e.g., 30%, 30%, 30%—and keep the remaining 10% to trail.
Short: Similarly, after a SHORT signal, three TP lines help you scale out as price moves in your favor.
Stop-Loss Line (Based on Bollinger Width)
Precisely calculates a stop-loss distance using Bollinger Band width (a percentage below for longs or above for shorts).
Trailing Stop-Loss
Any remaining position can be trailed under (or above) Parabolic SAR, Keltner Channels, and Bollinger, with an extra 0.2% margin for added caution.
ADX + Stoch RSI + RSI (MA)
Filter out weak trends, gauge volatility, and confirm overbought/oversold regions in real time.
Compatible With Trading Bots
Built-in alerts can be connected to bot logic (via webhooks), enabling automated management of entries, TPs, stop-losses, and trailing stops.
Why Use This Indicator?
All-in-One Script: Eliminates chart clutter by merging multiple indicators into one.
Partial Take-Profits: Clearly defined TP1, TP2, TP3 lines help you lock in gains progressively.
Enhanced Risk Control: Stop-loss and trailing stop lines update automatically, keeping your trades protected.
Easy Bot Integration: Perfect for traders wanting direct alerts or automated trading setups.
Invite-Only for Exclusive Access: Maintain a competitive edge with protected source code.
How to Use:
Add to Chart
After access is granted, go to Indicators → Invite-Only Scripts and select this script.
Enable Specialized Alerts
Receive notifications for Buy/Short signals, the three TP lines, Stop-Loss, and Trailing Stop events.
Scale Out or Automate
Manually close partial positions at the TP lines (e.g., 30% each time) and let the remaining 10% trail for bigger moves.
Or link these alerts to a trading bot for fully automated position management.
Price: $25/month
Interested? Contact me (via direct message or email) for more details and to subscribe. Experience clearer charts, timely signals, and robust risk management in one invite-only package!
TrendMasterPro_FekonomiTrend Change and Start Signals with Weighted Conditions
The Trend Change and Start Signals with Weighted Conditions indicator leverages various technical analysis tools to generate reliable buy and sell signals. This indicator helps investors more accurately identify trend changes and start signals in the market.
Features:
Utilizes popular technical analysis tools such as MACD, RSI, EMA, and Ichimoku Cloud.
Enhances signal accuracy with additional indicators like ADX and Volume Increase.
Allows users to adjust the weights of each condition to set their importance.
The Confidence Level parameter lets you adjust the accuracy rate of the signals.
Visual Signals make it easy to track buy and sell points directly on the chart.
How It Works:
Condition Weights: Users assign weights to indicators like MACD, RSI, EMA, and Ichimoku Cloud. If you have no idea, use default settings.
Condition Fulfillment: Checks if the conditions for each indicator are met.
Confidence Level: The total weight of the fulfilled conditions must exceed the user-defined confidence level.
Signal Generation: When these conditions are met, a buy or sell signal is generated and visually displayed on the chart.
Customization:
Personalize Signals: By adjusting the weights of the indicators used, you can personalize the signals to match your trading strategy and preferences.
Use Cases:
Short-Term Investments: Identify quick trend changes for short-term trading decisions.
Long-Term Investments: Detect long-term trend starts and changes for strategic investment decisions.
Technical Analysis: Combine different technical analysis tools for more comprehensive and reliable analyses.
With this indicator, you can better understand market movements and make more informed investment decisions. Try it now and enhance your trading strategy!
by Fekonomi

Scalper's Volatility Filter [QuantraSystems]Scalpers Volatility Filter
Introduction
The 𝒮𝒸𝒶𝓁𝓅𝑒𝓇'𝓈 𝒱𝑜𝓁𝒶𝓉𝒾𝓁𝒾𝓉𝓎 𝐹𝒾𝓁𝓉𝑒𝓇 (𝒮𝒱𝐹) is a sophisticated technical indicator, designed to increase the profitability of lower timeframe trading.
Due to the inherent decrease in the signal-to-noise ratio when trading on lower timeframes, it is critical to develop analysis methods to inform traders of the optimal market periods to trade - and more importantly, when you shouldn’t trade.
The 𝒮𝒱𝐹 uses a blend of volatility and momentum measurements, to signal the dominant market condition - trending or ranging.
Legend
The 𝒮𝒱𝐹 consists of a signal line that moves above and below a central zero line, serving as the indication of market regime.
When the signal line is positioned above zero, it indicates a period of elevated volatility. These periods are more profitable for trading, as an asset will experience larger price swings, and by design, trend-following indicators will give less false signals.
Conversely, when the signal line moves below zero, a low volatility or mean-reverting market regime dominates.
This distinction is critical for traders in order to align strategies with the prevailing market behaviors - leveraging trends in volatile markets and exercising caution or implementing mean-reversion systems in periods of lower volatility.
Case Study
Here we can see the indicator's unique edge in action.
Out of the four potential long entries seen on the chart - displayed via bar coloring, two would result in losses.
However, with the power of the 𝒮𝒱𝐹 a trader can effectively filter false signals by only entering momentum-trades when the signal line is above zero.
In this small sample of four trades, the 𝒮𝒱𝐹 increased the win rate from 50% to 100%
Methodology
The methodology behind the 𝒮𝒱𝐹 is based upon three components:
By calculating and contrasting two ATR’s, the immediate market momentum relative to the broader, established trend is calculated. The original method for this can be credited to the user @xinolia
A modified and smoothed ADX indicator is calculated to further assess the strength and sustainability of trends.
The ‘Linear Regression Dispersion’ measures price deviations from a fitted regression line, adding further confluence to the signals representation of market conditions.
Together, these components synthesize a robust, balanced view of market conditions, enabling traders to help align strategies with the prevailing market environment, in order to potentially increase expected value and win rates.

Volatility FilterThe "Volatility Filter" script is designed to measure market volatility across two different timeframes and determine whether the market is flat or trending.
It uses custom-tuned versions of four different indicators to measure volatility and distinguish between trending and ranging conditions.
The selected indicators are:
1 - Average Directional Index (ADX) Volatility
2 - Damiani Volameter
3 - Trader Pressure Index (TPI)
4 - Williams Alligator Indicator
The script calculates a filter score for both the current timeframe and a user-specified higher timeframe. It offers two types of filter scores, controlled by the 'FilterType' parameter. The filter score is then visualized on the chart as the main oscillator for the current timeframe and a filled bar for the higher timeframe.
The script utilizes a custom moving average function that provides 17 different ways to calculate a moving average, giving the user extensive flexibility in tailoring the script to their needs.
By using custom indicators and unique score calculation methods across two timeframes, this script provides a comprehensive measure of market volatility, aiding traders in identifying trending and ranging market conditions.
This script also provides two additional parameters for tuning its calculations and output, allowing to adjust the script to any trading style and the characteristics of the market being traded.
1 - Threshold: This parameter sets a threshold that the oscillator needs to surpass for the current market move to be considered as a trend. By adjusting the threshold, traders can control how much volatility is required to register a move as trending. A higher threshold will require more volatility for a trend to be recognized, meaning that the market needs to be moving more strongly for a trend to be identified.
2 - Length: This parameter is used to smooth the oscillator. It determines the number of periods used in the calculation of the moving average of the volatility filter score. A longer length will consider more data points and therefore provide a smoother line, which can be useful in accounting for the fading of trends. When trends start to lose their strength but are still present, a longer length can help in maintaining the recognition of the trend, aiding in making accurate trading decisions.
By adjusting these parameters, traders can fine-tune the script's sensitivity to market volatility and its recognition of trends, providing valuable flexibility in adapting to different market conditions and trading strategies.

Ultimate Balance OscillatorIntroducing the Ultimate Balance Oscillator: A Powerful Trading Indicator
Built upon the renowned Rate of Change (ROC), Relative Strength Index (RSI), Commodity Channel Index (CCI), Williams Percent Range, and Average Directional Index (ADX) from TradingView, this indicator equips traders with an unparalleled understanding of market dynamics.
What sets the Ultimate Balance Oscillator apart is its meticulous approach to weighting. Each component is assigned a weight that reflects its individual significance, while carefully mitigating the influence of highly correlated signals. This strategic weighting methodology ensures an unbiased and comprehensive representation of market sentiment, eliminating dominance by any single indicator.
Key Features and Benefits:
1. Comprehensive Market Analysis: The Ultimate Balance Oscillator provides a comprehensive view of market conditions, enabling traders to discern price trends, evaluate momentum shifts, identify overbought or oversold levels, and gauge the strength of prevailing trends. This holistic perspective empowers traders to make well-informed decisions based on a thorough understanding of the market.
2. Enhanced Signal Accuracy: With its refined weighting approach, the Ultimate Balance Oscillator filters out noise and emphasizes the most relevant information. This results in heightened signal accuracy, providing traders with a distinct advantage in identifying optimal entry and exit points. Say goodbye to unreliable signals and welcome a more precise and dependable trading experience.
3. Adaptability to Various Trading Scenarios: The Ultimate Balance Oscillator transcends the constraints of specific markets or timeframes. It seamlessly adapts to diverse trading scenarios, accommodating both short-term trades and long-term investments. Traders can customize this indicator to suit their preferred trading style and effortlessly navigate ever-changing market conditions.
4. Simplicity and Ease of Use: The Ultimate Balance Oscillator simplifies trading analysis by providing a single line on the chart. Its straightforward interpretation and seamless integration into trading strategies make decision-making effortless. By observing bullish or bearish crossovers with the moving average, recognizing overbought or oversold levels, and tracking the overall trend of the oscillator, traders can make well-informed decisions with confidence.
5. Real-time Alerts: Stay ahead of the game with the Ultimate Balance Oscillator's customizable alert system. Traders can set up personalized alerts for bullish or bearish crossovers, breaches of overbought or oversold thresholds, or any specific events that align with their trading strategy. Real-time notifications enable timely action, ensuring traders never miss lucrative trading opportunities.
The Ultimate Balance Oscillator is a robust trading companion, empowering traders to make shrewd and calculated decisions. Embrace its power and elevate your trading endeavors to new heights of precision and success. Discover the potential of the Ultimate Balance Oscillator and unlock a world of trading possibilities.

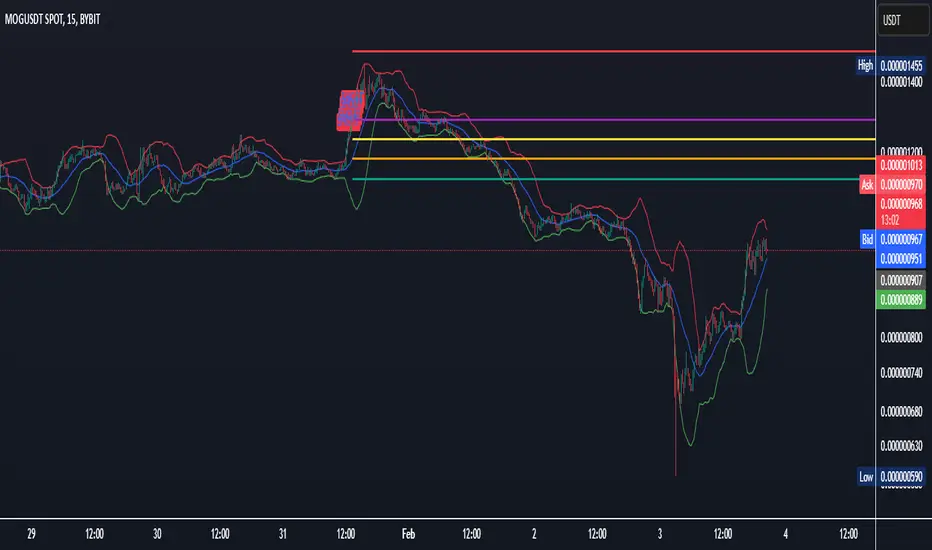
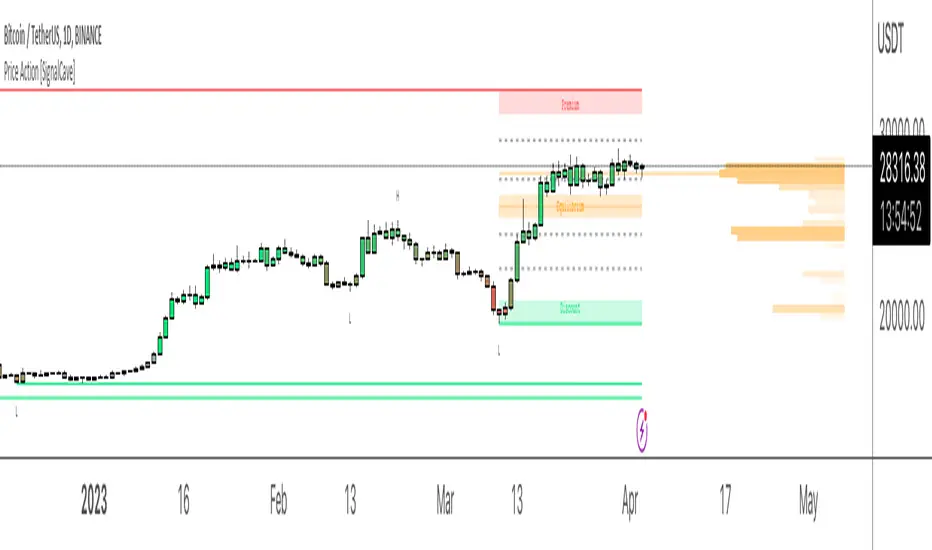
Price Action [SignalCave]Liquidation prices are calculated with Higher Timeframe usage of "Williams Fractals" indicator.
Sell side liquidity levels are shown with "L" text and a green solid lines.
Buy side liquidity levels are shown with "H" text and a red solid lines.
Premium and Discount zones are determined with latest untested buy/sell liquidity levels.
"Premium" means the asset price is overvalued, "Discount" means the asset is undervalued.
Once price hits any active liquidity level, "Premium and Discount" zone will be recalculated.
Premium and Discount have "Equilibrium" area which is center area of the whole zone.
Extra Support & Resistance levels calculation are based on Fibonacci. Levels are 23.6%, 38.2%, 61.8% and 78.6% .
Bars are painted based on asset's momentum. The asset momentum is calculated by the RSI and ADX indicators.
Volume profile shows trade activity during the "Premium and Discount" zone.
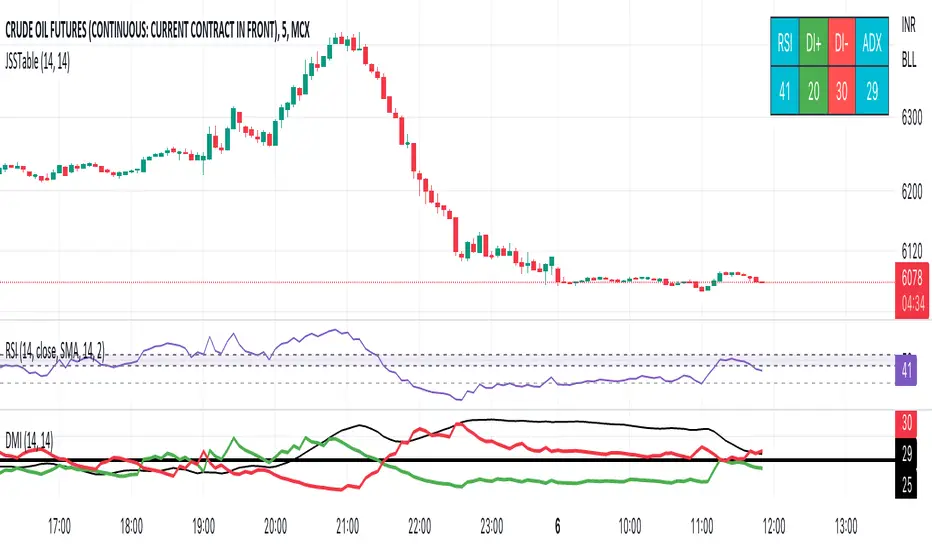
JSS Table - RSI, DI+, DI-, ADXSimple table to show the values for indicators which can be used to initiate trades:
RSI: Long above 55 // Short below 45 // Choppy between 45-55
DI+: Long above 25
DI-: Short above 25
Note when to avoid trend trades:
- If DI+ and DI- are both below 25 then market is choppy
- If RSI is between 45-55 then market is choppy
Strength Index I2-SIIdea:
Enhance the Stoch RSI with DMI to get the visualization of the strength movement.
Concept:
(Note that we take the close to get the closing price).
-Combination of 2 Stoch RSI (using value K): 1 is UP, 1 is DOWN (these settings have been customized).
-Every time they cross, it calculates the direction of 3 nearly previous crossings to get the color of the current line.
-The value has been re-calculated with the processed value from ADX and DI- (That's why it can be more than 100 or -100 in some cases).
-RSI Overbuy and oversell are removed because the value could be beyond it.
How it works:
1. The line is show as the strength index of bars
- Green means the up strength is strong.
- Red means the down strength is strong.
- Gray means the previous strength is getting week.
2. This one can be used to find divergence.
3. This indicator provides a warning signal when the color of the line changes:
- Change color:
+Turn red: "Down Red"
+Turn green: "Up Green"
+Turn gray: "Down Gray"/"Up Gray"
Suitable time frames:
15m, 4h, 1D, 1W
* Please note that this logic does not attempt to predict future prices or 100% accurate signal.
(INVITE ONLY indicator. Please direct message or visit website if you want to try it out)
Hope you guys enjoy!
Examples:
BTCUSD 1D
XAUUSD 4H
EURUSD 1H
SPX 15m

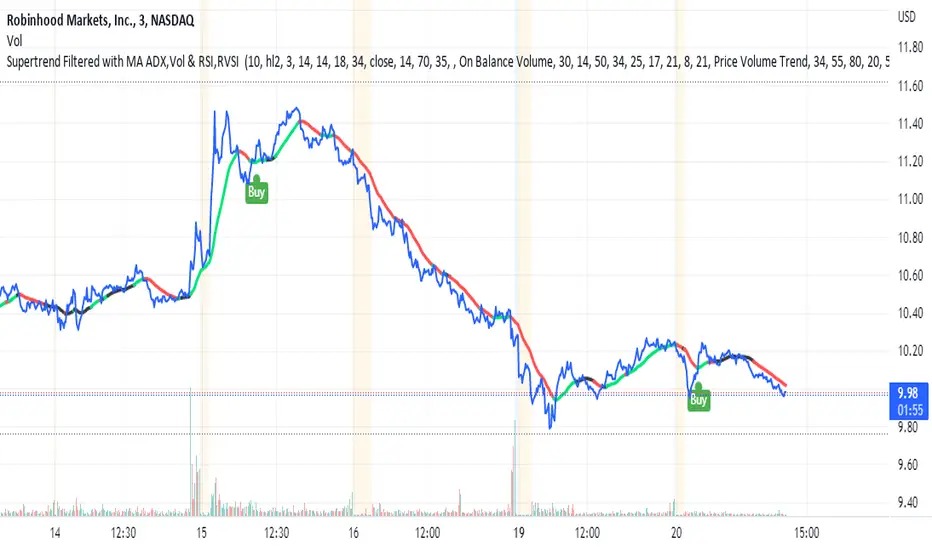
Supertrend Filtered with MA ADX,Vol & RSI,RVSItest script that combines Supertrend Filtered with MA ADX,Vol & RSI,RVSI
Moving Average Directional IndexMADX is ADX-inspired indicator with moving averages that determines strength of a trend, as well as its direction. Indicator works following:
As the value of MADX increases, so does the strength of a trend
If MADX+ ( green line - bullish MADX ) crosses above MADX- ( red line - bearish MADX ) we consider trend as bullish and vice versa..
There will be situations where MADX- and MADX+ cross multiple times in a short period of time -> that will mean that market indecision is happening and big move will most likely happen after it.
For the calculation of MADX+ and MADX- we need Moving Averages or Exponential Moving Averages with three specific sources ( high, close, low ).
Now, the calculation of each MADX will differ
=> for MADX+: Moving Average (high) / Moving Average (close)
=> for MADX-: Moving Average (close) / Moving Average (low)
Length of Moving Average is editable.

Directional Movement RibbonWhat makes this different from directional movement index?
The aim is to reduce the amount of data analysis necessary before taking action; currently using DMI requires reviewing the DM+ and DM- plots, and ADX as well as review the overall trend of each one. Also there is the final analysis to determine whether a strong trend hasn’t been established at all.
This indicator condenses the information found from the standard DMI into an intuitive colored ribbon that reveals direction and strength at a glance.
How to use it?
Review the ribbon for sentiment based on color, green being bullish and red being bearish, (if using default color scheme). The brightness of the color determines the strength of the sentiment, brightest being strongest. If no color is represented at all then it is due to weakness and/or lack of direction.
Features
All colors customizable
Toggle display of indecision areas
Adjust levels considered strong, weak trends
Which markets is this meant for?
This can be used in any market, though it’s recommended to use with liquid markets where direction and strength can be found often.
What conditions?
Recommend to utilize with key levels and most commonly utilized moving average periods such as 20, 50, 100 or 200.

SBS AlgoHello traders, I am here again with a new and improved indicator.
This indicator is based on a pivot breakout algorithm which gives buy and sell signals according to the breakout of trendline. This is an advanced version of another script. It also takes price action into consideration along with some basic indicators like MACD and ADX to give good entry signals.
NOTE: This indicator is not designed to take entries completely based on signals it gives. Please use it along with your trading strategy to add more confluence to your trading system and maximize your profits.
I hope you guys will like this one too .Enjoy 👍
In case you find any bug, please do report in comment section .Thank you.
