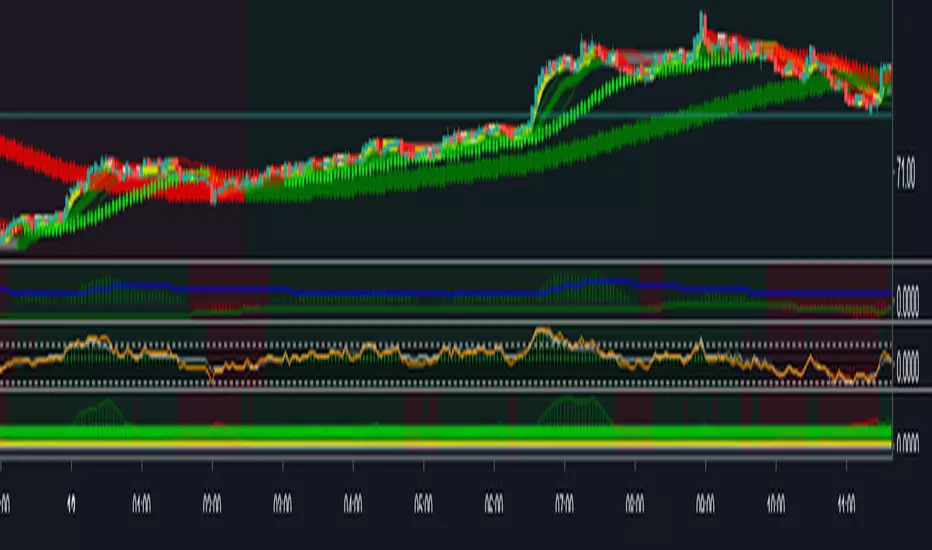
DMI Trade Zone [Alorse]Through the DMI Trade Zone you can find safe areas to trade in the Spot market.
The logic behind the indicator is:
- If the Positive Directional Movement (+DI) is greater than the Negative Directional Movement (-DI) then the Average Directional Movement Index (ADX) will be green with an opaque white background.
- If the Positive Directional Movement (+DI) is less than the Negative Directional Movement (-DI) then the Average Directional Movement Index (ADX) will be red.
Wyszukaj w skryptach "adx"

Trading Range FinderWhat is it?
This indicator is a visual representation of the ADX indicator that shows where the areas of weak trends are. Anything shaded in a gray background implicates that the chosen market is experiencing a weak trend.
These areas of weak trends are seen typically when ADX drops below 20-25 but this script is customizable to change where you want that threshold.
Why did I make it?
I made this indicator to be used in combination with other trading indicators to eventually be used to identify when a market is range-bound/sideways.
Since momentum-based indicators can be "thrown off" in sideways market conditions, I will be using this visual indicator to identify when it is best to filter out a trade signal in a momentum-based strategy.

indicatorenindicatoren is one non-overlaying indicator with multiple oscillators combined.
indicatoren provides the following functions:
- RSI (Relative Strength Index)
- Stochastics (representation of mathematically calculated momentum)
- Configurable MAcd (Moving Average Convergence Divergence) visually compressed to 0-100 range
- DMI & ADX (Directional Movement Index & Average Directional indeX) with visual lowering option
- Bollinger Bands direction
- COMBI Average
- Hourly, 4Hourly, Daily and Weekly time-indications
The length and appearance for each element can be adjusted. The MAcd has several modes and the brightness
of its elements can be adjusted with one single control.
The COMBI Average consists of a weighted average of the RSI, Stochastics, MAcd, DMI and the BB Direction.
It has its own definable length. Depending on the timeframe used, a visual indication of Hours, 4 Hours,
Days and Weeks might prove handy, especially on shorter timeframes.
Displaying this number of oscillators all at once may look like a carnival, therefore, each function can easily
be switched on or off. indicatoren can be used as just an advanced MAcd for example, or have it show the
combination of functions suiting you the most.
In order to combine a MAcd (+/- infinite scale) with Stochastics or RSI (0-100 scale), the MAcd is being visually
compressed and a Visual Multiplier parameter is provided to make it fit under any circumstances on any timeframe.
The DMI +/- and ADX scale are divided by 2.5 by default. Having the DMI’s on the lower portion of the indicator
does still provide decent info at a glance while it is not in the way of the other oscillators.
Books have been written and many articles and videos have been made about the meaning and possible applications
of these oscillators in trading.
The unique combination of these oscillators within indicatoren , together with the simple, yet useful,
visual options, make it to quite a versatile indicator on every timeframe on any chart.
GuidoN - November 2019, July 2020

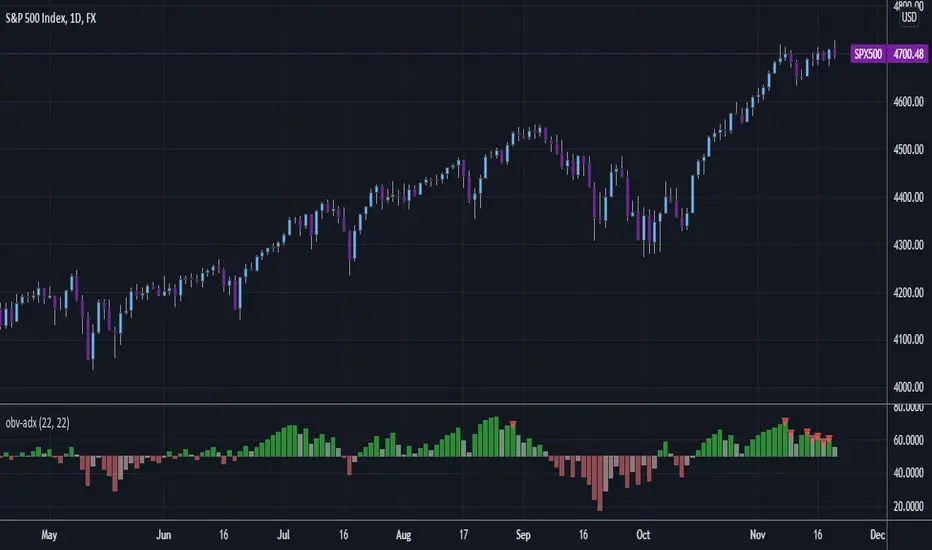
OBV - ADX and DI+/-This is the ADX and DI+/- indicator applied to OBV!
This really clearly shows up and down, but using VOLUME! Don't ignore it, there is too much information captured in the OBV.
If you just love the ADX/DI format, it is included in a checkbox.
Want some excellent background highlighting, turn in on in a checkbox.
Shout out to some inspirations
csw-dmi
unRekt-KISS-Addie
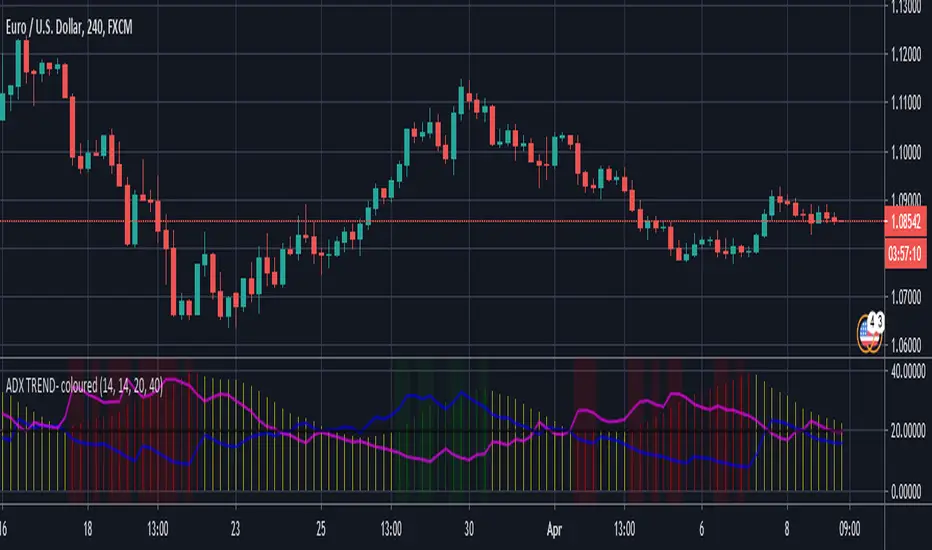
Directional Movement Index TrendThis DMI I modified to see the trend more clearly, and the ADX line changes according to the trend force, which is perfectly configurable, the configuration I left my default configuration, in case you want to modify it because you see the trend in different values, feel free, and basically the columns are the average of DI and also indicate the trend more clearly.
/////////////////////////////////////////////////////////////////////////////////////////////////////////////////////////////////////////////////////////////////////////////////////
Esse DMI eu modifiquei para ver a tendência com maior clareza, e a linha do ADX ela muda de acordo com a força de tendência, a qual é perfeitamente configurável, a configuração eu deixei a minha configuração padrão, caso você queira modificar porque você vê a tendência em valores diferentes, sinta-se livre, e basicamente as colunas são a média de DI e indicam também com mais clareza a tendência.

DMI & ADX Trend indicator - colour coded DMI and ADX plotted on an indicator. ADX histogram is colored when above value of 20 and rising when aligned with trend direction as defined by DMI criteria. (Green=Bullish & trending / Red=Bearish & trending)
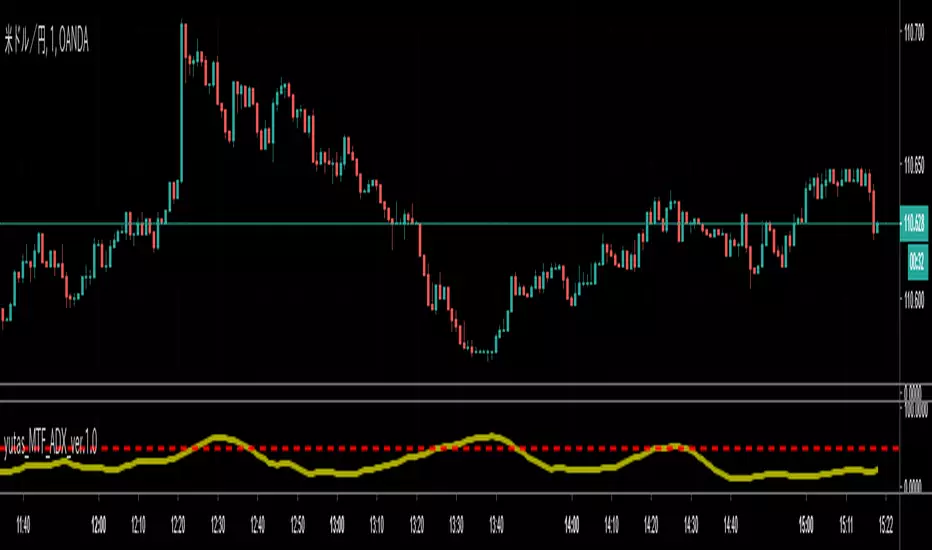
yutas_ADX_Trend_Ver1.0Ver1.0
The trend of ADX has been made easier to understand visually.
The line color changes when the specified value is exceeded.
ADXのトレンド発生を視覚的に分かりやすくしました。
指定数値以上でラインの色が変わります。
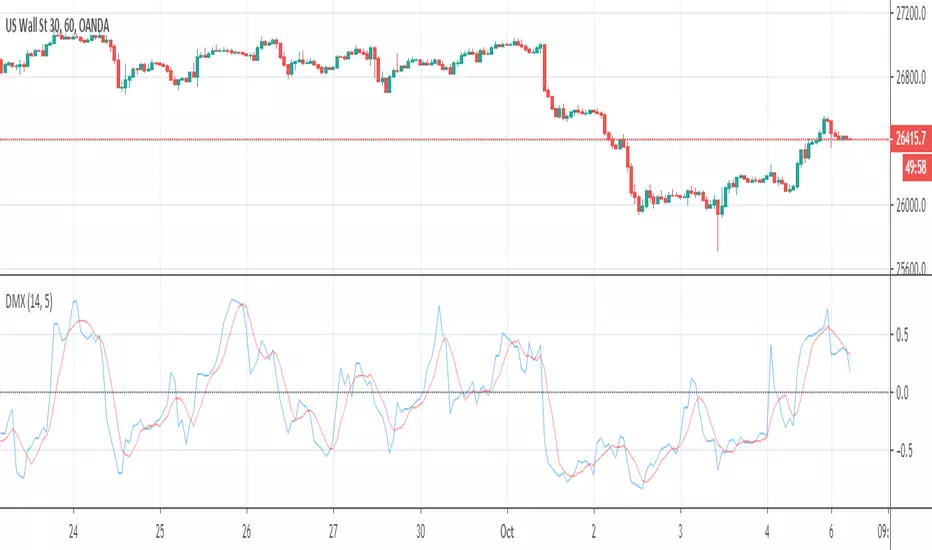
Directional Movement Quality IndexIndicator DMX (Bipolar DMI) is calculated using the standard indicator ADX. However, as compared to that, it displays data as an oscillator with a signal line, and has shorter delay.
DMX = (P-M) / (P+M)
Signal = MA(DMX, Signal period, Method)
where:
P - (+DI) ADX indicator line;
M - (-DI) ADX indicator line.
Source: www.mql5.com
Absolute Strength MTF IndicatorIntroduction
The non-signal version of the absolute strength indicator from fxcodebase.com requested by ernie76 . This indicator originally from mt4 aim to estimate the bullish/bearish force of the market by using various methods.
The Indicator
Two lines are plotted, a bull line (blue) representing the bullish/buying force and a bear one (red) representing the bearish/selling force, when the bull line is greater than the bear line the market is considered to be strongly bullish, else strongly bearish.
The indicator use various method, Rsi, stochastic, adx. The Rsi method is the one by default.
The stochastic method is less reactive but smoother
The Adx method is way different, while the other two methods make the bull and bear lines somewhat uncorrelated, the adx method focus more on the overall market strength than individual buyer/seller strength.
The smoothing method use 3 different filters, SMA, EMA and LSMA, LSMA is more reactive than the two previous one while EMA is just more computer efficient.
It is possible to use price data of different time frames for the calculation of the indicator.
Stochastic method with 4 hour price close as source.
Conclusion
A classic indicator who can be derived into a lot of ways using a more adaptive architecture or recursion. Hope you find it a use :)
A big thanks to ernie76 for the request and the support/testing of the indicator
Feel free to pm me for any request.

[Delphi][CryptoNews Plus] RSI + DMI ADXRSI + DMI ADX
Inner Version 1.0 07/02/2019
Developer: iDelphi
07/02/2019 Added RSI
07/02/2019 Added ADX

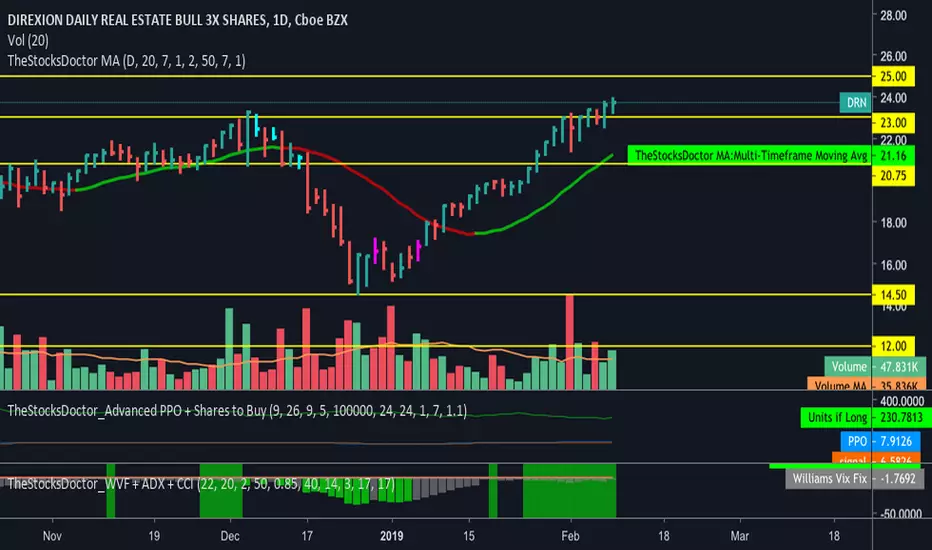
TheStocksDoctor_WVF + ADX + CCIThis script is a modified version of CM Williams Vix Fix for which I have added an indicator that shows when ADX and CCI are both indicating positive momentum - highlighted by green bars. This is part of TheStocksDoctor Trading System.
Inputs are as follows:
Lookback period Standard Deviation High ---> 22
Bolinger Band Length ---> 20
Bollinger Band Standard Dev.. ---> 2
Lookback period percentile high ---> 50
Highest Percentile ---> 0.85
----Highlight bars Below... --->
Show Highlight bar if WVF WAS true is now False --->
Show highlight bar if WVF IS True --->
----Highlight bars Below Use Filtered... --->
Show highlight bar for filtered entry --->
Show highlight bar for AGGRESSIVE Filtered Entry? --->
Check below to Turn all Bars Gray --->
Check box to Turn Bars gray? --->
Long-term look back current bar has to close Below... ---> 40
Medium-term look back current bar has to close below... ---> 14
Entry price action strength --close... ---> 3
--------Turn On/Off Alerts below... --->
---To activate alerts you HAVE To Check... --->
---You can un Check the box BELOW... --->
Show Williams Vix Fix Histogram... --->
Show Alert WVF = True? --->
Show Alert WVF wa true now False? --->
Show Alert WVF Filtered? --->
Show Alert WVF AGGRESSIVE Filter? --->
ADX Smoothing ---> 17
DI Length ---> 17
[astropark] MACD, RSI+, AO, DMI, ADX, OBV, ADI//******************************************************************************
// Copyright by astropark v4.1.0
// MACD, RSI+, Awesome Oscillator, DMI, ADX, OBV, ADI
// 24/10/2018 Added RSI with Center line to have clear glue of current trend
// 10/12/2018 Added MACD
// 13/12/2018 Added multiplier for MACD in order to make it clearly visible over RSI graph
// 11/01/2019 Added Awesome Ascillator (AO)
// 11/01/2019 Added Directional Movement Index (DMI) with ADX
// 14/01/2019 Added On Balance Volume (OBV)
// 14/01/2019 Added Accelerator Decelerator Indicator (ADI)
//******************************************************************************

[astropark] MACD, RSI+, Awesome Oscillator, DMI, ADX, OBV//******************************************************************************
// Copyright by astropark v4.0.0
// MACD, RSI+, Awesome Oscillator, DMI, ADX, OBV
// 24/10/2018 Added RSI with Center line to have clear glue of current trend
// 10/12/2018 Added MACD
// 13/12/2018 Added multiplier for MACD in order to make it clearly visible over RSI graph
// 11/01/2019 Added Awesome Oscillator (AO)
// 11/01/2019 Added Directional Movement Index (DMI) with ADX
// 14/01/2019 Added On Balance Volume (OBV)
//******************************************************************************

[astropark] MACD, RSI+, Awesome Oscillator, DMI with ADX//******************************************************************************
// Copyright by astropark v3.1.0
// MACD, RSI+, Awesome Oscillator, DMI, ADX
// 24/10/2018 Added RSI with Center line to have clear glue of current trend
// 10/12/2018 Added MACD
// 13/12/2018 Added multiplier for MACD in order to make it clearly visible over RSI graph
// 11/01/2019 Added Awesome Ascillator (AO)
// 11/01/2019 Added Directional Movement Index (DMI) with ADX
//******************************************************************************

SSABU Indicator2
─────────────────────────────────────
3 Stochastic
1 RSI
1 ADX and DI
Use it if you need auxiliary indicators!
─────────────────────────────────────
스톡캐스틱 3개
RSI 1개
ADX and DI 1개
보조지표 갯수 모자란분들 사용하세요!
─────────────────────────────────────
✅ Other indicators to help you trade
✅ 매매에 도움되는 다른 보조지표
Basel major swing 2.2
PpSignal ALMA ADXAlma ADX is a ADX and dmi oscillator in histogram format with alma and linreg internal calculation, yo have 3 line, green not trade, withe transition zone and lime trade zone.
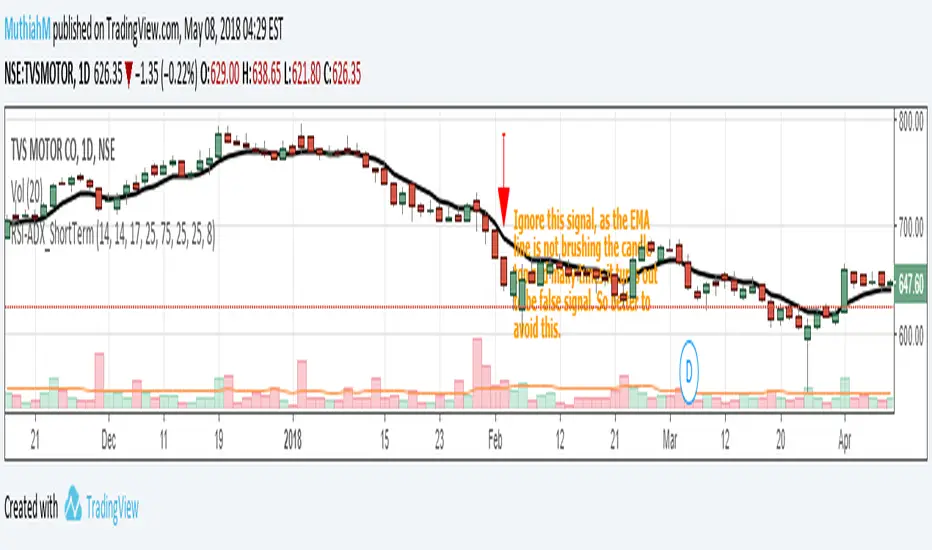
Setup for Short Term Investment using RSI&ADX. High success rateThis is a very simple script which gives reliable signals for buying and selling in short term. I came across this strategy a long time before in some website and coded it here. I had been using this for a long time and made good profits.
Idea is very simple, a buy call is triggered when RSI is greater than 75 and ADX is greater than 25. Sell call is triggered when RSI is lesser than 25 and ADX is again greater than 25. To remove false signals I always use it with EMA(close,8) which is also included as part of the code.
The ideal chart resolution is 1 day, below this the indicator is not reliable. Haven't tested this indicator for anything other than daily chart.
Refer the snapshots for more details.For any queries, please comment or PM me.
Ultimate Bar Analysis Emiliano MesaMy most complex script as a gift to you @TradingView.
Simple price action analysis. Look at the chart and the indicator will do everything else for you. This indicator is based in a combination of several indicators, including ADX, EMA, and concepts by the book "Bar by Bar" by Al Brooks. You can use it any way you like.
Its been tested in 5 minute stock charts, anything else is not assured to work.
Key:
Yellow/Pink ===> Buyer / Seller pressure (Bears/Bulls are gaining momentum)
Green/Orange ===> Up Trend / Down Trend, this is based on ADX, change the values if you wish.
Red ===> High reversal chance, based on Al Brooks book.
Grey Bars ===> No man land. (No trend is taking place)
Hope you enjoy! Leave your feedback down below.
---------------------------------------------------------------------
Want your own indicator? Email me at : emilianomesauribe2000@live.com
Prices starting at 100$
DMI strategykr.tradingview.com
Time of purchase : After the triangle under the Candle, Buy it if cross Just before the high on the day. and Consider the down trend and Whether the color of the candle is green and lime.
DMI+ADX를 이용한 전략입니다. +DI가 -DI를 상향돌파하면 캔들 아래 삼각형이 생기며 봉 캔들이 그린이면 +DI > -DI 일때이며 진정한 상승은 ADX도 20보다 클때인 형광색 캔들일때 입니다.
매수시점은 당일 즉 블루라인 범위내에서 고점을 캔들아래 삼각형 생기고 캔들색이 그린이나 형광색일때 돌파하면 매수입니다. 그리고 하향추세선이 위에있으면 참고하셔야합니다. 올라갈 공간이 있는지 확인해야합니다.

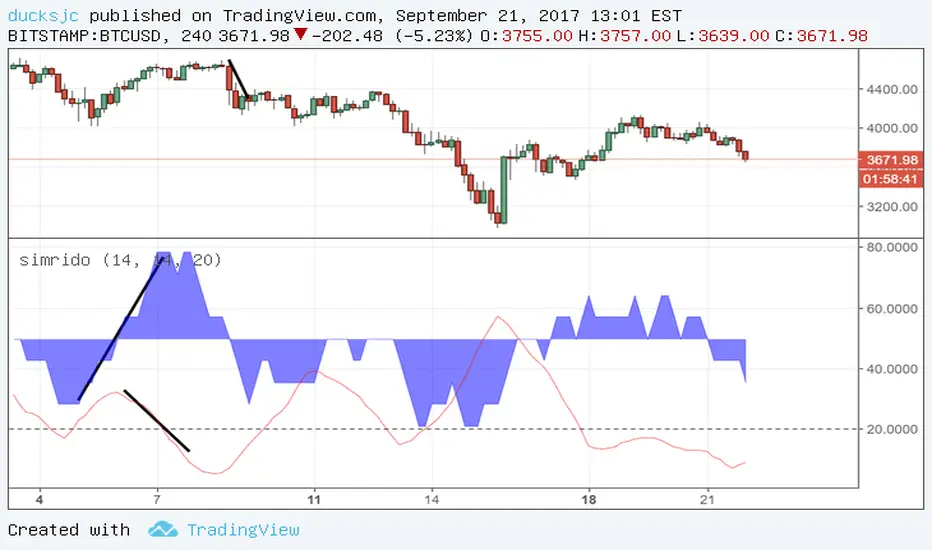
simrido+ADXblue area is srd (simrido. i cannot find proper english word. so i named it srd)
red is ADX
if blue is increasing (or higher than 50), it mean price increasing.
ok i like SRD. it looks like RSI. so good!
--------
blue increase + ADX decrease = price can be decrease soon (or decreasing already?)
This is not my idea. it something like Divergence...
well....i still cannot understand this idea.
:)
anyway i hope you enjoy this indicator.
DI histo + adxThis is a DI + ,DI - with ADX , but instead of plot the 2 lines of Directional moviment ( + and -), we have a histogram of the difference between DI+ and DI-. As zero line I used value of 25, so can plot the ADX too
