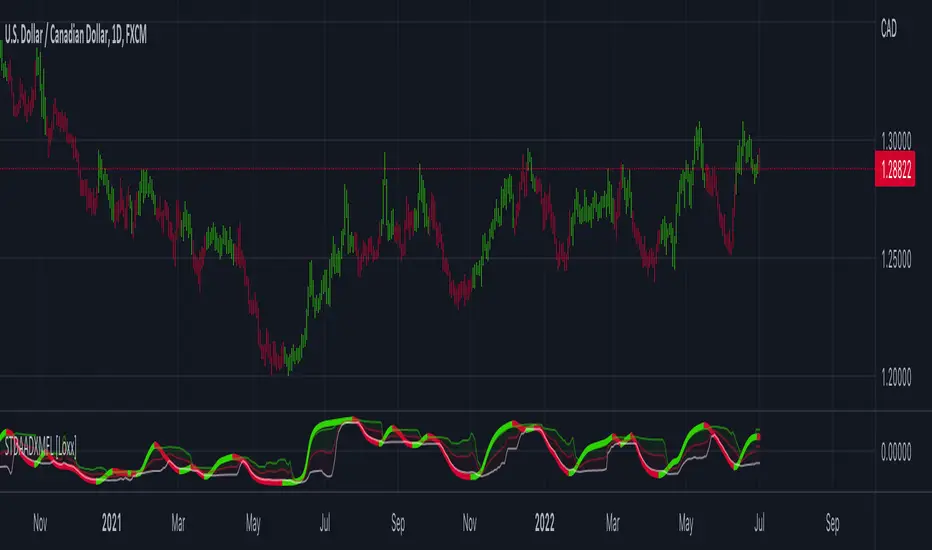
STD Adaptive ADXm w/ Floating Levels [Loxx]STD Adaptive ADXm w/ Floating Levels is a standard deviation adaptive ADX indicator with adaptive floating boundary levels
What is the ADX?
Trading in the direction of a strong trend reduces risk and increases profit potential. The average directional index (ADX) is used to determine when the price is trending strongly. In many cases, it is the ultimate trend indicator. After all, the trend may be your friend, but it sure helps to know who your friends are. In this article, we'll examine the value of ADX as a trend strength indicator.
What is the ADXm?
Unlike the traditional ADX indicator, where the ADX itself is plotted in absolute units and detection of the trend direction is hindered, this indicator clearly displays the positive and negative ADX half-waves (displayed as colored on the chart).
Included:
-Toggle on/off bar coloring
-Toggle on/off fill coloring
Wyszukaj w skryptach "adx"
888 BOT #alerts█ 888 BOT #alerts (open source)
This is an Expert Advisor 'EA' or Automated trading script for ‘longs’ and ‘shorts’, which uses only a Take Profit or, in the worst case, a Stop Loss to close the trade.
It's a much improved version of the previous ‘Repanocha’. It doesn`t use 'Trailing Stop' or 'security ()' functions (although using a security function doesn`t mean that the script repaints) and all signals are confirmed, therefore the script doesn`t repaint in alert mode and is accurate in backtest mode.
Apart from the previous indicators, some more and other functions have been added for Stop-Loss, re-entry and leverage.
It uses 8 indicators, (many of you already know what they are, but in case there is someone new), these are the following:
1. Jurik Moving Average
It's a moving average created by Mark Jurik for professionals which eliminates the 'lag' or delay of the signal. It's better than other moving averages like EMA , DEMA , AMA or T3.
There are two ways to decrease noise using JMA . Increasing the 'LENGTH' parameter will cause JMA to move more slowly and therefore reduce noise at the expense of adding 'lag'
The 'JMA LENGTH', 'PHASE' and 'POWER' parameters offer a way to select the optimal balance between 'lag' and over boost.
Green: Bullish , Red: Bearish .
2. Range filter
Created by Donovan Wall, its function is to filter or eliminate noise and to better determine the price trend in the short term.
First, a uniform average price range 'SAMPLING PERIOD' is calculated for the filter base and multiplied by a specific quantity 'RANGE MULTIPLIER'.
The filter is then calculated by adjusting price movements that do not exceed the specified range.
Finally, the target ranges are plotted to show the prices that will trigger the filter movement.
Green: Bullish , Red: Bearish .
3. Average Directional Index ( ADX Classic) and ( ADX Masanakamura)
It's an indicator designed by Welles Wilder to measure the strength and direction of the market trend. The price movement is strong when the ADX has a positive slope and is above a certain minimum level 'ADX THRESHOLD' and for a given period 'ADX LENGTH'.
The green color of the bars indicates that the trend is bullish and that the ADX is above the level established by the threshold.
The red color of the bars indicates that the trend is down and that the ADX is above the threshold level.
The orange color of the bars indicates that the price is not strong and will surely lateralize.
You can choose between the classic option and the one created by a certain 'Masanakamura'. The main difference between the two is that in the first it uses RMA () and in the second SMA () in its calculation.
4. Parabolic SAR
This indicator, also created by Welles Wilder, places points that help define a trend. The Parabolic SAR can follow the price above or below, the peculiarity that it offers is that when the price touches the indicator, it jumps to the other side of the price (if the Parabolic SAR was below the price it jumps up and vice versa) to a distance predetermined by the indicator. At this time the indicator continues to follow the price, reducing the distance with each candle until it is finally touched again by the price and the process starts again. This procedure explains the name of the indicator: the Parabolic SAR follows the price generating a characteristic parabolic shape, when the price touches it, stops and turns ( SAR is the acronym for 'stop and reverse'), giving rise to a new cycle. When the points are below the price, the trend is up, while the points above the price indicate a downward trend.
5. RSI with Volume
This indicator was created by LazyBear from the popular RSI .
The RSI is an oscillator-type indicator used in technical analysis and also created by Welles Wilder that shows the strength of the price by comparing individual movements up or down in successive closing prices.
LazyBear added a volume parameter that makes it more accurate to the market movement.
A good way to use RSI is by considering the 50 'RSI CENTER LINE' centerline. When the oscillator is above, the trend is bullish and when it is below, the trend is bearish .
6. Moving Average Convergence Divergence ( MACD ) and ( MAC-Z )
It was created by Gerald Appel. Subsequently, the histogram was added to anticipate the crossing of MA. Broadly speaking, we can say that the MACD is an oscillator consisting of two moving averages that rotate around the zero line. The MACD line is the difference between a short moving average 'MACD FAST MA LENGTH' and a long moving average 'MACD SLOW MA LENGTH'. It's an indicator that allows us to have a reference on the trend of the asset on which it is operating, thus generating market entry and exit signals.
We can talk about a bull market when the MACD histogram is above the zero line, along with the signal line, while we are talking about a bear market when the MACD histogram is below the zero line.
There is the option of using the MAC-Z indicator created by LazyBear, which according to its author is more effective, by using the parameter VWAP ( volume weighted average price ) 'Z-VWAP LENGTH' together with a standard deviation 'STDEV LENGTH' in its calculation.
7. Volume Condition
Volume indicates the number of participants in this war between bulls and bears, the more volume the more likely the price will move in favor of the trend. A low trading volume indicates a lower number of participants and interest in the instrument in question. Low volumes may reveal weakness behind a price movement.
With this condition, those signals whose volume is less than the volume SMA for a period 'SMA VOLUME LENGTH' multiplied by a factor 'VOLUME FACTOR' are filtered. In addition, it determines the leverage used, the more volume , the more participants, the more probability that the price will move in our favor, that is, we can use more leverage. The leverage in this script is determined by how many times the volume is above the SMA line.
The maximum leverage is 8.
8. Bollinger Bands
This indicator was created by John Bollinger and consists of three bands that are drawn superimposed on the price evolution graph.
The central band is a moving average, normally a simple moving average calculated with 20 periods is used. ('BB LENGTH' Number of periods of the moving average)
The upper band is calculated by adding the value of the simple moving average X times the standard deviation of the moving average. ('BB MULTIPLIER' Number of times the standard deviation of the moving average)
The lower band is calculated by subtracting the simple moving average X times the standard deviation of the moving average.
the band between the upper and lower bands contains, statistically, almost 90% of the possible price variations, which means that any movement of the price outside the bands has special relevance.
In practical terms, Bollinger bands behave as if they were an elastic band so that, if the price touches them, it has a high probability of bouncing.
Sometimes, after the entry order is filled, the price is returned to the opposite side. If price touch the Bollinger band in the same previous conditions, another order is filled in the same direction of the position to improve the average entry price, (% MINIMUM BETTER PRICE ': Minimum price for the re-entry to be executed and that is better than the price of the previous position in a given %) in this way we give the trade a chance that the Take Profit is executed before. The downside is that the position is doubled in size. 'ACTIVATE DIVIDE TP': Divide the size of the TP in half. More probability of the trade closing but less profit.
█ STOP LOSS and RISK MANAGEMENT.
A good risk management is what can make your equity go up or be liquidated.
The % risk is the percentage of our capital that we are willing to lose by operation. This is recommended to be between 1-5%.
% Risk: (% Stop Loss x % Equity per trade x Leverage) / 100
First the strategy is calculated with Stop Loss, then the risk per operation is determined and from there, the amount per operation is calculated and not vice versa.
In this script you can use a normal Stop Loss or one according to the ATR. Also activate the option to trigger it earlier if the risk percentage is reached. '% RISK ALLOWED' wich is calculated according with: '%EQUITY ON EACH ENTRY'. Only works with Stop Loss on 'NORMAL' or 'BOTH' mode.
'STOP LOSS CONFIRMED': The Stop Loss is only activated if the closing of the previous bar is in the loss limit condition. It's useful to prevent the SL from triggering when they do a ‘pump’ to sweep Stops and then return the price to the previous state.
█ ALERTS
There is an alert for each leverage, therefore a maximum of 8 alerts can be set for 'long' and 8 for 'short', plus an alert to close the trade with Take Profit or Stop Loss in market mode. You can also place Take Profit limit and Stop Loss limit orders a few seconds after filling the position entry order.
- 'MAXIMUM LEVERAGE': It is the maximum allowed multiplier of the % quantity entered on each entry for 1X according to the volume condition.
- 'ADVANCE ALERTS': There is always a time delay from when the alert is triggered until it reaches the exchange and can be between 1-15 seconds. With this parameter, you can advance the alert by the necessary seconds to activate it earlier. In this way it can be synchronized with the exchange so that the execution time of the entry order to the position coincides with the opening of the bar.
The settings are for Bitcoin at Binance Futures (BTC: USDTPERP) in 15 minutes.
For other pairs and other timeframes, the settings have to be adjusted again. And within a month, the settings will be different because we all know the market and the trend are changing.

888 BOT #backtest█ 888 BOT #backtest (open source)
This is an Expert Advisor 'EA' or Automated trading script for ‘longs’ and ‘shorts’, which uses only a Take Profit or, in the worst case, a Stop Loss to close the trade.
It's a much improved version of the previous ‘Repanocha’. It doesn`t use 'Trailing Stop' or 'security()' functions (although using a security function doesn`t mean that the script repaints) and all signals are confirmed, therefore the script doesn`t repaint in alert mode and is accurate in backtest mode.
Apart from the previous indicators, some more and other functions have been added for Stop-Loss, re-entry and leverage.
It uses 8 indicators, (many of you already know what they are, but in case there is someone new), these are the following:
1. Jurik Moving Average
It's a moving average created by Mark Jurik for professionals which eliminates the 'lag' or delay of the signal. It's better than other moving averages like EMA , DEMA , AMA or T3.
There are two ways to decrease noise using JMA . Increasing the 'LENGTH' parameter will cause JMA to move more slowly and therefore reduce noise at the expense of adding 'lag'
The 'JMA LENGTH', 'PHASE' and 'POWER' parameters offer a way to select the optimal balance between 'lag' and over boost.
Green: Bullish , Red: Bearish .
2. Range filter
Created by Donovan Wall, its function is to filter or eliminate noise and to better determine the price trend in the short term.
First, a uniform average price range 'SAMPLING PERIOD' is calculated for the filter base and multiplied by a specific quantity 'RANGE MULTIPLIER'.
The filter is then calculated by adjusting price movements that do not exceed the specified range.
Finally, the target ranges are plotted to show the prices that will trigger the filter movement.
Green: Bullish , Red: Bearish .
3. Average Directional Index ( ADX Classic) and ( ADX Masanakamura)
It's an indicator designed by Welles Wilder to measure the strength and direction of the market trend. The price movement is strong when the ADX has a positive slope and is above a certain minimum level 'ADX THRESHOLD' and for a given period 'ADX LENGTH'.
The green color of the bars indicates that the trend is bullish and that the ADX is above the level established by the threshold.
The red color of the bars indicates that the trend is down and that the ADX is above the threshold level.
The orange color of the bars indicates that the price is not strong and will surely lateralize.
You can choose between the classic option and the one created by a certain 'Masanakamura'. The main difference between the two is that in the first it uses RMA () and in the second SMA () in its calculation.
4. Parabolic SAR
This indicator, also created by Welles Wilder, places points that help define a trend. The Parabolic SAR can follow the price above or below, the peculiarity that it offers is that when the price touches the indicator, it jumps to the other side of the price (if the Parabolic SAR was below the price it jumps up and vice versa) to a distance predetermined by the indicator. At this time the indicator continues to follow the price, reducing the distance with each candle until it is finally touched again by the price and the process starts again. This procedure explains the name of the indicator: the Parabolic SAR follows the price generating a characteristic parabolic shape, when the price touches it, stops and turns ( SAR is the acronym for 'stop and reverse'), giving rise to a new cycle. When the points are below the price, the trend is up, while the points above the price indicate a downward trend.
5. RSI with Volume
This indicator was created by LazyBear from the popular RSI .
The RSI is an oscillator-type indicator used in technical analysis and also created by Welles Wilder that shows the strength of the price by comparing individual movements up or down in successive closing prices.
LazyBear added a volume parameter that makes it more accurate to the market movement.
A good way to use RSI is by considering the 50 'RSI CENTER LINE' centerline. When the oscillator is above, the trend is bullish and when it is below, the trend is bearish .
6. Moving Average Convergence Divergence ( MACD ) and ( MAC-Z )
It was created by Gerald Appel. Subsequently, the histogram was added to anticipate the crossing of MA. Broadly speaking, we can say that the MACD is an oscillator consisting of two moving averages that rotate around the zero line. The MACD line is the difference between a short moving average 'MACD FAST MA LENGTH' and a long moving average 'MACD SLOW MA LENGTH'. It's an indicator that allows us to have a reference on the trend of the asset on which it is operating, thus generating market entry and exit signals.
We can talk about a bull market when the MACD histogram is above the zero line, along with the signal line, while we are talking about a bear market when the MACD histogram is below the zero line.
There is the option of using the MAC-Z indicator created by LazyBear, which according to its author is more effective, by using the parameter VWAP ( volume weighted average price ) 'Z-VWAP LENGTH' together with a standard deviation 'STDEV LENGTH' in its calculation.
7. Volume Condition
Volume indicates the number of participants in this war between bulls and bears, the more volume the more likely the price will move in favor of the trend. A low trading volume indicates a lower number of participants and interest in the instrument in question. Low volumes may reveal weakness behind a price movement.
With this condition, those signals whose volume is less than the volume SMA for a period 'SMA VOLUME LENGTH' multiplied by a factor 'VOLUME FACTOR' are filtered. In addition, it determines the leverage used, the more volume , the more participants, the more probability that the price will move in our favor, that is, we can use more leverage. The leverage in this script is determined by how many times the volume is above the SMA line.
The maximum leverage is 8.
8. Bollinger Bands
This indicator was created by John Bollinger and consists of three bands that are drawn superimposed on the price evolution graph.
The central band is a moving average, normally a simple moving average calculated with 20 periods is used. ('BB LENGTH' Number of periods of the moving average)
The upper band is calculated by adding the value of the simple moving average X times the standard deviation of the moving average. ('BB MULTIPLIER' Number of times the standard deviation of the moving average)
The lower band is calculated by subtracting the simple moving average X times the standard deviation of the moving average.
the band between the upper and lower bands contains, statistically, almost 90% of the possible price variations, which means that any movement of the price outside the bands has special relevance.
In practical terms, Bollinger bands behave as if they were an elastic band so that, if the price touches them, it has a high probability of bouncing.
Sometimes, after the entry order is filled, the price is returned to the opposite side. If price touch the Bollinger band in the same previous conditions, another order is filled in the same direction of the position to improve the average entry price, (% MINIMUM BETTER PRICE ': Minimum price for the re-entry to be executed and that is better than the price of the previous position in a given %) in this way we give the trade a chance that the Take Profit is executed before. The downside is that the position is doubled in size. 'ACTIVATE DIVIDE TP': Divide the size of the TP in half. More probability of the trade closing but less profit.
█ STOP LOSS and RISK MANAGEMENT.
A good risk management is what can make your equity go up or be liquidated.
The % risk is the percentage of our capital that we are willing to lose by operation. This is recommended to be between 1-5%.
% Risk: (% Stop Loss x % Equity per trade x Leverage) / 100
First the strategy is calculated with Stop Loss, then the risk per operation is determined and from there, the amount per operation is calculated and not vice versa.
In this script you can use a normal Stop Loss or one according to the ATR. Also activate the option to trigger it earlier if the risk percentage is reached. '% RISK ALLOWED'
'STOP LOSS CONFIRMED': The Stop Loss is only activated if the closing of the previous bar is in the loss limit condition. It's useful to prevent the SL from triggering when they do a ‘pump’ to sweep Stops and then return the price to the previous state.
█ BACKTEST
The objective of the Backtest is to evaluate the effectiveness of our strategy. A good Backtest is determined by some parameters such as:
- RECOVERY FACTOR: It consists of dividing the 'net profit' by the 'drawdown’. An excellent trading system has a recovery factor of 10 or more; that is, it generates 10 times more net profit than drawdown.
- PROFIT FACTOR: The ‘Profit Factor’ is another popular measure of system performance. It's as simple as dividing what win trades earn by what loser trades lose. If the strategy is profitable then by definition the 'Profit Factor' is going to be greater than 1. Strategies that are not profitable produce profit factors less than one. A good system has a profit factor of 2 or more. The good thing about the ‘Profit Factor’ is that it tells us what we are going to earn for each dollar we lose. A profit factor of 2.5 tells us that for every dollar we lose operating we will earn 2.5.
- SHARPE: (Return system - Return without risk) / Deviation of returns.
When the variations of gains and losses are very high, the deviation is very high and that leads to a very poor ‘Sharpe’ ratio. If the operations are very close to the average (little deviation) the result is a fairly high 'Sharpe' ratio. If a strategy has a 'Sharpe' ratio greater than 1 it is a good strategy. If it has a 'Sharpe' ratio greater than 2, it is excellent. If it has a ‘Sharpe’ ratio less than 1 then we don't know if it is good or bad, we have to look at other parameters.
- MATHEMATICAL EXPECTATION: (% winning trades X average profit) + (% losing trades X average loss).
To earn money with a Trading system, it is not necessary to win all the operations, what is really important is the final result of the operation. A Trading system has to have positive mathematical expectation as is the case with this script: ME = (0.87 x 30.74$) - (0.13 x 56.16$) = (26.74 - 7.30) = 19.44$ > 0
The game of roulette, for example, has negative mathematical expectation for the player, it can have positive winning streaks, but in the long term, if you continue playing you will end up losing, and casinos know this very well.
PARAMETERS
'BACKTEST DAYS': Number of days back of historical data for the calculation of the Backtest.
'ENTRY TYPE': For '% EQUITY' if you have $ 10,000 of capital and select 7.5%, for example, your entry would be $ 750 without leverage. If you select CONTRACTS for the 'BTCUSDT' pair, for example, it would be the amount in 'Bitcoins' and if you select 'CASH' it would be the amount in $ dollars.
'QUANTITY (LEVERAGE 1X)': The amount for an entry with X1 leverage according to the previous section.
'MAXIMUM LEVERAGE': It's the maximum allowed multiplier of the quantity entered in the previous section according to the volume condition.
The settings are for Bitcoin at Binance Futures (BTC: USDTPERP) in 15 minutes.
For other pairs and other timeframes, the settings have to be adjusted again. And within a month, the settings will be different because we all know the market and the trend are changing.

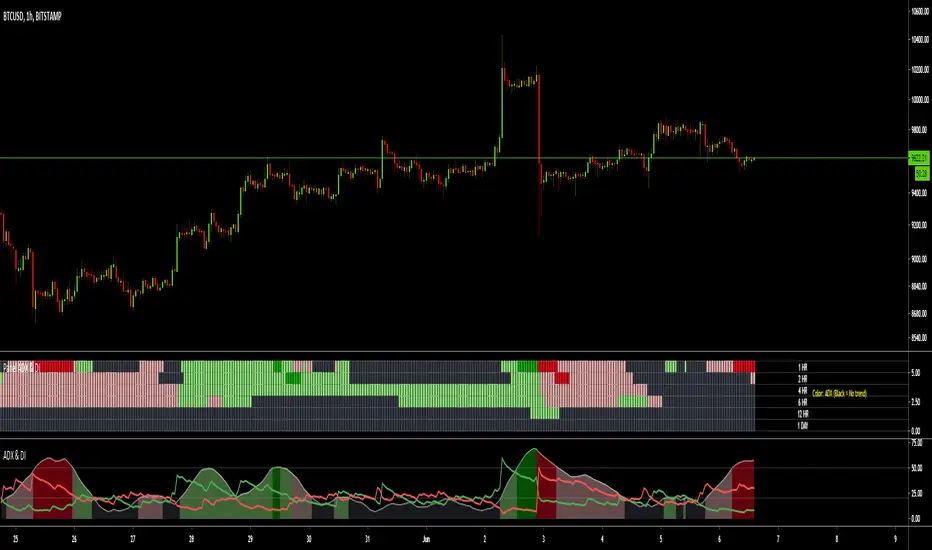
MTF ADX & DI - Monitoring PanelMonitoring panel showing the ADX (Average Directional Index) & DMI (Directional Movement Index) as color code for 6 different timeframes.
This gives a very easy overview on the current state of the market and if it is trending.
- ADX basically describes the strength of a Trend
- DMI give indication on the direction of the trend, usually shown as +DI and -DI
Meanings of the Colors:
ADX is below Low Threshold (no trend) : Black
ADX is above Low Threshold and DI is positive (weak bullish trend) : Light Green
ADX is above High Threshold and DI is positive (strong bullish trend) : Dark Green
ADX is above Low Threshold and DI is negative (weak bearish trend) : Light Red
ADX is above High Threshold and DI is negative (strong bearish trend) : Dark Red
- Low Threshold (default = 20) and High Threshold (default = 50) can be changed in the settings
- Timeframes can be changed, but the description labels are currently hardcoded - if you want to change it, just copy the script and change them
- Currently there are two additional timeframes commented in the code - if you want to use them, just copy the script and uncomment them
Have fun and as always I am open for constructive feedback.
Cheers!
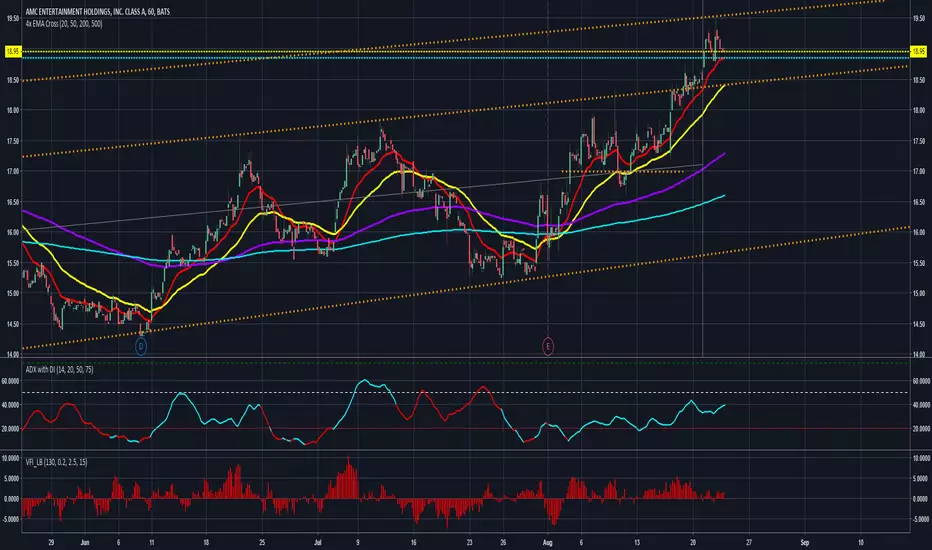
Colored ADX with DI+/- and thresholdsAverage Directional Index ( ADX )
Based off of MasaNakamura's implementation, modified to show high & super-high momentum thresholds. In addition, coloring the trend line by the prevailing trend direction from the DI (Red if down, Green if up) allows you to remove the DI if you want to reduce chart clutter!
"The Average Directional Index (ADX), Minus Directional Indicator (-DI) and Plus Directional Indicator (+DI) represent a group of directional movement indicators that form a trading system developed by Welles Wilder....
The Plus Directional Indicator (+DI) and Minus Directional Indicator (-DI) are derived from smoothed averages of these differences, and measure trend direction over time. These two indicators are often referred to collectively as the Directional Movement Indicator (DMI).
The Average Directional Index (ADX) is in turn derived from the smoothed averages of the difference between +DI and -DI, and measures the strength of the trend (regardless of direction) over time.
Using these three indicators together, chartists can determine both the direction and strength of the trend....
At its most basic, the Average Directional Index (ADX) can be used to determine if a security is trending or not. This determination helps traders choose between a trend-following system or a non-trend-following system. Wilder suggests that a strong trend is present when ADX is above 20..."
See
www.investopedia.com
stockcharts.com
for detail.
NASDAQ:AMD
There are more plans to add vertical lines on crosses and divergence indicators so stay tuned!
Thank you and good trading!
Average Directional Index with DI SpreadThis indicator converts conventional triple lined ADX, DI+ and DI- into two lines. First line is the
original ADX line and second line is obtained by subtracting DI- from DI+ which named DI Spread(DIS)
If ADX is greater than 20 there is a trend and if greater than 40 there is a strong trend but ADX does not tell
the trend direction
To determine trend direction, DIS can be used with ADX; Sımply; If DIS is greater than 0, it is an uptrend and If DIS
is less than 0, it is a downtrend.
To sum up;
If ADX is greater than 20 and especially greater than 40 with positive DIS value, this implies an uptrend.
If ADX is greater than 20 and especially greater than 40 with negative DIS value, this implies a downtrend.
*Because of coloration and reference levels used, this indicator is really simple and efficient to analyze trend direction.

Kay_BBandsV3This is the 3rd version of Kay_BBands.
When +DI (Directional Index ) is above -DI , then Upper band will be visible and vice-versa.
This is when the ADX is above the threshold. 28 is the default in this version. I found its more appealing in 5M time frame.
BLUE - ADX under 10
GREEN - Uptrend, ADX over 10
RED - Downtrend, ADX over 10
Use it with another band with setting 20, 0.6 deviation. Prices keeping above or below the 2nd bands upper or lower bounds shows trending conditions.
I didn't know how to update the old script so published it again.
Changes - :
1) Updated default settings for the indicator
2) ADX setting are now DI (28), ADX (10), adx level to check is 10.
3) IMPORTANT one - When DI is up/down, lower/upper band will also have color (more visible that way.)
Play around the settings.. It really eliminates extra indicator checking visually... Please like if you think idea is good.

Next Candle PredictorAdvanced TradingView Indicator for Precise Buy and Sell Signals
Overview:
The Predicta Futures - Next Candle Predictor is a cutting-edge TradingView indicator designed to forecast the next candle's direction in futures and cryptocurrency markets. Leveraging a multi-indicator confluence strategy, this tool provides traders with actionable long and short prediction percentages, enhanced by dynamic ADX-based thresholds and visual projection candles. Ideal for scalping, day trading, or swing trading on platforms like MEXC or Binance futures, it combines Supertrend, MACD, RSI, Stochastic, ADX, and volume analysis to deliver high-probability buy and sell signals while minimizing false positives.
Key Features:
* Multi-Indicator Confluence Scoring: Integrates Supertrend for trend direction, EMAs (8, 21, 50) for alignment, MACD for momentum crossovers, RSI for overbought/oversold conditions, Stochastic for divergence detection, ADX for trend strength, and volume ratios for confirmation. A customizable confluence score (0-6) ensures signals meet user-defined criteria, reducing whipsaws in volatile markets.
* Dynamic Prediction Thresholds: ADX-driven adjustments lower the required prediction percentage (e.g., 60% in strong trends) for "PERFECT TIME" entries, adapting to market conditions like ranging or trending phases.
* Visual Analysis Table: A sleek, color-coded dashboard displays progress bars for each indicator, prediction percentages, and status (e.g., "PERFECT TIME" or "WAIT"). Supports long and short analyses with intuitive ASCII bars for quick scans.
* Projection Candles: Simulates potential next-candle outcomes with volatility-scaled (via Bollinger Bands width) green long and red short candles, aiding in visualizing price targets.
Buy/Sell Signals and Alerts: Generates labeled "BUY" and "SELL" arrows on EMA crossovers within confirmed trends, with separate alerts for basic signals and high-confluence "PERFECT TIME" opportunities.
* Customizable Inputs: Adjust ATR periods, Supertrend factors, minimum confluence scores, and volume ratios to tailor the indicator for stocks, forex, or crypto perpetual futures.
How It Works:
This TradingView script calculates long and short scores using weighted contributions from key indicators, normalizing them into prediction percentages. A confluence check—factoring trend, EMA alignment, MACD, Stochastic, volume, and ADX—triggers "PERFECT TIME" only when conditions align robustly. For example:
In a downtrend (Supertrend red), with bearish MACD and Stochastic, and sufficient volume, the indicator highlights short opportunities.
Dynamic thresholds ensure aggressive entries in strong trends (ADX >25) and conservative ones in weak trends.
Backtested for reliability, it excels in identifying reversals and continuations, making it a must-have for traders seeking an edge in futures trading strategies.
Usage Instructions:
1. Add the indicator to your TradingView chart.
2. Customize settings via the inputs panel (e.g., set minConfluence to 5 for stricter signals).
3. Monitor the analysis table for predictions and confluence scores.
4. Act on "BUY/SELL" labels or "PERFECT TIME" alerts, combining with your risk management.
5. Enable projection candles for visual forecasting of the next bar.
Compatible with all timeframes, from 1-minute scalping to daily swings. Note: This is not financial advice; always verify signals with additional analysis.
Rate and review if it boosts your trades!
Thank you!

Trend Vector Pro v2.0Trend Vector Pro v2.0
👨💻 Developed by: Mohammed Bedaiwi
💡 Strategy Overview & Coherence
Trend Vector Pro (TVPro) is a momentum-based trend & reversal strategy that uses a custom smoothed oscillator, an optional ADX filter, and classic Pivot Points to create a single, coherent trading framework.
Instead of stacking random indicators, TVPro is built around these integrated components:
A custom momentum engine (signal generation)
An optional ADX filter (trend quality control)
Daily Pivot Points (context, targets & S/R)
Swing-based “Golden Bar” trailing stops (trade management)
Optional extended bar detection (overextension alerts)
All parts are designed to work together and are documented below to address originality & usefulness requirements.
🔍 Core Components & Justification
1. Custom Momentum Engine (Main Signal Source)
TVPro’s engine is a custom oscillator derived from the bar midpoint ( hl2 ), similar in spirit to the Awesome Oscillator but adapted and fully integrated into the strategy. It measures velocity and acceleration of price, letting the script distinguish between strong impulses, weakening trends, and pure noise.
2. ADX Filter (Trend Strength Validation – Optional)
Uses Average Directional Index (ADX) as a gatekeeper.
Why this matters: This prevents the strategy from firing signals in choppy, non-trending environments (when ADX is below the threshold) and keeps trades focused on periods of clear directional strength.
3. Classic Pivot Points (Context & Targets)
Calculates Daily Pivot Points ( PP, R1-R3, S1-S3 ) via request.security() using prior session data.
Why this matters: Momentum gives the signal, ADX validates the environment, and Pivots add external structure for risk and target planning. This is a designed interaction, not a random mashup.
🧭 Trend State Logic (5-State Bar Coloring)
The strategy uses the momentum's value + slope to define five states, turning the chart into a visual momentum map:
🟢 STRONG BULL (Bright Green): Momentum accelerating UP. → Strong upside impulse.
🌲 WEAK BULL (Dark Green): Momentum decelerating DOWN (while positive). → Pullback/pause zone.
🔴 STRONG BEAR (Bright Red): Momentum accelerating DOWN. → Strong downside impulse.
🍷 WEAK BEAR (Dark Red): Momentum decelerating UP (while negative). → Rally/short-covering zone.
🔵 NEUTRAL / CHOP (Cyan): Momentum is near zero (based on noise threshold). → Consolidation / low volatility.
🎯 Signal Logic Modes
TVPro provides two selectable entry styles, controlled by input:
Reversals Only (Cleaner Mode – Default): Targets trend flips. Entry triggers when the current state is Bullish (or Bearish) and the previous state was not. This reduces noise and over-trading.
All Strong Pulses (Aggressive Mode): Targets acceleration phases. Entry triggers when the bar turns to STRONG BULL or STRONG BEAR after any other state. This mode produces more trades.
📌 Risk Management Tools
🟡 Golden Bars – Trailing Stops: Yellow “Trail” Arrows mark confirmed Swing Highs/Lows. These are used as logical trailing stop levels based on market structure.
Extended Bars: Detects when price closes outside a 2-standard-deviation channel, flagging overextension where a pullback is more likely.
Pivot Points: Used as external targets for Take Profit and structural stop placement.
⚙️ Strategy Defaults (Crucial for Publication Compliance)
To keep backtest results realistic and in line with House Rules, TVPro is published with the following fixed default settings:
Order Size: 5% of equity per trade ( default_qty_value = 5 )
Commission: 0.04% per order ( commission_value = 0.04 )
Slippage: 2 ticks ( slippage = 2 )
Initial Capital: 10,000
📘 How to Trade with Trend Vector Pro
Entry: Take Long when a Long signal appears and confirm the bar is Green (Bull state). Short for Red (Bear state).
Stop Loss: Place the initial SL near the latest swing High/Low, or near a relevant Pivot level.
Trade Management: Follow Golden (Trail) Arrows to trail your stop behind structure.
Exits: Exit when: the trailing stop is hit, Price reaches a major Pivot level, or an opposite signal prints.
🛑 Disclaimer
This script is for educational purposes only and does not constitute financial advice. Past performance does not guarantee future results. Always forward-test and use proper risk management before applying any strategy to live trading.

ADX_RDADX_RD - Average Directional Index (Ryan DeBraal)
This script plots a refined version of the **ADX (Average Directional Index)**,
used to measure trend strength regardless of trend direction. It includes
custom smoothing, modified DM (Directional Movement) logic, dynamic coloring,
and a built-in 20-level threshold.
FEATURES
- Calculates +DI, –DI, and ADX using standard Wilder smoothing (RMA).
- Signal color turns **white** when ADX < 20 (low-trend or choppy conditions).
- Signal color turns **blue** when ADX >= 20 (trend strengthening).
- Horizontal dotted reference line at **20**, a widely used threshold:
ADX < 20 → weak or ranging market
ADX > 20 → strengthening trend
- Works on all timeframes, supports custom smoothing lengths.
PURPOSE
This indicator helps identify when a market is trending vs when it is flat.
It does not indicate direction by itself — only the strength of the move —
making it ideal for confirming breakout setups, trend-following entries,
and filtering out low-probability trades during chop.

The Oracle: Dip & Top Adaptive Sniper [Hakan Yorganci]█ OVERVIEW
The Oracle: Dip & Top Adaptive Sniper is a precision-focused trend trading strategy designed to solve the biggest problem in swing trading: Timing.
Most trend-following strategies chase price ("FOMO"), buying when the asset is already overextended. The Oracle takes a different approach. It adopts a "Sniper" mentality: it identifies a strong macro trend but patiently waits for a Mean Reversion (pullback) to execute an entry at a discounted price.
By combining the structural strength of Moving Averages (SMA 50/200) with the momentum precision of RSI and the volatility filtering of ADX, this script filters out noise and targets high-probability setups.
█ HOW IT WORKS
This strategy operates on a strictly algorithmic protocol known as "The Yorganci Protocol," which involves three distinct phases: Filter, Target, and Execute.
1. The Macro Filter (Trend Identification)
* SMA 200 Rule: By default, the strategy only scans for buy signals when the price is trading above the 200-period Simple Moving Average. This ensures we are always trading in the direction of the long-term bull market.
* Adaptive Switch: A new feature allows users to toggle the Only Buy Above SMA 200? filter OFF. This enables the strategy to hunt for oversold bounces (dead cat bounces) even during bearish or neutral market structures.
2. The Volatility Filter (ADX Integration)
* Sideways Protection: One of the main weaknesses of moving average strategies is "whipsaw" losses during choppy, ranging markets.
* Solution: The Oracle utilizes the ADX (Average Directional Index). It will BLOCK any trade entry if the ADX is below the threshold (Default: 20). This ensures capital is only deployed when a genuine trend is present.
3. The Sniper Entry (Buying the Dip)
* Instead of buying on breakout strength (e.g., RSI > 60), The Oracle waits for the RSI Moving Average to dip into the "Value Zone" (Default: 45) and cross back up. This technique allows for tighter stops and higher Risk/Reward ratios compared to traditional breakout systems.
█ EXIT STRATEGY
The Oracle employs a dynamic dual-exit mechanism to maximize gains and protect capital:
* Take Profit (The Peak): The strategy monitors RSI heat. When the RSI Moving Average breaches the Overbought Threshold (Default: 75), it signals a "Take Profit", securing gains near the local top before a potential reversal.
* Stop Loss (Trend Invalidated): If the market structure fails and the price closes below the 50-period SMA, the position is immediately closed to prevent deep drawdowns.
█ SETTINGS & CONFIGURATION
* Moving Averages: Fully customizable lengths for Support (SMA 50) and Trend (SMA 200).
* Trend Filter: Checkbox to enable/disable the "Bull Market Only" rule.
* RSI Thresholds:
* Sniper Buy Level: Adjustable (Default: 45). Lower values = Deeper dips, fewer trades.
* Peak Sell Level: Adjustable (Default: 75). Higher values = Longer holds, potentially higher profit.
* ADX Filter: Checkbox to enable/disable volatility filtering.
█ BEST PRACTICES
* Timeframe: Designed primarily for 4H (4-Hour) charts for swing trading. It can also be used on 1H for more frequent signals.
* Assets: Highly effective on trending assets such as Bitcoin (BTC), Ethereum (ETH), and high-volume Altcoins.
* Risk Warning: This strategy is designed for "Long Only" spot or leverage trading. Always use proper risk management.
█ CREDITS
* Original Concept: Inspired by the foundational work of Murat Besiroglu (@muratkbesiroglu).
* Algorithm Development & Enhancements: Developed by Hakan Yorganci (@hknyrgnc).
* Modifications include: Integration of ADX filters, Mean Reversion entry logic (RSI Dip), and Dynamic Peak Profit taking.

Khusan Pullback & Mean-Reversion (Manual ADX, Clean)Description
The indicator combines two logics in one tool:
Trend Pullback: Entries in the direction of the dominant trend after a short-term pullback to the EMA.
Return to the mean (Mean-Reversal): countertrend trades from external Bollinger bands with an RSI filter.
Key Features
Manual ADX (Wilder calculation): more precisely, it controls the strength of the trend without hidden smoothing.
There is a clear separation of market modes: the background of the chart highlights the condition: trend up/down or sideways (range).
Signal tags: Long TPB / Short TPB for pullbacks in the trend, Long MR / Short MR for a return to the average.
A minimum of “noise": neat colors, clear captions, without unnecessary graphics.
How to read signals
Trend Pullback
Long TPB — ADX ≥ threshold, price returns above fast EMA, RSI > 45.
Short TPB — ADX ≥ threshold, price goes below fast EMA, RSI < 55.
Mean-Reversion
Long MR — sideways (ADX < threshold), price below lower BB, RSI < 30, confirmation of reversal.
Short MR — sideways (ADX < threshold), price above upper BB, RSI > 70, reversal confirmation.
Parameters (Inputs)
EMA fast / EMA slow — fast and slow EMA (default 20/50).
ADX length / threshold — period and trend strength threshold.
BB length / mult — period and Bollinger Bands multiplier.
RSI length — RSI period.
Show labels/background — enable mode signatures and highlighting.
Recommendations for use
Timeframes: from M15 to H4. On lower TF, add a filter by the higher trend (e.g. H1/H4 EMA).
Instruments: XAUUSD, FX majors, indices, liquid futures and crypto pairs.
Risk management: for TPB, use SL behind the local swing extremum/below the EMA zone; for MR, use SL behind the external BB.
Filters: avoid entering against strong news; prioritize MR when volatility is low, and TPB when volatility is high.
Alerts
Create standard alerts based on the appearance of Long/Short TPB and Long/Short MR labels — the indicator provides clear conditions for auto-entry/notifications.
Important
The indicator is not

T-Virus Sentiment [hapharmonic]🧬 T-Virus Sentiment: Visualize the Market's DNA
Remember the iconic T-Virus vial from the first Resident Evil? That powerful, swirling helix of potential has always fascinated me. It sparked an idea: what if we could visualize the market's underlying health in a similar way? What if we could capture the "genetic code" of market sentiment and contain it within a dynamic, 3D indicator? This project is the result of that idea, brought to life with Pine Script.
The indicator's main goal is to measure the strength and direction of market sentiment by analyzing the "genetic code" of price action through a variety of trusted indicators. The result is displayed as a liquid level within a DNA helix, a bubble density representing buying pressure, and a T-Virus mascot that reflects the overall mood.
🧐 Core Concept: How It Works
The primary output of the indicator is the "Active %" gauge you see on the right side of the vial. This percentage represents the overall sentiment score, calculated as an average from 7 different technical analysis tools. Each tool is analyzed on every bar and assigned a score from 1 (strong bearish pressure) to 5 (strong bullish potential).
In this indicator, we re-imagine market dynamics through the lens of a viral outbreak. A strong bear market is like a virus taking hold, pulling all technical signals down into a state of weakness. Conversely, a powerful bull market is like an antiviral serum ; positive signals rise and spread toward the top of the vial, indicating that the system is being injected with strength.
This is not just another line on a chart. It's a comprehensive sentiment dashboard designed to give an immediate, at-a-glance understanding of the confluence between 7 classic technical indicators. The incredible 3D model of the vial itself was inspired by a design concept found here .
⚛️ The 4 Core Elements of T-Virus Sentiment
These four elements work in harmony to give a complete, multi-faceted picture of market sentiment. Each component tells a different part of the story.
The Virus Mascot: An instant emotional cue. This character provides the quickest possible read on the overall market mood, combining sentiment with volume pressure.
The Antiviral Serum Level: The main quantitative output. This is the liquid level in the DNA helix and the percentage gauge on the right, representing the average sentiment score from all 7 indicators.
Buy Pressure & Bubble Density: This visualizes volume flow. The density of bubbles represents the intensity of accumulation (buying) versus distribution (selling). It's the "power" behind the move.
The Signal Distribution: This shows the confluence (or dispersion) of sentiment. Are all signals bullish and clustered at the top, or are they scattered, indicating a conflicted market? The position of the indicator labels is crucial, as each is assigned to one of five distinct zones:
Base Bottom: The market is at its weakest. Signals here suggest strong bearish control and distribution.
Lower Zone: The market is still bearish, but signals may be showing early signs of accumulation or bottoming.
Neutral Core (Center): A state of balance or sideways consolidation. The market is waiting for a new direction.
Upper Zone: Bullish momentum is becoming clear. Signals are strengthening and showing bullish control.
Top Cap: The market is "heating up" with strong bullish sentiment, potentially nearing overbought conditions.
🐂🐻 The Virus Mascot: The At-a-Glance Indicator
This character acts as a shortcut to confirm market health. It combines the sentiment score with volume, preventing false confidence in a low-volume rally.
Its state is determined by a dual-check: the overall "Antiviral Serum Level" and the "Buy Pressure" must both be above 50%.
Green & Smiling: The 'all clear' signal. This means that not only is the overall technical sentiment bullish, but it's also being supported by real buying pressure. This is a sign of a healthy bull market.
Red & Angry: A warning sign. This appears if either the sentiment is weak, or a bullish sentiment is not being confirmed by buying volume. The latter could indicate a potential "bull trap" or an exhaustive move.
This mascot can be disabled from the settings page under "Virus Mascot Styling" if a cleaner look is preferred.
🫧 Bubble Density: Gauging Buy vs. Sell Pressure
The bubbles visualize the battle between buyers and sellers. There are two modes to control how this is calculated:
Mode 1: Visible Range (The 'Big Picture' View)
This default mode is best for getting a broad, contextual understanding of the current session. It dynamically analyzes the volume of every single candlestick currently visible on the screen to calculate the buy/sell pressure ratio. It answers the question: "Over the entire period I'm looking at, who is in control?" As you zoom in or out, the calculation adapts.
Mode 2: Custom Lookback (The 'Precision' View)
This mode is for traders who need to analyze short-term pressure. You can define a fixed number of recent bars to analyze, which is perfect for scalping or understanding the volume dynamics leading into a key level. It answers the question: "What is happening right now ?" In the example above, a lookback of 2 focuses only on the most recent action, clearly showing intense, immediate selling pressure (few bubbles) and a corresponding drop in the sentiment score to 29%.
ℹ️ Interactive Tooltips: Dive Deeper
We believe in transparency, not 'black box' indicators. This feature transforms the indicator from a visual aid into an active learning tool.
Simply hover the mouse over any indicator label (like EMA, OBV, etc.) to get a detailed tooltip. It will explain the specific data points and thresholds that signal met to be placed in its current zone. This helps build trust in the signals and allows users to fine-tune the indicator settings to better match their own trading style.
🎯 The Scoring Logic Breakdown
The "Antiviral Serum Level" gauge is the average score from 7 technical analysis tools. Each is graded on a 5-point scale (1=Strong Bearish to 5=Strong Bullish). Here’s a detailed, transparent look at how each "gene" is evaluated:
Relative Strength Index (RSI)
Measures momentum and overbought/oversold conditions.
Group 1 (Strong Bearish): RSI > 80 (Extreme Overbought)
Group 2 (Bearish): 70 < RSI ≤ 80 (Overbought)
Group 3 (Neutral): 30 ≤ RSI ≤ 70
Group 4 (Bullish): 20 ≤ RSI < 30 (Oversold)
Group 5 (Strong Bullish): RSI < 20 (Extreme Oversold)
Exponential Moving Averages (EMA)
Evaluates the trend's strength and structure based on the alignment of multiple EMAs (9, 21, 50, 100, 200, 250).
Group 1 (Strong Bearish): A perfect bearish sequence (9 < 21 < 50 < ...)
Group 2 (Bearish Transition): Early signs of a potential reversal (e.g., 9 > 21 but still below 50)
Group 3 (Neutral / Mixed): MAs are intertwined or showing a partial bullish sequence.
Group 4 (Bullish): A strong bullish sequence is forming (e.g., 9 > 21 > 50 > 100)
Group 5 (Strong Bullish): A perfect bullish sequence (9 > 21 > 50 > 100 > 200 > 250)
Moving Average Convergence Divergence (MACD)
Analyzes the relationship between two moving averages to gauge momentum.
Group 1 (Strong Bearish): MACD & Histogram are negative and momentum is falling.
Group 2 (Weakening Bearish): MACD is negative but the histogram is rising or positive.
Group 3 (Neutral / Crossover): A crossover event is occurring near the zero line.
Group 4 (Bullish): MACD & Histogram are positive.
Group 5 (Strong Bullish): MACD & Histogram are positive, rising strongly, and accelerating.
Average Directional Index (ADX)
Measures trend strength, not direction. The score is based on both ADX value and the dominance of DI+ vs DI-.
Group 1 (Bearish / No Trend): ADX < 20 and DI- is dominant.
Group 2 (Developing Bearish Trend): 20 ≤ ADX < 25 and DI- is dominant.
Group 3 (Neutral / Indecision): Trend is weak or DI+ and DI- are nearly equal.
Group 4 (Developing Bullish Trend): 25 ≤ ADX ≤ 40 and DI+ is dominant.
Group 5 (Strong Bullish Trend): ADX > 40 and DI+ is dominant.
Ichimoku Cloud (IKH)
A comprehensive indicator that defines support/resistance, momentum, and trend direction.
Group 1 (Strong Bearish): Price is below the Kumo, Tenkan < Kijun, and Chikou is below price.
Group 2 (Bearish): Price is inside or below the Kumo, with mixed secondary signals.
Group 3 (Neutral / Ranging): Price is inside the Kumo, often with a Tenkan/Kijun cross.
Group 4 (Bullish): Price is above the Kumo with strong primary signals.
Group 5 (Strong Bullish): All signals are aligned bullishly: price above Kumo, bullish Tenkan/Kijun cross, bullish future Kumo, and Chikou above price.
Bollinger Bands (BB)
Measures volatility and relative price levels.
Group 1 (Strong Bearish): Price is below the lower band.
Group 2 (Bearish Territory): Price is between the lower band and the basis line.
Group 3 (Neutral): Price is hovering around the basis line.
Group 4 (Bullish Territory): Price is between the basis line and the upper band.
Group 5 (Strong Bullish): Price is above the upper band.
On-Balance Volume (OBV)
Uses volume flow to predict price changes. The score is based on OBV's trend and its position relative to its moving average.
Group 1 (Strong Bearish): OBV is below its MA and falling.
Group 2 (Weakening Bearish): OBV is below its MA but showing signs of rising.
Group 3 (Neutral): OBV is very close to its MA.
Group 4 (Bullish): OBV is above its MA and rising.
Group 5 (Strong Bullish): OBV is above its MA, rising strongly, and showing signs of a volume spike.
🧭 How to Use the T-Virus Sentiment Indicator
IMPORTANT: This indicator is a sentiment dashboard , not a direct buy/sell signal generator. Its strength lies in showing confluence and providing a quick, holistic view of the market's technical health.
Confirmation Tool: Use the "Active %" gauge to confirm a trade setup from your primary strategy. For example, if you see a bullish chart pattern, a high and rising sentiment score can add confidence to your trade.
Momentum & Trend Gauge: A consistently high score (e.g., > 75%) suggests strong, established bullish momentum. A consistently low score (< 25%) suggests strong bearish control. A score hovering around 50% often indicates a ranging or indecisive market.
Divergence & Warning System: Pay attention to divergences. If the price is making new highs but the sentiment score is failing to follow or is actively decreasing, it could be an early warning sign that the underlying momentum is weakening.
⚙️ Settings & Customization
The indicator is highly customizable to fit any trading style.
Position & Anchor: Control where the vial appears on the chart.
Styling (Vial, Helix, etc.): Nearly every visual element can be color-customized.
Signals: This is where the real power is. All underlying indicator parameters (RSI length, MACD settings, etc.) can be fine-tuned to match a personal strategy. The text labels can also be disabled if the chart feels cluttered.
Enjoy visualizing the market's DNA with the T-Virus Sentiment indicator

Institutional Momentum Zones (ADX+ROC+DI+MACD+Filters)Institutional Momentum Zones (ADX + ROC + DI + MACD + Filters)
This indicator is designed to help traders visually identify Bullish, Neutral, and Bearish momentum zones on Nifty, indices, or any liquid asset, using a rules-based, institutional-style approach.
It combines multiple professional-grade momentum and trend filters into a single framework:
ADX (Average Directional Index) – Measures trend strength, filters out choppy conditions.
Directional Indicators (+DI / –DI) – Confirms whether bulls or bears are in control.
ROC (Rate of Change) – Quantifies momentum speed and direction.
MACD (optional) – Adds confirmation by checking multi-timeframe momentum alignment.
EMA Filters (optional) – Ensures price is in alignment with long-term trend bias.
Supertrend (optional) – Can be enabled for additional trend confirmation.
How it works:
Bullish Zone (Green) → Strong trend (ADX > threshold) + upward momentum (ROC > 0, +DI > –DI) + optional EMA/MACD/Supertrend confirmation.
Bearish Zone (Red) → Strong trend (ADX > threshold) + downward momentum (ROC < 0, –DI > +DI) + optional EMA/MACD/Supertrend confirmation.
Neutral Zone (Yellow) → Low trend strength (ADX < threshold) or mixed momentum signals.
Features:
Automatic background coloring for zone detection.
On-chart labels marking new zone changes.
EMA50 / EMA200 and Supertrend overlay options.
Signal markers for bullish/bearish entries.
Info panel with live ADX, ROC, DI values, and MACD histogram.
Alert conditions for zone changes (Bull, Bear, Neutral).
Best used for:
Index momentum tracking (e.g., Nifty, Bank Nifty, Dow, S&P500)
Swing trading & positional trading strategies
Filtering trades to avoid entering during low-momentum chop
Tip: For Nifty positional trading, use Daily or 4H charts with EMA & MACD filters enabled for cleaner, high-confidence signals.

RSI + ADX + ATR Combo Indicator: RSI + ADX + ATR Combo Filter
This indicator is a confluence filter tool that combines RSI, ADX, and ATR into a single, easy-to-read chart overlay. It is designed to help traders identify low-volatility, non-trending zones with balanced momentum—ideal for strategies that rely on breakouts or reversals.
🔍 Core Components:
RSI (Relative Strength Index)
Standard RSI with custom upper and lower bounds (default: 60 and 40).
Filters out extreme overbought/oversold regions and focuses on price consolidation zones.
ADX (Average Directional Index)
Measures trend strength.
When ADX is below a custom threshold (default: 20), it indicates a weak or range-bound trend.
ATR (Average True Range)
Represents volatility.
Low ATR values (default threshold: 2.5) are used to filter out high-volatility environments, helping refine entries.
🟣 Signal Logic:
A signal is highlighted with a background color when all three conditions are met:
RSI is between lower and upper bounds (e.g., 40 < RSI < 60) ✅
ADX is below the trend threshold (e.g., ADX < 20) ✅
ATR is below the volatility threshold (e.g., ATR < 2.5) ✅
These combined conditions suggest a low-volatility, low-trend strength, and balanced momentum zone—perfect for anticipating breakouts or strong directional moves.

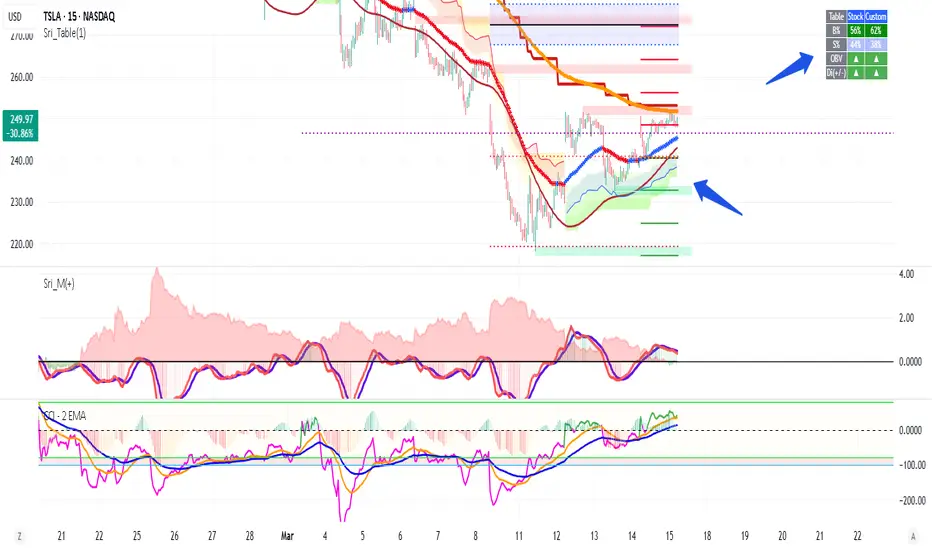
Volume +OBV + ADXVolume + OBV + ADX Table
Optimized Buyer & Seller Volume with Trend Indications
Overview:
This indicator provides a comprehensive view of market participation and trend strength by integrating Volume, On Balance Volume (OBV) trends, and ADX (Average Directional Index) signals into a visually structured table. Designed for quick decision-making, it highlights buyer and seller dominance while comparing the selected stock with another custom symbol.
Features:
✅ Buyer & Seller Volume Analysis:
Computes buyer and seller volume percentages based on market movements.
Displays daily cumulative volume statistics to assess ongoing market participation.
✅ On Balance Volume (OBV) Trends:
Identifies positive, negative, or neutral OBV trends using an advanced smoothing mechanism.
Highlights accumulation or distribution phases with colored visual cues.
✅ ADX-Based Trend Confirmation:
Evaluates Directional Indicators (DI+ and DI-) to determine the trend direction.
Uses customizable ADX settings to filter out weak trends.
Provides uptrend, downtrend, or neutral signals based on strength conditions.
✅ Custom Symbol Comparison:
Allows users to compare two different assets (e.g., a stock vs. an index or ETF).
Displays a side-by-side comparison of volume dynamics and trend strength.
✅ User-Friendly Table Display:
Presents real-time calculations in a compact and structured table format.
Uses color-coded trend signals for easier interpretation.
Recommended Usage for Best Results:
📌 Pairing this indicator with Sri_Momentum and Sri(+) Pivot will enhance accuracy and provide better trade confirmations.
📌 Adding other major indicators like RSI, CCI, etc., will further increase the probability of winning trades.
How to Use:
Select a custom symbol for comparison.
Adjust ADX settings based on market conditions.
Analyze the table to identify buyer/seller dominance, OBV trends, and ADX trend strength.
Use the combined signals to confirm trade decisions and market direction.
Best Use Cases:
🔹 Trend Confirmation – Validate breakout or reversal signals.
🔹 Volume Strength Analysis – Assess buyer/seller participation before entering trades.
🔹 Multi-Asset Comparison – Compare the behavior of two related instruments.
This indicator is ideal for traders looking to combine volume dynamics with trend-following strategies. 🚀📈
Advanced Supertrend Enhanced ADXEnhanced Supertrend ADX Indicator - Technical Documentation
Overview
The Enhanced Supertrend ADX indicator combines ADX directional strength with Supertrend trend-following capabilities, creating a comprehensive trend detection system. It's enhanced with normalization techniques and multiple filters to provide reliable trading signals.
Key Features and Components
The indicator incorporates three main components:
Core ADX and Supertrend Fusion
Uses a shorter ADX period for increased sensitivity
Integrates Supertrend signals for trend confirmation
Applies a long-term moving average for trend context
Advanced Filtering System
Volatility filter: Identifies periods of significant market movement
Momentum filter: Confirms the strength and sustainability of trends
Lateral market detection: Identifies ranging market conditions
Data Normalization
Standardizes indicator readings across different instruments
Makes signals comparable across various market conditions
Reduces extreme values and false signals
Model Assumptions
The indicator operates under several key assumptions:
Market Behavior
Markets alternate between trending and lateral phases
Strong trends correlate with increased volatility
Price momentum confirms trend strength
Market transitions follow identifiable patterns
Signal Reliability
Low ADX values indicate lateral markets
Valid signals require both volatility and momentum confirmation
Multi-filter confirmation increases signal reliability
Price normalization enhances signal quality
Trading Applications
The indicator supports different trading approaches:
Trend Trading
Strong signals when all filters align
Clear distinction between bullish and bearish trends
Momentum confirmation for trend continuation
Range Trading
Clear identification of lateral markets
Band-based trading boundaries
Reduced false breakout signals
Transition Trading
Early identification of trend-to-range transitions
Clear signals for range-to-trend transitions
Momentum-based confirmation of breakouts
Risk Considerations
Important factors to consider:
Signal Limitations
Potential delay in fast-moving markets
False signals during extreme volatility
Time frame dependency
Best Practices
Use in conjunction with other indicators
Apply proper position sizing
Focus on liquid instruments
Consider market context
Performance Characteristics
The indicator shows optimal performance under specific conditions:
Ideal Conditions
Daily timeframe analysis
Clear trending market phases
Liquid market environments
Normal volatility conditions
Challenging Conditions
Choppy market conditions
Extremely low volatility
Highly volatile markets
Illiquid instruments
Implementation Recommendations
For optimal use, consider:
Market Selection
Best suited for major markets
Requires adequate liquidity
Works well with trending instruments
Timeframe Selection
Primary: Daily charts
Secondary: 4-hour charts
Caution on lower timeframes
Risk Management
Use appropriate position sizing
Set clear stop-loss levels
Consider market volatility
Monitor overall exposure
This indicator serves as a comprehensive tool for market analysis, combining traditional technical analysis with modern filtering techniques. Its effectiveness depends on proper implementation and understanding of market conditions.

Trend with ADX/EMA - Buy & Sell SignalsThis script is designed to help traders make buy and sell decisions based on trend analysis using two key methods: ADX (Average Directional Index) and EMA (Exponential Moving Averages). Here's a breakdown in simple terms:
What Does It Do?
Identifies the Trend's Strength and Direction:
Uses the ADX indicator to determine how strong the trend is.
Compares two lines (DI+ and DI−) to identify whether the trend is moving up or down.
Generates Buy and Sell Signals:
Uses two EMAs (a fast one and a slow one) to check when the price crosses key levels, signaling a possible buy or sell opportunity.
Plots visual indicators (arrows and labels) for easy interpretation.
Color-Codes the Chart:
Highlights the background in green when the trend is bullish (uptrend).
Highlights the background in red when the trend is bearish (downtrend).
Alerts the User:
Creates alerts when specific conditions for buying or selling are met.
Key Components:
1. ADX (Trend Strength & Direction)
What is ADX?
ADX measures how strong the trend is (not the direction). Higher ADX means a stronger trend.
It also calculates two lines:
DI+: Measures upward movement strength.
DI−: Measures downward movement strength.
How It Works in the Script:
If DI+ is greater than DI−, it’s a bullish trend (upward).
If DI− is greater than DI+, it’s a bearish trend (downward).
The background turns green for an uptrend and red for a downtrend.
2. EMA (Buy and Sell Decisions)
What is EMA?
EMA is a moving average that gives more weight to recent prices. It’s used to smooth out price fluctuations.
How It Works in the Script:
The script calculates two EMAs:
Fast EMA (short-term average): Reacts quickly to price changes.
Slow EMA (long-term average): Reacts slower and shows overall trends.
When the Fast EMA crosses above the Slow EMA, it’s a signal to Buy.
When the Fast EMA crosses below the Slow EMA, it’s a signal to Sell.
These signals are marked on the chart as "Buy" and "Sell" labels.
3. Buy and Sell Alerts
The script sets up alerts for the user:
Buy Alert: When a crossover indicates a bullish signal.
Sell Alert: When a crossunder indicates a bearish signal.
Visual Elements on the Chart:
Background Colors:
Green: When the DI+ line indicates an uptrend.
Red: When the DI− line indicates a downtrend.
EMA Lines:
Green Line: Fast EMA.
Red Line: Slow EMA.
Buy/Sell Labels:
"Buy" label: Shown when the Fast EMA crosses above the Slow EMA.
"Sell" label: Shown when the Fast EMA crosses below the Slow EMA.
Why Use This Script?
Trend Analysis: Helps you quickly identify the strength and direction of the market trend.
Buy/Sell Signals: Gives clear signals to enter or exit trades based on trend and EMA crossovers.
Custom Alerts: Ensures you never miss a trading opportunity by notifying you when conditions are met.
Visual Simplicity: Makes it easy to interpret trading signals with color-coded backgrounds and labeled arrows.

RSI + ADX + ATR 18-01-25Combining RSI (Relative Strength Index), ADX (Average Directional Index), and ATR (Average True Range) creates a synergistic approach to technical analysis. This powerful trio covers momentum, trend strength, and volatility, providing comprehensive insights into market conditions. Here's a deeper exploration of their combined results:
1. Momentum Assessment with RSI
Purpose: RSI measures the speed and magnitude of recent price changes to determine overbought or oversold levels.
Benefit in Combination:
When RSI indicates overbought (above 70) or oversold (below 30) levels, it signals a potential reversal or correction.
However, these signals can be false in strongly trending markets, which is why ADX is used alongside it.
2. Trend Strength Confirmation with ADX
Purpose: ADX confirms the presence and strength of a trend.
Benefit in Combination:
If RSI shows a potential reversal but ADX indicates a strong trend (above 25), the trend is likely to continue, and RSI signals may need to be approached with caution.
Conversely, if ADX is below 20 (weak trend), RSI signals are more likely to indicate genuine reversals, as the market lacks a strong directional push.
3. Volatility Analysis with ATR
Purpose: ATR evaluates the level of price volatility.
Benefit in Combination:
High ATR values indicate volatile conditions where prices can move significantly; this helps in setting wider stop-loss levels to avoid premature exits.
Low ATR values suggest quieter markets, where tighter stop-losses and profit targets are more suitable.

ADXcellenceThis advanced trading indicator, inspired by Dr. Charles B. Schaap's book "ADXcellence: Power Trend Strategies", leverages the principles of the Average Directional Index (ADX) to help traders identify and exploit trending conditions in the market.
The ADXcellence Indicator uses multiple levels of analysis to evaluate the strength and direction of trends.
In addition to the classic ADX+DMI input settings, these features are included:
ADX Slope Signal: This parameter, controls the sensitivity of the ADX slope, which will indicate when the trend strength is increasing or decreasing.
The indicator provides three trend levels: strong trend level, trending level, and low volatility level, which can be customized to suit various trading strategies.
The color gradients for the ADX, DI+, and DI- lines are designed to visually represent the trend strength from the low volatility level to the strong trend level. The indicator also uses a dynamic background color, highlighting the periods when the ADX is rising. The color will vary depending on the dominant DI.
The ADXcellence Indicator also offers a unique feature of dynamically adjusting the fill between DI+ and DI-, with the color and fill intensity changing based on the relative value of the two.
This indicator is a powerful tool for traders who use trend-following strategies and is best used in conjunction with other technical analysis tools to confirm signals and avoid potential false signals.
Remember, no indicator is perfect and every trading strategy should include risk management and proper due diligence.
Enjoy :)

DJ Soori Trading StrategyThe strategy combines three indicators: Exponential Moving Average (EMA), Weighted Moving Average (WMA), and Average Directional Index (ADX).
The EMA and WMA are used to track the average price over different time periods.
The ADX measures the strength of a trend in the market.
The strategy generates buy signals when the EMA is higher than the WMA and the ADX is above a certain threshold. It suggests a potential uptrend.
It generates sell signals when the EMA is lower than the WMA and the ADX is above the threshold. It suggests a potential downtrend.
The strategy also considers whether the ADX is rising or falling to indicate the strength of the trend.
The EMA, WMA, and ADX values are plotted on the chart.
Buy and sell signals are shown as labels on the chart, indicating "Buy (Strong)" or "Buy (Weak)" for buy signals, and "Sell (Strong)" or "Sell (Weak)" for sell signals.

Combined Strategy Trading Bot (RSI ADX 20SMA)Trading Bot V1, This code implements a combined trading strategy that uses several indicators and strategies to make buy and sell decisions in the market. The code is written in Pine Script™, which is a programming language used in the TradingView platform. By BraelonWhitfield.Eth
The strategy uses the Average Directional Movement Index (ADX) and the Pine SuperTrend indicator to identify trends and price movements in the market. The SuperTrend indicator is a popular technical analysis tool that helps to identify the direction of the current trend and provides entry and exit points for trades.
The strategy also uses the Relative Strength Index (RSI) to identify overbought and oversold conditions in the market. The RSI is a momentum indicator that measures the speed and change of price movements in the market.
The first part of the code defines the inputs for the ADX and DI Length, which are used to calculate the ADX and DI values. The dirmov() function is used to calculate the positive and negative directional indicators (plusDM and minusDM) based on the high and low prices. The truerange variable is then calculated using the True Range (TR) formula. Finally, the plus and minus variables are calculated using the smoothed moving average of the plusDM and minusDM values.
The adx() function is then used to calculate the ADX values based on the plus and minus variables. The Pine SuperTrend indicator is defined using the pine_supertrend() function. This function uses the high-low average (hl2) and the Average True Range (ATR) to calculate the upper and lower bands for the indicator. The direction of the current trend is then determined based on whether the current price is above or below the upper or lower bands.
The RSI values are then calculated using the ta.rsi() function, with the inputs for the close price and the RSI period. The overbought and oversold conditions are defined using the OB and OS inputs, which specify the threshold values for the RSI. The upTrend and downTrend variables are defined based on the direction of the Pine SuperTrend indicator.
The next part of the code defines the 20-period Simple Moving Average (SMA) using the ta.sma() function. The os and ob variables are then calculated based on the RSI values and the OB and OS inputs. The strategy.entry() function is used to define the buy and sell orders based on the upTrend and downTrend variables, as well as the Pine SuperTrend indicator, the 20-period SMA, and the os variable.
The final part of the code defines the Channel Breakout Strategy using the ta.highest() and ta.lowest() functions to calculate the upper and lower bounds of the channel. The strategy.entry() function is then used to define the buy and sell orders based on whether the current price is above or below the upper or lower bounds.
In summary, this code implements a combined trading strategy that uses several indicators and strategies to make buy and sell decisions in the market. The strategy is designed to identify trends and price movements in the market, as well as overbought and oversold conditions, to provide entry and exit points for trades. The strategy uses the Pine SuperTrend indicator, the ADX and DI indicators, the RSI, and the 20-period SMA, as well as the Channel Breakout Strategy to make informed trading decisions.

COG SSMACD COL combo with ADX Filter [orion35]This indicator consists of a combination of indicators produced by the most valuable developers in the market.
These are: Center of Gravity (COG) and Super Smoothed MACD (SSMACD) shared by @KivancOzbilgic and Center of Linearity (COL) shared by @alexgrover
I produced this indicator by writing new conditions that compare the signals given by these indicators with each other. I re-coded the change in the thickness of the cloud from the COL indicator as the middle horizontal line with varying color intensity and type. I have provided options for switching between these three indicators when desired.
Note: The strongest signals in the indicator are the blue colored triangles. Moderately strong ones are yellow signals. White colored signals are considered as the weakest signals.
Some minor fixes:
Some confusing words were thrown in the alarms section,
Added new alarm codes for any Triple or Double signals.
Major changes have been made with this update.
It is very important to know the direction and strength of the trend in financial markets. Therefore, ADX (Average Directional movement index) was developed by J. Welles Wilder in 1978 as an indicator of the trend strength in the prices of a financial instrument.
Especially in sideways markets, most indicators produce many false signals. However, these signals can be filtered with the ADX indicator. The price is considered sideways when the ADX is less than 20 as the threshold value.
With this update,
ADX filter can be activated when desired, and signals can be filtered flexibly according to the "threshold" value determined by the user. When the ADX filter is active, it will also reflect on the alarm conditions. Therefore, if an alarm is to be set according to the ADX filter, the filter must be activated first.
The colors of the lines and signals have been made changeable.
The visual level and thickness of the COL line has been made adjustable.
With this update, signals can be filtered according to the MavilimW indicator developed by @KivancOzbilgic
Filter Methods:
Normal: If the price is below the BlueW line, "bull" signals are filtered out, and above "bear" signals are filtered out.
Reverse : Applies the opposite of the normal method.
Fixed some visual bugs in switching between indicators.
