Relative Volume at Time█ OVERVIEW
This indicator calculates relative volume, which is the ratio of present volume over an average of past volume.
It offers two calculation modes, both using a time reference as an anchor.
█ CONCEPTS
Calculation modes
The simplest way to calculate relative volume is by using the ratio of a bar's volume over a simple moving average of the last n volume values.
This indicator uses one of two, more subtle ways to calculate both values of the relative volume ratio: current volume:past volume .
The two calculations modes are:
1 — Cumulate from Beginning of TF to Current Bar where:
current volume = the cumulative volume since the beginning of the timeframe unit, and
past volume = the mean of volume during that same relative period of time in the past n timeframe units.
2 — Point-to-Point Bars at Same Offset from Beginning of TF where:
current volume = the volume on a single chart bar, and
past volume = the mean of volume values from that same relative bar in time from the past n timeframe units.
Timeframe units
Timeframe units can be defined in three different ways:
1 — Using Auto-steps, where the timeframe unit automatically adjusts to the timeframe used on the chart:
— A 1 min timeframe unit will be used on 1sec charts,
— 1H will be used for charts at 1min and less,
— 1D will be used for other intraday chart timeframes,
— 1W will be used for 1D charts,
— 1M will be used for charts at less than 1M,
— 1Y will be used for charts at greater or equal than 1M.
2 — As a fixed timeframe that you define.
3 — By time of day (for intraday chart timeframes only), which you also define. If you use non-intraday chart timeframes in this mode, the indicator will switch to Auto-steps.
Relative Relativity
A relative volume value of 1.0 indicates that current volume is equal to the mean of past volume , but how can we determine what constitutes a high relative volume value?
The traditional way is to settle for an arbitrary threshold, with 2.0 often used to indicate that relative volume is worthy of attention.
We wanted to provide traders with a contextual method of calculating threshold values, so in addition to the conventional fixed threshold value,
this indicator includes two methods of calculating a threshold channel on past relative volume values:
1 — Using the standard deviation of relative volume over a fixed lookback.
2 — Using the highs/lows of relative volume over a variable lookback.
Channels calculated on relative volume provide meta-relativity, if you will, as they are relative values of relative volume.
█ FEATURES
Controls in the "Display" section of inputs determine what is visible in the indicator's pane. The next "Settings" section is where you configure the parameters used in the calculations. The "Column Coloring Conditions" section controls the color of the columns, which you will see in three of the five display modes available. Whether columns are plotted or not, the coloring conditions also determine when markers appear, if you have chosen to show the markers in the "Display" section. The presence of markers is what triggers the alerts configured on this indicator. Finally, the "Colors" section of inputs allows you to control the color of the indicator's visual components.
Display
Five display modes are available:
• Current Volume Columns : shows columns of current volume , with past volume displayed as an outlined column.
• Relative Volume Columns : shows relative volume as a column.
• Relative Volume Columns With Average : shows relative volume as a column, with the average of relative volume.
• Directional Relative Volume Average : shows a line calculated using the average of +/- values of relative volume.
The positive value of relative volume is used on up bars; its negative value on down bars.
• Relative Volume Average : shows the average of relative volume.
A Hull moving average is used to calculate the average used in the three last display modes.
You can also control the display of:
• The value or relative volume, when in the first three display modes. Only the last 500 values will be shown.
• Timeframe transitions, shown in the background.
• A reminder of the active timeframe unit, which appears to the right of the indicator's last bar.
• The threshold used, which can be a fixed value or a channel, as determined in the next "Settings" section of inputs.
• Up/Down markers, which appear on transitions of the color of the volume columns (determined by coloring conditions), which in turn control when alerts are triggered.
• Conditions of high volatility.
Settings
Use this section of inputs to change:
• Calculation mode : this is where you select one of this indicator's two calculation modes for current volume and past volume , as explained in the "Concepts" section.
• Past Volume Lookback in TF units : the quantity of timeframe units used in the calculation of past volume .
• Define Timeframes Units Using : the mode used to determine what one timeframe unit is. Note that when using a fixed timeframe, it must be higher than the chart's timeframe.
Also, note that time of day timeframe units only work on intraday chart timeframes.
• Threshold Mode : Five different modes can be selected:
— Fixed Value : You can define the value using the "Fixed Threshold" field below. The default value is 2.0.
— Standard Deviation Channel From Fixed Lookback : This is a channel calculated using the simple moving average of relative volume
(so not the Hull moving average used elsewhere in the indicator), plus/minus the standard deviation multiplied by a user-defined factor.
The lookback used is the value of the "Channel Lookback" field. Its default is 100.
— High/Low Channel From Beginning of TF : in this mode, the High/Low values reset at the beginning of each timeframe unit.
— High/Low Channel From Beginning of Past Volume Lookback : in this mode, the High/Low values start from the farthest point back where we are calculating past volume ,
which is determined by the combination of timeframe units and the "Past Volume Lookback in TF units" value.
— High/Low Channel From Fixed Lookback : In this mode the lookback is fixed. You can define the value using the "Channel Lookback" field. The default value is 100.
• Period of RelVol Moving Average : the period of the Hull moving average used in the "Directional Relative Volume Average" and the "Relative Volume Average".
• High Volatility is defined using fast and slow ATR periods, so this represents the volatility of price.
Volatility is considered to be high when the fast ATR value is greater than its slow value. Volatility can be used as a filter in the column coloring conditions.
Column Coloring Conditions
• Eight different conditions can be turned on or off to determine the color of the volume columns. All "ON" conditions must be met to determine a high/low state of relative volume,
or, in the case of directional relative volume, a bull/bear state.
• A volatility state can also be used to filter the conditions.
• When the coloring conditions and the filter do not allow for a high/low state to be determined, the neutral color is used.
• Transitions of the color of the volume columns determined by coloring conditions are used to plot the up/down markers, which in turn control when alerts are triggered.
Colors
• You can define your own colors for all of the oscillator's plots.
• The default colors will perform well on light or dark chart backgrounds.
Alerts
• An alert can be defined for the script. The alert will trigger whenever an up/down marker appears in the indicator's display.
The particular combination of coloring conditions and the display settings for up/down markers when you create the alert will determine which conditions trigger the alert.
After alerts are created, subsequent changes to the conditions controlling the display of markers will not affect existing alerts.
• By configuring the script's inputs in different ways before you create your alerts, you can create multiple, functionally distinct alerts from this script.
When creating multiple alerts, it is useful to include in the alert's message a reminder of the particular conditions you used for each alert.
• As is usually the case, alerts triggering "Once Per Bar Close" will prevent repainting.
Error messages
Error messages will appear at the end of the chart upon the following conditions:
• When the combination of the timeframe units used and the "Past Volume Lookback in TF units" value create a lookback that is greater than 5000 bars.
The lookback will then be recalculated to a value such that a runtime error does not occur.
• If the chart's timeframe is higher than the timeframe units. This error cannot occur when using Auto-steps to calculate timeframe units.
• If relative volume cannot be calculated, for example, when no volume data is available for the chart's symbol.
• When the threshold of relative volume is configured to be visible but the indicator's scale does not allow it to be visible (in "Current Volume Columns" display mode).
█ NOTES
For traders
The chart shown here uses the following display modes: "Current Volume Columns", "Relative Volume Columns With Average", "Directional Relative Volume Average" and "Relative Volume Average". The last one also shows the threshold channel in standard deviation mode, and the TF Unit reminder to the right, in red.
Volume, like price, is a value with a market-dependent scale. The only valid reference for volume being its past values, any improvement in the way past volume is calculated thus represents a potential opportunity to traders. Relative volume calculated as it is here can help traders extract useful information from markets in many circumstances, markets with cyclical volume such as Forex being one, obvious case. The relative nature of the values calculated by this indicator also make it a natural fit for cross-market and cross-sector analysis, or to identify behavioral changes in the different futures contracts of the same market. Relative volume can also be put to more exotic uses, such as in evaluating changes in the popularity of exchanges.
Relative volume alone has no directional bias. While higher relative volume values always indicate higher trading activity, that activity does not necessarily translate into significant price movement. In a tightly fought battle between buyers and sellers, you could theoretically have very large volume for many bars, with no change whatsoever in bid/ask prices. This of course, is unlikely to happen in reality, and so traders are justified in considering high relative volume values as indicating periods where more attention is required, because imbalances in the strength of buying/selling power during high-volume trading periods can amplify price variations, providing traders with the generally useful gift of volatility.
Be sure to give the "Directional Relative Volume Average" a try. Contrary to the always-positive ratio widely used in this indicator, the "Directional Relative Volume Average" produces a value able to determine a bullish/bearish bias for relative volume.
Note that realtime bars must be complete for the relative volume value to be confirmed. Values calculated on historical or elapsed realtime bars will not recalculate unless historical volume data changes.
Finally, as with all indicators using volume information, keep in mind that some exchanges/brokers supply different feeds for intraday and daily data, and the volume data on both feeds can sometimes vary quite a bit.
For coders
Our script was written using the PineCoders Coding Conventions for Pine .
The description was formatted using the techniques explained in the How We Write and Format Script Descriptions PineCoders publication.
Bits and pieces of code were lifted from the MTF Selection Framework and the MTF Oscillator Framework , also by PineCoders.
█ THANKS
Thanks to dgtrd for suggesting to add the channel using standard deviation.
Thanks to adolgov for helpful suggestions on calculations and visuals.
Look first. Then leap.
Wyszukaj w skryptach "Volume"

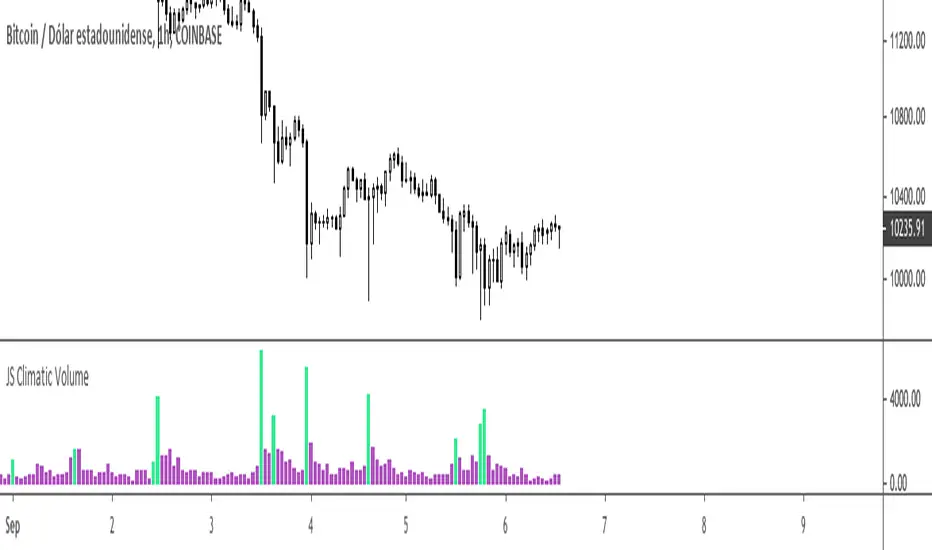
[JS] Climatic VolumeNot all the high volumes are important, this tool helps to identify the relevant market volumes
Can be useful to confirm a trend, a continuation or reversal
[WJ] - Corrected Seconds Volume** ONLY WORKS FOR SECONDS CHARTS **
After staring at a chart and scratching my head, I realized that the volumes were being incorrectly reported for lower time frames.
A chart that has no updated tick for 5 minutes will report the volume that occurred in the WHOLE 5 minutes - in one tick.
For a 5 second chart like above, we have now a chart that at first appearance is giving us numbers to believe that there is MUCH more liquidity than is real.
This can really confuse us, and other scripts that rely on volume information.
This script simply takes into consideration the time delay before the next tick. If it took 5 minutes to update a tick, the volume should be divided into whatever seconds we are currently using. I also changed the coloring code - if there is no length to the candle it will look at the candle before it to determine if it is a positive or negative movement.
It does make technical sense to have the volume that occurred over 5 minutes in one tick as it is the true volume. However, this script should not be viewed as the absolute value, but a consistent, usable number that will be more accurate with tools.
To give a quick example on why this is important:
In a 10 second chart, we are given an updated tick every minute. In 2 minutes we have 2 ticks that have 1K volume each.
Alternatively, we have a 10 second chart, and we are given an updated tick every 10 seconds. In 2 minutes we have 12 ticks that have 100 volume each.
With quick mental math we can determine that the second scenario is actually (albeit slightly) more busy. However, a script would not do that extra layer of math and would assume that the first scenario is bouncing off the walls with activity and the second is a graveyard.
It's exactly for this example that I have created this script, and I hope it helps someone else out.

Delta Volume Columns Pro [LucF]█ OVERVIEW
This indicator displays volume delta information calculated with intrabar inspection on historical bars, and feed updates when running in realtime. It is designed to run in a pane and can display either stacked buy/sell volume columns or a signal line which can be calculated and displayed in many different ways.
Five different models are offered to reveal different characteristics of the calculated volume delta information. Many options are offered to visualize the calculations, giving you much leeway in morphing the indicator's visuals to suit your needs. If you value delta volume information, I hope you will find the time required to master Delta Volume Columns Pro well worth the investment. I am confident that if you combine a proper understanding of the indicator's information with an intimate knowledge of the volume idiosyncrasies on the markets you trade, you can extract useful market intelligence using this tool.
█ WARNINGS
1. The indicator only works on markets where volume information is available,
Please validate that your symbol's feed carries volume information before asking me why the indicator doesn't plot values.
2. When you refresh your chart or re-execute the script on the chart, the indicator will repaint because elapsed realtime bars will then recalculate as historical bars.
3. Because the indicator uses different modes of calculation on historical and realtime bars, it's critical that you understand the differences between them. Details are provided further down.
4. Calculations using intrabar inspection on historical bars can only be done from some chart timeframes. See further down for a list of supported timeframes.
If the chart's timeframe is not supported, no historical volume delta will display.
█ CONCEPTS
Chart bars
Three different types of bars are used in charts:
1. Historical bars are bars that have already closed when the script executes on them.
2. The realtime bar is the current, incomplete bar where a script is running on an open market. There is only one active realtime bar on your chart at any given time.
The realtime bar is where alerts trigger.
3. Elapsed realtime bars are bars that were calculated when they were realtime bars but have since closed.
When a script re-executes on a chart because the browser tab is refreshed or some of its inputs are changed, elapsed realtime bars are recalculated as historical bars.
Why does this indicator use two modes of calculation?
Historical bars on TradingView charts contain OHLCV data only, which is insufficient to calculate volume delta on them with any level of precision. To mine more detailed information from those bars we look at intrabars , i.e., bars from a smaller timeframe (we call it the intrabar timeframe ) that are contained in one chart bar. If your chart Is running at 1D on a 24x7 market for example, most 1D chart bars will contain 24 underlying 1H bars in their dilation. On historical bars, this indicator looks at those intrabars to amass volume delta information. If the intrabar is up, its volume goes in the Buy bin, and inversely for the Sell bin. When price does not move on an intrabar, the polarity of the last known movement is used to determine in which bin its volume goes.
In realtime, we have access to price and volume change for each update of the chart. Because a 1D chart bar can be updated tens of thousands of times during the day, volume delta calculations on those updates is much more precise. This precision, however, comes at a price:
— The script must be running on the chart for it to keep calculating in realtime.
— If you refresh your chart you will lose all accumulated realtime calculations on elapsed realtime bars, and the realtime bar.
Elapsed realtime bars will recalculate as historical bars, i.e., using intrabar inspection, and the realtime bar's calculations will reset.
When the script recalculates elapsed realtime bars as historical bars, the values on those bars will change, which means the script repaints in those conditions.
— When the indicator first calculates on a chart containing an incomplete realtime bar, it will count ALL the existing volume on the bar as Buy or Sell volume,
depending on the polarity of the bar at that point. This will skew calculations for that first bar. Scripts have no access to the history of a realtime bar's previous updates,
and intrabar inspection cannot be used on realtime bars, so this is the only to go about this.
— Even if alerts only trigger upon confirmation of their conditions after the realtime bar closes, they are repainting alerts
because they would perhaps not have calculated the same way using intrabar inspection.
— On markets like stocks that often have different EOD and intraday feeds and volume information,
the volume's scale may not be the same for the realtime bar if your chart is at 1D, for example,
and the indicator is using an intraday timeframe to calculate on historical bars.
— Any chart timeframe can be used in realtime mode, but plots that include moving averages in their calculations may require many elapsed realtime bars before they can calculate.
You might prefer drastically reducing the periods of the moving averages, or using the volume columns mode, which displays instant values, instead of the line.
Volume Delta Balances
This indicator uses a variety of methods to evaluate five volume delta balances and derive other values from those balances. The five balances are:
1 — On Bar Balance : This is the only balance using instant values; it is simply the subtraction of the Sell volume from the Buy volume on the bar.
2 — Average Balance : Calculates a distinct EMA for both the Buy and Sell volumes, and subtracts the Sell EMA from the Buy EMA.
3 — Momentum Balance : Starts by calculating, separately for both Buy and Sell volumes, the difference between the same EMAs used in "Average Balance" and
an SMA of double the period used for the "Average Balance" EMAs. The difference for the Sell side is subtracted from the difference for the Buy side,
and an RSI of that value is calculated and brought over the −50/+50 scale.
4 — Relative Balance : The reference values used in the calculation are the Buy and Sell EMAs used in the "Average Balance".
From those, we calculate two intermediate values using how much the instant Buy and Sell volumes on the bar exceed their respective EMA — but with a twist.
If the bar's Buy volume does not exceed the EMA of Buy volume, a zero value is used. The same goes for the Sell volume with the EMA of Sell volume.
Once we have our two intermediate values for the Buy and Sell volumes exceeding their respective MA, we subtract them. The final "Relative Balance" value is an ALMA of that subtraction.
The rationale behind using zero values when the bar's Buy/Sell volume does not exceed its EMA is to only take into account the more significant volume.
If both instant volume values exceed their MA, then the difference between the two is the signal's value.
The signal is called "relative" because the intermediate values are the difference between the instant Buy/Sell volumes and their respective MA.
This balance flatlines when the bar's Buy/Sell volumes do not exceed their EMAs, which makes it useful to spot areas where trader interest dwindles, such as consolidations.
The smaller the period of the final value's ALMA, the more easily you will see the balance flatline. These flat zones should be considered no-trade zones.
5 — Percent Balance : This balance is the ALMA of the ratio of the "On Bar Balance" value, i.e., the volume delta balance on the bar (which can be positive or negative),
over the total volume for that bar.
From the balances and marker conditions, two more values are calculated:
1 — Marker Bias : It sums the up/down (+1/‒1) occurrences of the markers 1 to 4 over a period you define, so it ranges from −4 to +4, times the period.
Its calculation will depend on the modes used to calculate markers 3 and 4.
2 — Combined Balances : This is the sum of the bull/bear (+1/−1) states of each of the five balances, so it ranges from −5 to +5.
█ FEATURES
The indicator has two main modes of operation: Columns and Line .
Columns
• In Columns mode you can display stacked Buy/Sell volume columns.
• The buy section always appears above the centerline, the sell section below.
• The top and bottom sections can be colored independently using eight different methods.
• The EMAs of the Buy/Sell values can be displayed (these are the same EMAs used to calculate the "Average Balance").
Line
• Displays one of seven signals: the five balances or one of two complementary values, i.e., the "Marker Bias" or the "Combined Balances".
• You can color the line and its fill using independent calculation modes to pack more information in the display.
You can thus appraise the state of 3 different values using the line itself, its color and the color of its fill.
• A "Divergence Levels" feature will use the line to automatically draw expanding levels on divergence events.
Default settings
Using the indicator's default settings, this is the information displayed:
• The line is calculated on the "Average Balance".
• The line's color is determined by the bull/bear state of the "Percent Balance".
• The line's fill gradient is determined by the advances/declines of the "Momentum Balance".
• The orange divergence dots are calculated using discrepancies between the polarity of the "On Bar Balance" and the chart's bar.
• The divergence levels are determined using the line's level when a divergence occurs.
• The background's fill gradient is calculated on advances/declines of the "Marker Bias".
• The chart bars are colored using advances/declines of the "Relative Balance". Divergences are shown in orange.
• The intrabar timeframe is automatically determined from the chart's timeframe so that a minimum of 50 intrabars are used to calculate volume delta on historical bars.
Alerts
The configuration of the marker conditions explained further is what determines the conditions that will trigger alerts created from this script. Note that simply selecting the display of markers does not create alerts. To create an alert on this script, you must use ALT-A from the chart. You can create multiple alerts triggering on different conditions from this same script; simply configure the markers so they define the trigger conditions for each alert before creating the alert. The configuration of the script's inputs is saved with the alert, so from then on you can change them without affecting the alert. Alert messages will mention the marker(s) that triggered the specific alert event. Keep in mind, when creating alerts on small chart timeframes, that discrepancies between alert triggers and markers displayed on your chart are to be expected. This is because the alert and your chart are running two distinct instances of the indicator on different servers and different feeds. Also keep in mind that while alerts only trigger on confirmed conditions, they are calculated using realtime calculation mode, which entails that if you refresh your chart and elapsed realtime bars recalculate as historical bars using intrabar inspection, markers will not appear in the same places they appeared in realtime. So it's important to understand that even though the alert conditions are confirmed when they trigger, these alerts will repaint.
Let's go through the sections of the script's inputs.
Columns
The size of the Buy/Sell columns always represents their respective importance on the bar, but the coloring mode for tops and bottoms is independent. The default setup uses a standard coloring mode where the Buy/Sell columns are always in the bull/bear color with a higher intensity for the winning side. Seven other coloring modes allow you to pack more information in the columns. When choosing to color the top columns using a bull/bear gradient on "Average Balance", for example, you will have bull/bear colored tops. In order for the color of the bottom columns to continue to show the instant bar balance, you can then choose the "On Bar Balance — Dual Solid Colors" coloring mode to make those bars the color of the winning side for that bar. You can display the averages of the Buy and Sell columns. If you do, its coloring is controlled through the "Line" and "Line fill" sections below.
Line and Line fill
You can select the calculation mode and the thickness of the line, and independent calculations to determine the line's color and fill.
Zero Line
The zero line can display dots when all five balances are bull/bear.
Divergences
You first select the detection mode. Divergences occur whenever the up/down direction of the signal does not match the up/down polarity of the bar. Divergences are used in three components of the indicator's visuals: the orange dot, colored chart bars, and to calculate the divergence levels on the line. The divergence levels are dynamic levels that automatically build from the line's values on divergence events. On consecutive divergences, the levels will expand, creating a channel. This implementation of the divergence levels corresponds to my view that divergences indicate anomalies, hesitations, points of uncertainty if you will. It precludes any attempt to identify a directional bias to divergences. Accordingly, the levels merely take note of divergence events and mark those points in time with levels. Traders then have a reference point from which they can evaluate further movement. The bull/bear/neutral colors used to plot the levels are also congruent with this view in that they are determined by the line's position relative to the levels, which is how I think divergences can be put to the most effective use. One of the coloring modes for the line's fill uses advances/declines in the line after divergence events.
Background
The background can show a bull/bear gradient on six different calculations. As with other gradients, you can adjust its brightness to make its importance proportional to how you use it in your analysis.
Chart bars
Chart bars can be colored using seven different methods. You have the option of emptying the body of bars where volume does not increase, as does my TLD indicator, and you can choose whether you want to show divergences.
Intrabar Timeframe
This is the intrabar timeframe that will be used to calculate volume delta using intrabar inspection on historical bars. You can choose between four modes. The three "Auto-steps" modes calculate, from the chart's timeframe, the intrabar timeframe where the said number of intrabars will make up the dilation of chart bars. Adjustments are made for non-24x7 markets. "Fixed" mode allows you to select the intrabar timeframe you want. Checking the "Show TF" box will display in the lower-right corner the intrabar timeframe used at any given moment. The proper selection of the intrabar timeframe is important. It must achieve maximal granularity to produce precise results while not unduly slowing down calculations, or worse, causing runtime errors. Note that historical depth will vary with the intrabar timeframe. The smaller the timeframe, the shallower historical plots you will be.
Markers
Markers appear when the required condition has been confirmed on a closed bar. The configuration of the markers when you create an alert is what determines when the alert will trigger. Five markers are available:
• Balances Agreement : All five balances are either bullish or bearish.
• Double Bumps : A double bump is two consecutive up/down bars with +/‒ volume delta, and rising Buy/Sell volume above its average.
• Divergence confirmations : A divergence is confirmed up/down when the chosen balance is up/down on the previous bar when that bar was down/up, and this bar is up/down.
• Balance Shifts : These are bull/bear transitions of the selected signal.
• Marker Bias Shifts : Marker bias shifts occur when it crosses into bull/bear territory.
Periods
Allows control over the periods of the different moving averages used to calculate the balances.
Volume Discrepancies
Stock exchanges do not report the same volume for intraday and daily (or higher) resolutions. Other variations in how volume information is reported can also occur in other markets, namely Forex, where volume irregularities can even occur between different intraday timeframes. This will cause discrepancies between the total volume on the bar at the chart's timeframe, and the total volume calculated by adding the volume of the intrabars in that bar's dilation. This does not necessarily invalidate the volume delta information calculated from intrabars, but it tells us that we are using partial volume data. A mechanism to detect chart vs intrabar timeframe volume discrepancies is provided. It allows you to define a threshold percentage above which the background will indicate a difference has been detected.
Other Settings
You can control here the display of the gray dot reminder on realtime bars, and the display of error messages if you are using a chart timeframe that is not greater than the fixed intrabar timeframe, when you use that mode. Disabling the message can be useful if you only use realtime mode at chart timeframes that do not support intrabar inspection.
█ RAMBLINGS
On Volume Delta
Volume is arguably the best complement to interpret price action, and I consider volume delta to be the most effective way of processing volume information. In periods of low-volatility price consolidations, volume will typically also be lower than normal, but slight imbalances in the trend of the buy/sell volume balance can sometimes help put early odds on the direction of the break from consolidation. Additionally, the progression of the volume imbalance can help determine the proximity of the breakout. I also find volume delta and the number of divergences very useful to evaluate the strength of trends. In trends, I am looking for "slow and steady", i.e., relatively low volatility and pauses where price action doesn't look like world affairs are being reassessed. In my personal mythology, this type of trend is often more resilient than high-volatility breakouts, especially when volume balance confirms the general agreement of traders signaled by the low-volatility usually accompanying this type of trend. The volume action on pauses will often help me decide between aggressively taking profits, tightening a stop or going for a longer-term movement. As for reversals, they generally occur in high-volatility areas where entering trades is more expensive and riskier. While the identification of counter-trend reversals fascinates many traders to no end, they represent poor opportunities in my view. Volume imbalances often precede reversals, but I prefer to use volume delta information to identify the areas following reversals where I can confirm them and make relatively low-cost entries with better odds.
On "Buy/Sell" Volume
Buying or selling volume are misnomers, as every unit of volume transacted is both bought and sold by two different traders. While this does not keep me from using the terms, there is no such thing as “buy only” or “sell only” volume. Trader lingo is riddled with peculiarities.
Divergences
The divergence detection method used here relies on a difference between the direction of a signal and the polarity (up/down) of a chart bar. When using the default "On Bar Balance" to detect divergences, however, only the bar's volume delta is used. You may wonder how there can be divergences between buying/selling volume information and price movement on one bar. This will sometimes be due to the calculation's shortcomings, but divergences may also occur in instances where because of order book structure, it takes less volume to increase the price of an asset than it takes to decrease it. As usual, divergences are points of interest because they reveal imbalances, which may or may not become turning points. To your pattern-hungry brain, the divergences displayed by this indicator will — as they do on other indicators — appear to often indicate turnarounds. My opinion is that reality is generally quite sobering and I have no reliable information that would tend to prove otherwise. Exercise caution when using them. Consequently, I do not share the overwhelming enthusiasm of traders in identifying bullish/bearish divergences. For me, the best course of action when a divergence occurs is to wait and see what happens from there. That is the rationale underlying how my divergence levels work; they take note of a signal's level when a divergence occurs, and it's the signal's behavior from that point on that determines if the post-divergence action is bullish/bearish.
Superfluity
In "The Bed of Procrustes", Nassim Nicholas Taleb writes: To bankrupt a fool, give him information . This indicator can display lots of information. While learning to use a new indicator inevitably requires an adaptation period where we put it through its paces and try out all its options, once you have become used to it and decide to adopt it, rigorously eliminate the components you don't use and configure the remaining ones so their visual prominence reflects their relative importance in your analysis. I tried to provide flexible options for traders to control this indicator's visuals for that exact reason — not for window dressing.
█ LIMITATIONS
• This script uses a special characteristic of the `security()` function allowing the inspection of intrabars — which is not officially supported by TradingView.
It has the advantage of permitting a more robust calculation of volume delta than other methods on historical bars, but also has its limits.
• Intrabar inspection only works on some chart timeframes: 3, 5, 10, 15 and 30 minutes, 1, 2, 3, 4, 6, and 12 hours, 1 day, 1 week and 1 month.
The script’s code can be modified to run on other resolutions.
• When the difference between the chart’s timeframe and the intrabar timeframe is too great, runtime errors will occur. The Auto-Steps selection mechanisms should avoid this.
• All volume is not created equally. Its source, components, quality and reliability will vary considerably with sectors and instruments.
The higher the quality, the more reliably volume delta information can be used to guide your decisions.
You should make it your responsibility to understand the volume information provided in the data feeds you use. It will help you make the most of volume delta.
█ NOTES
For traders
• The Data Window shows key values for the indicator.
• While this indicator displays some of the same information calculated in my Delta Volume Columns ,
I have elected to make it a separate publication so that traders continue to have a simpler alternative available to them. Both code bases will continue to evolve separately.
• All gradients used in this indicator determine their brightness intensities using advances/declines in the signal—not their relative position in a pre-determined scale.
• Volume delta being relative, by nature, it is particularly well-suited to Forex markets, as it filters out quite elegantly the cyclical volume data characterizing the sector.
If you are interested in volume delta, consider having a look at my other "Delta Volume" indicators:
• Delta Volume Realtime Action displays realtime volume delta and tick information on the chart.
• Delta Volume Candles builds volume delta candles on the chart.
• Delta Volume Columns is a simpler version of this indicator.
For coders
• I use the `f_c_gradientRelativePro()` from the PineCoders Color Gradient Framework to build my gradients.
This function has the advantage of allowing begin/end colors for both the bull and bear colors. It also allows us to define the number of steps allowed for each gradient.
I use this to modulate the gradients so they perform optimally on the combination of the signal used to calculate advances/declines,
but also the nature of the visual component the gradient applies to. I use fewer steps for choppy signals and when the gradient is used on discrete visual components
such as volume columns or chart bars.
• I use the PineCoders Coding Conventions for Pine to write my scripts.
• I used functions modified from the PineCoders MTF Selection Framework for the selection of timeframes.
█ THANKS TO:
— The devs from TradingView's Pine and other teams, and the PineCoders who collaborate with them. They are doing amazing work,
and much of what this indicator does could not be done without their recent improvements to Pine.
— A guy called Kuan who commented on a Backtest Rookies presentation of their Volume Profile indicator using a `for` loop.
This indicator started from the intrabar inspection technique illustrated in Kuan's snippet.
— theheirophant , my partner in the exploration of the sometimes weird abysses of `security()`’s behavior at intrabar timeframes.
— midtownsk8rguy , my brilliant companion in mining the depths of Pine graphics.

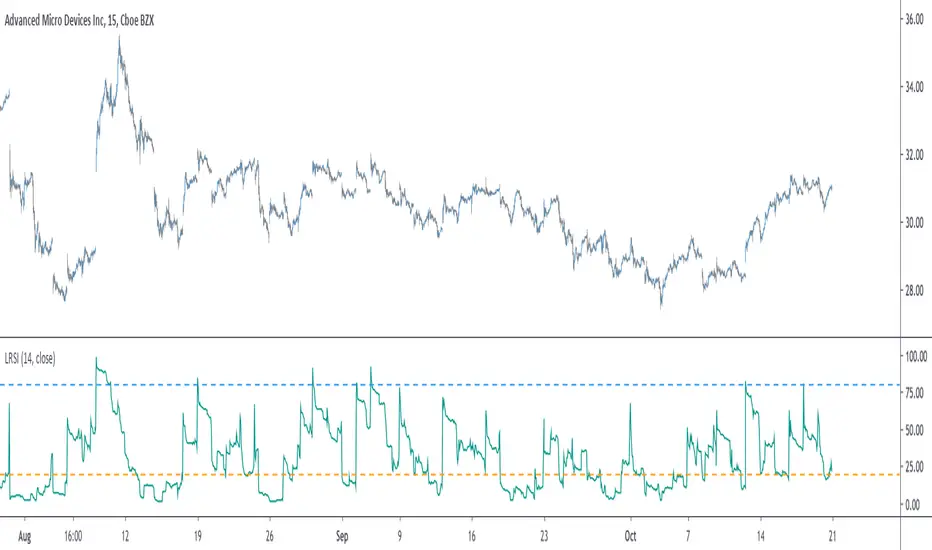
Liquid RSI - Marrying The Relative Strength Index And The VolumeIntroduction
I recently derived the calculation of the relative strength index, an indicator that aim to spot overbought and oversold assets, but what is an overbought/sold asset ? Can such things be estimated with price alone ?
This why i propose a modification of the relative strength using my recently proposed efficient calculation including volume information in order to spot overbought/sold asset.
Scaling A Liquid Market
The relative strength index detect an overbought/sold asset when higher/lower than a certain level, often 80/20. An overbought asset, or better say over evaluated, is more attractive to sell because prices are no longer attractive to buy, it has reached its value of interest for traders looking to go long, we can then expect the price to correct and start a trend of opposite direction, while an oversold asset is more attractive to buy based on the same logic.
The idea of talking about over bought and over sold without taking into account the volume can be a bit strange, since volume is directly related to the quantity of contracts traded, an higher volume can show sign of a more active market, which can describe the terms : overbought/sold a bit better. Many indicators used the rsi framework with volume, the money flow index for example, but it can be interesting to provide other alternatives.
The Indicator
The indicator is based on the average positive changes in price multiplied by positive changes in volume divided by the average absolute change in price multiplied by the absolute changes in volume. The average is based on the wilder moving average which is a simple exponential filter with smoothing constant 1/length .
The indicator will react according to the volume magnitude, higher volumes will make the indicator go over/under the overbought/sold threshold more easily, in the image above, the indicator is currently saying that the market is under evaluated, which is not the case for the RSI. Such situation allow us to take a position that we could't take if we base our judgement only on price change magnitude.
The indicator has a tendency to be over/under the thresholds a longer period of time if the volume is relatively high.
An interesting effect the indicator has it to ignore movements with moderate volume, the indicator is less prone to cross under a threshold and to go back to it, this is shown in the image above. Another observation we can make is that the proposed indicator is smoother than the rsi, this is certainly due to the fact that the volume underweight small price changes.
Conclusions
I proposed a modification of the relative strength index that also take into account volume information. The proposed indicator is also smoother. Regarding its ability to detect overbought and oversold market, it has indeed the capacity to do it, however the problem remain the same, what is the extent of the correction following an overbought/oversold market ? We can see that the correction can be minor, and thus be followed by a large movements correlated with the main trend.
With those oscillators we are interested into knowing the end of the "whole trend", and they fail to do this because they use past information. I still hope the indicator find some creative usages amongst the community.
Thanks for reading ! And remember to ask before using the script code, it pains me to see minor changes on scripts i can pass 3 hours on.
Accumulation/Distribution VolumeThis is a simple yet powerful indicator that can replace volume, Money Flow, Chaikin Money Flow, Price Volume Trend (PVT), Accumulation/Distribution Line (ADL), On Balance Volume (OBV).
When "Baseline Chart" option is disabled, it looks similar to regular volume. The volume bars has two shades of green and red. The dark shade shows amount of accumulation and the light shade shows total volume (what you see on a regular volume indicator). Blue line is the moving average (or cumulative total) of A/D and the gray line is for total volume.
When money volume is enabled, volume it multiplied by price. As you can see in the chart below, trade volume in terms of USD was declining after ATH. This is not the case in regular volume chart which shows instrument volume (chart above).
In Baseline view, the aggregation method you choose can turn it into different indicators. With EMA/SMA aggregation, blue and gray line shows buy/sell pressure. At 0, there is not buy or sell pressure.
If you turn off volume bars (from style menu), it gives you a reliable indicator to measure divergence. This should be more reliable than most other range-bound indicators (i.e. RSI, MFI, CMF). I will publish a TA about correctly measuring divergence (it's a must read even if you are a pro trader). Make sure that the length is set to a large number on smaller TFs such as 4h.
For following results, set aggregation to cumulative and turn off money volume:
When wick weight=0, the GRAY line is identical to OBV indicator.
When normalized by spread and wick weight=10, the BLUE line is identical to ADL (improved by true range).
When normalized by previous bar price, wick weight=0, the BLUE line is identical to PVT.
How I use this indicator:
- Baseline chart, replaced my regular volume indicator
- Mostly 4h TF for divergence
- EMA aggregation (and occasional cumulative aggregation) with length above 50. I change the length to 100 and 200 for confirmation.
- Wick weight=0 or max 2.
With this indicator, you can learn how different indicators are built and how they are different from each other. I will publish a TA to explain more about different indicators and their pros and cons.
I will publish this indicator without volume bars and additional options to make it range bound.

Relative Volume (RVOL) - Beasley SavageRelative Volume, often times called RVOL, is an indicator that tells traders how current volume is compared to past trading volumes over a given period. It is kind of a like a radar for how “in-play” a stock is. The higher the relative volume is the more in play it is.
Relative Volume is displayed as a ratio. So if it is showing 3.5 relative volume, that means it is trading at 3.5 times its normal volume.

Volume-Adjusted CCI Trend [Alpha Extract]A sophisticated trend identification system that combines dual EMA direction analysis with volume-weighted normalization and CCI momentum filtering for comprehensive trend validation. Utilizing Volume RSI integration and standard deviation-based bands that expand and contract with volume characteristics, this indicator delivers institutional-grade trend detection with multi-layered confirmation requirements. The system's volume adjustment mechanism modulates signal sensitivity based on participation strength while CCI thresholds prevent false signals during weak momentum conditions, creating a robust trend-following framework with reduced whipsaw susceptibility.
🔶 Advanced Dual EMA Direction Engine
Implements fast and slow exponential moving average comparison to establish primary trend direction bias with configurable period parameters for timeframe optimization. The system calculates trend direction as binary +1 (bullish when fast EMA exceeds slow EMA) or -1 (bearish when slow exceeds fast), providing foundational directional input that requires additional confirmation before generating actionable trend states.
🔶 Volume-Adjusted Normalization Framework
Features sophisticated normalization calculation that measures price deviation from basis EMA, scales by standard deviation, then applies volume-weighted adjustment factor for participation-sensitive signal generation. The system calculates Volume RSI to quantify relative volume strength, converts to ratio format, and multiplies normalized deviation by volume factor scaled by impact parameter, creating signals that strengthen during high-volume confirmations and weaken during low-volume moves.
// Volume-Adjusted Normalization
Vol_Ratio = Volume_RSI / 50
Vol_Factor = 1 + (Vol_Ratio - 1) * Vol_Impact
Dev = src - Basis_EMA
Raw_Normalized = Dev / (StdDev * Multiplier)
Vol_Adjusted_Norm = Raw_Normalized * Vol_Factor
🔶 CCI Momentum Filter Integration
Implements Commodity Channel Index threshold system with configurable upper and lower bounds to validate trend strength and filter sideways market conditions. The system calculates standard CCI with adjustable length, compares against asymmetric thresholds (default +100 bullish, -50 bearish), and requires CCI confirmation in addition to EMA direction and normalized deviation before transitioning trend states, ensuring only high-conviction signals generate entries.
🔶 Multi-Layer Trend State Logic
Provides intelligent trend state machine requiring simultaneous confirmation from EMA direction, volume-adjusted normalization threshold breach, and optional CCI momentum validation. The system maintains persistent trend state that only transitions when all three conditions align, preventing premature reversals during temporary retracements or low-volume fluctuations while capturing genuine trend changes with institutional-grade confirmation requirements.
🔶 Dynamic Volume Band Architecture
Creates volatility-adjusted bands around basis EMA using standard deviation multiplied by volume factor, producing channels that widen during high-volume periods and contract during low-volume consolidations. The system applies identical volume adjustment to band calculations as normalization metric, ensuring visual envelope consistency with underlying signal logic and providing intuitive reference boundaries for trend-following price action.
🔶 Gradient Strength Visualization System
Implements color intensity modulation based on normalized signal strength relative to threshold requirements, creating visual feedback that communicates trend conviction. The system calculates strength ratio by dividing absolute normalized value by threshold, caps at 1.0, and applies gradient interpolation from muted to vivid colors, instantly conveying whether current trend exhibits marginal or strong characteristics through line and candle coloring.
🔶 Volume RSI Calculation Engine
Utilizes RSI methodology applied to volume series rather than price to quantify relative participation strength with normalization to 0.5-1.5 range for factor multiplication. The system processes volume through standard RSI calculation, divides by 50 to center around 1.0, and produces ratio values where readings above 1.0 indicate above-average volume and below 1.0 suggest below-average participation for signal adjustment purposes.
🔶 Asymmetric Threshold Configuration
Features separate positive and negative normalization thresholds with independent CCI upper and lower bounds enabling optimization for bullish versus bearish signal generation characteristics. The system defaults to symmetric normalized thresholds (±0.2) but asymmetric CCI levels (+100/-50), recognizing that bullish momentum often requires stronger confirmation than bearish reversals in typical market structures.
🔶 Comprehensive Visual Integration
Provides multi-dimensional trend visualization through color-coded basis line, volume-adjusted bands with gradient fills, trend-synchronized candle coloring, and transition signal labels. The system enables selective display toggling for each visual component while maintaining consistent color scheme and strength-based intensity across all elements for cohesive chart presentation without overwhelming information density.
🔶 Alert and Signal Framework
Generates trend change alerts when state transitions occur with all confirmation requirements satisfied, providing notifications for bullish (transition to +1) and bearish (transition to -1) signals. The system implements state change detection through comparison with previous bar trend state, ensuring single alert per transition rather than continuous notifications during sustained trends.
🔶 Performance Optimization Architecture
Employs efficient calculation methods with null value handling for Volume RSI initialization and nz() functions preventing calculation errors during early bars. The system includes intelligent state persistence maintaining previous trend during ambiguous conditions and optimized gradient calculations balancing visual quality with computational efficiency across extended historical periods.
🔶 Why Choose Volume-Adjusted CCI Trend ?
This indicator delivers sophisticated trend identification through multi-layered confirmation combining directional EMA analysis, volume-weighted normalization, and momentum validation via CCI filtering. Unlike traditional trend indicators relying solely on price-based calculations, the volume adjustment mechanism ensures signals strengthen during high-participation moves and weaken during low-volume drifts, reducing false breakouts and choppy market whipsaws. The system's requirement for simultaneous EMA direction, normalized threshold breach, and CCI momentum confirmation creates institutional-grade signal quality suitable for systematic trend-following approaches across cryptocurrency, forex, and equity markets. The volume-adjusted bands provide dynamic support/resistance references while the gradient strength visualization enables instant assessment of trend conviction for position sizing and risk management decisions.

Multi-Timeframe Volume Profile - Auto HVN WallsMulti-Timeframe Volume Profile - Auto HVN Walls
Overview This indicator provides a highly flexible Volume Profile solution that operates across multiple timeframes (Session, Weekly, Monthly, Yearly). Unlike standard profiles, this tool features a unique "Auto HVN Wall" detection system. It automatically identifies meaningful High Volume Nodes (HVNs) within the profile structure and extends them forward as potential support and resistance zones, creating a dynamic map of market structure as it develops.
Key Features
Multi-Timeframe Support: Switch seamlessly between Session, Weekly, Monthly, and Yearly profiles.
Auto HVN Walls (Structure Detection): The script analyzes the profile shape in real-time. When it detects significant clusters of volume (HVNs), it automatically draws extended lines ("walls"). These walls often act as magnets or support/resistance levels where price has previously found acceptance.
Session Filtering: When in "Session" mode, you can define specific time windows (e.g., 0930-1615) to isolate Regular Trading Hours (RTH) volume, ignoring overnight data.
Auto-Scaling Width (Monthly Mode): For Monthly profiles, the histogram width dynamically changes throughout the month. It starts wide at the beginning of the month to be visible and gradually narrows as the month progresses, keeping your chart clean.
High Precision: Uses lower timeframe data (user-selectable) to build the profile, ensuring accuracy even on higher timeframe charts.
Alerts: Built-in alert conditions for price crossing the developing POC, VAH, or VAL.
How It Works
Data Accumulation: The script fetches lower timeframe volume and price data (e.g., 5-minute data on a 1-hour chart) to construct a precise volume histogram.
Wall Detection: It runs a smoothing algorithm over the volume profile. If a price level accumulates volume significantly higher than the average (controlled by the Volume Threshold Multiplier), it marks that level as a "Wall" and extends it.
Value Area: Standard Value Area High (VAH), Value Area Low (VAL), and Point of Control (POC) are calculated and displayed for the selected period.
Settings Guide
Profile Period: Choose between Session, Weekly, Monthly, or Yearly.
Session Time: (Only active in "Session" mode) Define the start and end times for the profile (e.g., 0930-1615).
Calculation Precision: Determines the lower timeframe used to build the profile. Lower is more precise but may load slower.
The Walls:
Smoothing Factor: How much to smooth the volume data before finding walls. Higher = fewer, more significant walls.
Volume Threshold: How much volume is needed to trigger a wall.
Extend Walls: If checked, walls extend infinitely to the right.
Auto-Scale Width: (Monthly Only) dynamically adjusts the profile width based on the day of the month.
Use Case This tool is ideal for auction market theorists and volume profile traders who want to visualize where value is building in real-time and identify "sticky" price levels (Walls) where the market is likely to rotate or consolidate.
Disclaimer This script and the information presented here are for educational and informational purposes only. They do not constitute financial advice, investment recommendations, or trading signals. Trading in financial markets involves a significant risk of loss and is not suitable for all investors. Past performance of any trading system or methodology is not necessarily indicative of future results. Use this tool at your own discretion and risk.

Clean Volume (SUV)The Problem with Raw Volume
Traditional volume bars tell you how much traded, but not whether that amount is unusual. This creates noise that misleads traders:
Stock A averages 1M shares with wild daily swings (500K-2M is normal). Today's 2M volume looks like a spike—but it's just a routine high day.
Stock B averages 1M shares with rock-steady volume (950K-1.05M typical). Today's 2M volume is genuinely extraordinary—institutions are clearly active.
Both show identical 200% relative volume. But Stock B's reading is far more significant. Raw volume and simple relative volume (RVol) can't distinguish between these situations, leading to:
- False signals on naturally volatile stocks
- Missed signals on stable stocks where smaller deviations matter
- Inconsistent comparisons across different securities
---
A Solution: Standardized Unexpected Volume (SUV)
SUV applies statistical normalization to volume, measuring how many standard deviations today's volume is from the mean. This z-score approach accounts for each stock's individual volume stability, not just its average.
SUV = (Today's Volume - Average Volume) / Standard Deviation of Volume
Using the examples above:
- Stock A (high volatility): SUV = 2.0 — elevated but not unusual for this stock
- Stock B (low volatility): SUV = 10.0 — extremely unusual, demands attention
SUV automatically calibrates to each security's behaviour, making volume readings comparable across any stock, ETF, or timeframe.
---
What SUV Is Good For
✅ Identifying genuine volume anomalies — separates signal from noise
✅ Comparing volume across different securities — apples-to-apples z-scores
✅ Spotting institutional activity — large players create statistically significant footprints
✅ Confirming breakouts — high SUV validates price moves
✅ Detecting exhaustion — extreme SUV after extended moves may signal climax
✅ Finding "dry" setups — negative SUV reveals quiet accumulation periods
---
Where SUV Has Limitations
⚠️ Earnings/news events — SUV will spike dramatically (by design), but the statistical reading may be less meaningful when fundamentals change
⚠️ Low-float stocks — extreme volume volatility can produce erratic SUV readings
⚠️ First 20 bars — needs lookback period to establish baseline; early readings are less reliable
⚠️ Doesn't predict direction — SUV measures volume intensity, not whether price will rise or fall
---
How to Read This Indicator
Bar Height
Displays actual volume (like a traditional volume chart) so you can still see absolute levels.
Bar Color (SUV Intensity)
Color intensity reflects the SUV z-score. Brighter = more unusual.
Up Days (Green Gradient):
| Color | SUV Range | Meaning |
|--------------|-----------|------------------------------------------|
| Bright Green | ≥ 3.0 | EXTREME — Highly unusual buying activity |
| Green | ≥ 2.0 | VERY HIGH — Significant accumulation |
| Light Green | ≥ 1.5 | HIGH — Above-average interest |
| Pale Green | ≥ 1.0 | ELEVATED — Moderately active |
| Muted Green | 0 to 1.0 | NORMAL — Typical volume |
| Dark Grey | < 0 | DRY — Below-average, quiet |
Down Days (Red Gradient):
| Color | SUV Range | Meaning |
|------------|-----------|-----------------------------------------|
| Bright Red | ≥ 3.0 | EXTREME — Panic selling or capitulation |
| Red | ≥ 2.0 | VERY HIGH — Heavy distribution |
| Light Red | ≥ 1.5 | HIGH — Active selling |
| Pale Red | ≥ 1.0 | ELEVATED — Moderate selling |
| Muted Red | 0 to 1.0 | NORMAL — Routine down day |
| Dark Grey | < 0 | DRY — Light profit-taking |
Coiled State (Tan/Beige):
When detected, bars turn muted tan regardless of direction. This indicates:
- Volume compression (SUV below threshold for consecutive days)
- Volatility contraction (ATR below average)
- Price tightness (small recent moves)
Coiled states may precede significant breakouts.
Special Markers
"P" Label (Blue) — Pocket Pivot detected. Morales & Kacher's signal fires when:
- Price closes higher than previous close
- Price closes above the open (green candle)
- Volume exceeds the highest down-day volume of the last 10 bars
Pocket Pivots may indicate institutional buying before a traditional breakout.
"C" Label (Orange) — Coiled state confirmed. The stock is consolidating with compressed volume and tight price action. Watch for expansion.
Dashboard
The configurable dashboard displays real-time metrics. Default items:
- Vol — Current bar volume
- SUV — Z-score value
- Class — Classification (EXTREME/VERY HIGH/HIGH/ELEVATED/NORMAL/DRY/COILED)
- Proj RVol — Projected end-of-day relative volume (intraday only)
Additional optional items: Direction, Coil Status, Relative ATR, Pocket Pivot, Average Volume.
---
Practical Usage Tips
1. SUV ≥ 2 on breakouts — Validates the move has institutional participation
2. Watch for SUV < 0 bases — Quiet accumulation zones where smart money builds positions
3. Coil → Expansion — After consecutive coiled days, the first SUV ≥ 1.5 bar often signals direction
4. Pocket Pivots in bases — Early accumulation signals before price breaks out
5. Extreme SUV (≥3) after extended moves — May indicate climax/exhaustion rather than continuation
---
Settings Overview
| Group | Key Settings |
|-----------------|-----------------------------------------------------|
| SUV Settings | Lookback period (default 20) |
| Coil Detection | Enable/disable, sensitivity thresholds |
| Pocket Pivot | Enable/disable, lookback period |
| Display | Dashboard style (Ribbon/Table), position, text size |
| Dashboard Items | Toggle which metrics appear |
| Colors | Fully customizable gradient colors |
---
Credits
SUV concept adapted from academic literature on standardized unexpected volume in market microstructure research. Pocket Pivot methodology based on Gil Morales and Chris Kacher's work. Coil detection inspired by volatility contraction patterns.
---
This indicator does not provide financial advice. Always combine volume analysis with price action, market context, and proper risk management. No animals were harmed during the coding and testing of this indicator.

Volume profilerMulti-Range Volume Analysis & Absorption Detection
This tool visualises market activity through multi-range volume profiling and absorption signal detection. It helps you quickly identify where volume expands, compresses, or diverges from expected behaviour.
What it does
Volume Profiler plots four volume EMAs (short / mid / long / longer) so you can gauge how current volume compares to different market regimes.
It also highlights structural volume extremes:
• Low-volume bars (liquidity withdrawal)
These are potential signs of exhaustion, pauses, or low liquidity environments.
• High-volume + Low-range absorption
A classic footprint-style signal where aggressive volume fails to move price.
Often seen during:
absorption of one side of the book
liquidity collection
failed breakouts
institutional accumulation/distribution
You can choose:
which EMA defines “high volume”
how to measure candle range (High-Low, True Range, or Body)
how to define baseline volatility (ATR or average range)
Alerts are included so you can monitor absorption automatically.
Features
Multi-range volume EMAs (10 / 50 / 100 / 300 by default)
Low-volume bar flags
Absorption detection based on custom thresholds
Customisable volatility baseline
Optional bar colouring
Labels displayed directly in the volume pane
Alert conditions for absorption events
How to use
This indicator is valuable for:
confirming trend strength or weakness
detecting absorption before reversal or breakout continuation
finding low-liquidity pauses
identifying volume expansion across different time horizons
footprint-style behavioural confirmation without needing order-flow data
Works across all markets and timeframes.
Notes
This script is intended for educational and analytical use.
It does not repaint.

SIDD Table Volume multiframe (Modified)🚀 SIDD Volume Table – The Most Powerful Multi-Timeframe Volume Dashboard
Designed by Siddhartha Mukherjee (SIDD)
Free for the community.
Get an unfair edge with the cleanest, fastest, and most accurate multi-timeframe volume analyzer available on TradingView. This tool reveals where buyers and sellers are truly active across multiple timeframes—helping you confirm trends, avoid traps, and enter with confidence.
🔥 Why Traders Love This Indicator
✅ 1. Multi-Timeframe Volume Domination
Instantly view Buy% / Sell% / Total Volume for:
1m • 5m • 15m • 1H • 4H • 1D • 1W
Choose any combination you want!
✅ 2. Advanced Buy/Sell Volume Logic
Not simple volume…
This tool breaks it into:
Buy Volume% (green dominance)
Sell Volume% (red dominance)
Using candle structure (H-L-C), giving far more accurate pressure detection.
✅ 3. Realtime Candle Countdown
Never guess when a candle will close again.
Get:
Seconds (1m)
MM:SS (5m/15m/1H)
DD:HH:MM:SS (4H, 1D, 1W)
Perfect for scalpers, swing traders, and index traders.
✅ 4. Beautiful & Customizable Dashboard
Choose position anywhere on screen
Auto size or choose Tiny → Huge
Color-coded Bias (Green Buyers, Red Sellers)
Clean layout built for modern charts
Your chart stays clean while your data stays powerful.
💡 What This Helps You Identify
Where buyers are gaining strength
Where sellers are dominating
Multi-timeframe alignment (the key to big moves)
Real reversal pressure
Volume divergence across timeframes
Trend confirmation before breakouts
Perfect for:
NIFTY / BANKNIFTY / Stocks / Crypto / FX / Commodities
🧠 Who Should Use This?
Intraday traders
Swing traders
Options traders
Futures traders
Crypto scalpers
Professional volume analysts
If volume matters to you → this indicator becomes a must-have.
🛠 Built with Precision
Non-repainting
Multi-TF aligned
Fast + lightweight arrays
Uses BTC/ETH feed to stabilize ticks
Zero chart clutter
❤️ Free for Everyone
This tool is released 100% free to help the community trade with clarity and confidence.
Leave a like ⭐, comment 💬, or follow if you want more such institutional-grade tools.
⚠️ Disclaimer
This is for educational/analytical use only.
Not financial advice. Trade at your own risk.

150% Volume Surge1M charts show 150% volume surge to confirm scalping oppos in the direction of the general trend.

Market Structure Volume Time Velocity ProfileThis is the Market Structure Volume Time Velocity Profile (MSVTVP). It combines event-based profiling with advanced metrics like Time and Velocity (Flow Rate). Instead of fixed time periods, profiles are anchored to critical market events (Swings, Structure Breaks, Delta Breaks), giving you a precise view of value development during specific market phases.
## The 3 Dimensions of the Market
Unlike standard tools that only show Volume, MSVTVP allows you
to switch between three critical metrics:
1. **VOLUME Profile (The "Where"):**
* Shows standard acceptance. High volume nodes (HVN)
are magnets for price.
2. **TIME Profile (The "How Long"):**
* Similar to TPO, it measures how long price spent at each
level.
* **High Time:** True acceptance and fair value.
* **Low Time:** Rejection or rapid movement.
3. **VELOCITY Profile (The "How Fast"):**
* Measures the **speed of trading** (Contracts per Second).
This reveals the hidden intent of market participants.
* **High Velocity (Fast Flow):** Aggression. Initiative
buyers/sellers are hitting market orders rapidly. Often
seen at breakouts or in liquidity vacu.
* **Low Velocity (Slow Flow):** Absorption. Massive passive
limit orders are slowing price down despite high volume.
Often seen at major reversals ("hitting a brick wall").
Key Features:
1. **Event-Based Profile Anchoring:** The indicator starts a new
profile based on one of three user-selected events
('Profile Anchor'):
- **Swing:** A new profile begins when the 'impulse baseline'
(derived from intra-bar delta) changes. This baseline
adjusts when a new **price pivot** is confirmed: When a
price **high** forms, the baseline moves to the **lower**
of its previous level or the peak delta (max of
delta O/C) at the pivot. When a price **low** forms, it
moves to the **higher** of its previous level or the
trough delta (min of delta O/C) at the pivot.
- **Structure:** A new profile begins immediately on the bar
that *confirms* a market structure break (e.g., a new HH
or LL, based on a sequence of price pivots).
- **Delta:** A new profile begins immediately on the bar
that *confirms* a break in the *cumulative delta's*
market structure (e.g., a new HH or LL in the delta).
Both 'Swing' and 'Delta' anchors are derived from the same
**continuous (non-resetting) Cumulative Volume Profile Delta (CVPD)**,
which is built from the intra-bar statistical analysis.
2. **Statistical Profile Engine:** For each bar in the anchored
period, the indicator builds a volume profile on a lower
'Intra-Bar Timeframe'. Instead of simple tick counting, it
uses advanced statistical models:
- **Allocation ('Allot model'):** 'PDF' (Probability Density
Function) distributes volume proportionally across the
bar's range based on an assumed statistical model
(e.g., T4-Skew). 'Classic' assigns all volume to
the close.
- **Buy/Sell Split ('Volume Estimator'):** 'Dynamic'
applies a model that analyzes candle wicks and
recent trend to estimate buy/sell pressure. 'Classic'
classifies all volume based on the candle color.
3. **Visualization & Lag:** The indicator plots the final
profile (as a polygon) and the developing statistical
lines (POC, VA, VWAP, StdDev).
- **Note on Lag:** All anchor events require `Pivot Right Bars`
for confirmation.
- In 'Structure' and 'Delta' mode, the developing lines
(POC, VA, etc.) are plotted using a **non-repainting**
method (showing the value from `pivRi` bars ago).
- In 'Swing' mode, the profile is plotted **retroactively**,
starting *from the bar where the pivot occurred*. The
developing lines are also plotted with this full
`pivRi` lag to align with the past data.
4. **Flexible Display Modes:** The finalized profile can be displayed
in three ways: 'Up/Down' (buy vs. sell), 'Total' (combined
volume), and 'Delta' (net difference).
5. **Dynamic Row Sizing:** Includes an option ('Rows per Percent')
to automatically adjust the number of profile rows (buckets)
based on the profile's price range.
6. **Integrated Alerts:** Includes 13 alerts that trigger for:
- A new profile reset ('Profile was resetted').
- Price crossing any of the 6 developing levels (POC,
VA High/Low, VWAP, StdDev High/Low).
- **Alert Lag Assumption:** In 'Swing' mode, alerts are
delayed to match the retroactively plotted lines.
In 'Structure' and 'Delta' modes, alerts fire in
**real-time** based on the *current price* crossing
the *current (repainting)* value of the metric, which
may **differ from the non-repainting plotted line.**
**Caution: Real-Time Data Behavior (Intra-Bar Repainting)**
This indicator uses high-resolution intra-bar data. As a result, the
values on the **current, unclosed bar** (the real-time bar) will
update dynamically as new intra-bar data arrives. This includes
the values used for real-time alerts in 'Structure' and
'Delta' modes.
---
**DISCLAIMER**
1. **For Informational/Educational Use Only:** This indicator is
provided for informational and educational purposes only. It does
not constitute financial, investment, or trading advice, nor is
it a recommendation to buy or sell any asset.
2. **Use at Your Own Risk:** All trading decisions you make based on
the information or signals generated by this indicator are made
solely at your own risk.
3. **No Guarantee of Performance:** Past performance is not an
indicator of future results. The author makes no guarantee
regarding the accuracy of the signals or future profitability.
4. **No Liability:** The author shall not be held liable for any
financial losses or damages incurred directly or indirectly from
the use of this indicator.
5. **Signals Are Not Recommendations:** The alerts and visual signals
(e.g., crossovers) generated by this tool are not direct
recommendations to buy or sell. They are technical observations
for your own analysis and consideration.

Periodic Volume Time Velocity ProfileThis is the Periodic Volume Time Velocity Profile (PVTVP). It is an advanced professional profiling tool that goes beyond standard volume analysis by introducing Time and Velocity (Flow Rate) as profile dimensions.
By analyzing high-resolution intra-bar data, it builds
precise profiles for any custom period (Session, Day, Week, etc.),
helping you understand not just *where* the market traded,
but *how* it traded there.
## The 3 Dimensions of the Market
Unlike standard tools that only show Volume, PVTVP allows you
to switch between three critical metrics:
1. **VOLUME Profile (The "Where"):**
* Shows standard acceptance. High volume nodes (HVN)
are magnets for price.
2. **TIME Profile (The "How Long"):**
* Similar to TPO, it measures how long price spent at each
level.
* **High Time:** True acceptance and fair value.
* **Low Time:** Rejection or rapid movement.
3. **VELOCITY Profile (The "How Fast"):**
* Measures the **speed of trading** (Contracts per Second).
This reveals the hidden intent of market participants.
* **High Velocity (Fast Flow):** Aggression. Initiative
buyers/sellers are hitting market orders rapidly. Often
seen at breakouts or in liquidity vacuums.
* **Low Velocity (Slow Flow):** Absorption. Massive passive
limit orders are slowing price down despite high volume.
Often seen at major reversals ("hitting a brick wall").
## Key Features
1. **Statistical Volume Profile Engine:** For each bar in the selected
period, the indicator builds a complete volume profile on a lower
'Intra-Bar Timeframe'. Instead of simple tick counting, it uses
**statistical models ('PDF' allocation)** to distribute volume
across price levels and **advanced classifiers ('Dynamic' split)**
to determine the buy/sell pressure within that profile.
2. **Flexible Profile Display:** The **finalized profile** (plotted at
the end of each period) can be visualized in three distinct
ways: 'Up/Down' (buy vs. sell), 'Total' (combined volume),
and 'Delta' (net difference).
3. **Developing Key Levels:** The indicator also plots the developing
Point of Control (POC), Value Area (VA), VWAP, and Standard
Deviation bands in real-time as the period unfolds, providing
live insights into the emerging market structure.
4. **Dynamic Row Sizing:** Includes an option ('Rows per Percent')
to automatically adjust the number of profile rows (buckets)
based on the profile's price range, maintaining a consistent
visual density.
5. **Integrated Alerts:** Includes 12 alerts that trigger when the
main price crosses over or under the key developing levels:
POC, VWAP, Value Area High/Low, and the +/- Standard
Deviation bands.
**Caution: Real-Time Data Behavior (Intra-Bar Repainting)**
This indicator uses high-resolution intra-bar data. As a result, the
values on the **current, unclosed bar** (the real-time bar) will
update dynamically as new intra-bar data arrives. This behavior is
normal and necessary for this type of analysis. Signals should only
be considered final **after the main chart bar has closed.**
---
**DISCLAIMER**
1. **For Informational/Educational Use Only:** This indicator is
provided for informational and educational purposes only. It does
not constitute financial, investment, or trading advice, nor is
it a recommendation to buy or sell any asset.
2. **Use at Your Own Risk:** All trading decisions you make based on
the information or signals generated by this indicator are made
solely at your own risk.
3. **No Guarantee of Performance:** Past performance is not an
indicator of future results. The author makes no guarantee
regarding the accuracy of the signals or future profitability.
4. **No Liability:** The author shall not be held liable for any
financial losses or damages incurred directly or indirectly from
the use of this indicator.
5. **Signals Are Not Recommendations:** The alerts and visual signals
(e.g., crossovers) generated by this tool are not direct
recommendations to buy or sell. They are technical observations
for your own analysis and consideration.

Smarter Money Volume Rejection Blocks [PhenLabs]📊 Smarter Money Volume Rejection Blocks – Institutional Rejection Zone Detection
The Smarter Money Volume Rejection Blocks indicator combines high-volume analysis with statistical confidence intervals to identify where institutional traders are actively defending price levels through volume spikes and rejection patterns.
🔥 Core Methodology
Volume Spike Detection analyzes when current volume exceeds moving average by configurable multipliers (1.0-5.0x) to identify institutional activity
Rejection Candle Analysis uses dual-ratio system measuring wick percentage (30-90%) and maximum body ratio (10-60%) to confirm genuine rejections
Statistical Confidence Channels create three-level zones (upper, center, lower) based on ATR or Standard Deviation calculations
Smart Invalidation Logic automatically clears zones when price significantly breaches confidence levels to maintain relevance
Dynamic Channel Projection extends confidence intervals forward up to 200 bars with customizable length
Support Zone Identification detects bullish rejections where smart money absorbs selling pressure with high volume and strong lower wicks
Resistance Zone Mapping identifies bearish rejections where institutions defend price levels with volume spikes and pronounced upper wicks
Visual Information Dashboard displays real-time status table showing volume spike conditions and active support/resistance zones
⚙️ Technical Configuration
Dual Confidence Interval Methods: Choose between ATR-Based for trend-following environments or StdDev-Based for range-bound statistical precision
Volume Moving Average: Configurable period (default 20) for baseline volume comparison calculations
Volume Spike Multiplier: Adjustable threshold from 1.0 to 5.0 times average volume to filter institutional activity
Rejection Wick Percentage: Set minimum wick size from 30% to 90% of candle range for valid rejection detection
Maximum Body Ratio: Configure body-to-range ratio from 10% to 60% to ensure genuine rejection structures
Confidence Multiplier: Statistical multiplier (default 1.96) for 95% confidence interval calculations
Channel Projection Length: Extend confidence zones forward from 10 to 200 bars for anticipatory analysis
ATR Period: Customize Average True Range lookback from 5 to 50 bars for volatility-based calculations
StdDev Period: Adjust Standard Deviation period from 10 to 100 bars for statistical precision
🎯 Real-World Trading Applications
Identify high-probability support zones where institutional buyers have historically defended price with significant volume
Map resistance levels where smart money sellers consistently reject higher prices with volume confirmation
Combine with price action analysis to confirm breakout validity when price approaches confidence channel boundaries
Use invalidation signals to exit positions when smart money zones are definitively breached
Monitor the real-time dashboard to quickly assess current market structure and active rejection zones
Adapt strategy based on calculation method: ATR for trending markets, StdDev for ranging conditions
Set alerts on confidence level breaches to catch potential trend reversals or continuation patterns
📈 Visual Interpretation Guide
Green Zones indicate bullish rejection blocks where buyers defended with high volume and lower wicks
Red Zones indicate bearish rejection blocks where sellers defended with high volume and upper wicks
Solid Center Lines represent the core rejection price level where maximum volume activity occurred
Dashed Confidence Boundaries show upper and lower statistical limits based on volatility calculations
Zone Opacity decreases as channels extend forward to indicate decreasing confidence over time
Dashboard Color Coding provides instant visual feedback on active volume spike and zone conditions
⚠️ Important Considerations
Volume-based indicators identify historical rejection zones but cannot predict future price action with certainty
Market conditions change rapidly and institutional activity patterns evolve continuously
High volume does not guarantee level defense as market structure can shift without warning
Confidence intervals represent statistical probabilities, not guaranteed price boundaries

Weis Wave Volume MTF 🎯 Indicator Name
Weis Wave Volume (Multi‑Timeframe) — adapted from the original “Weis Wave Volume by LazyBear.”
This version adds multi‑timeframe (MTF) readings, configurable colors, font size, and screen position for clear dashboard‑style display.
🧠 Concept Background — What is Weis Wave Volume (WWV)?
The Weis Wave Volume indicator originates from Wyckoff and David Weis’ techniques.
Its purpose is to link price movement “waves” with the amount of traded volume to reveal how strong or weak each wave is.
Instead of showing bars one by one, WWV accumulates the total volume while price keeps moving in the same direction.
When price direction changes (up → down or down → up), it:
Finishes the previous wave volume total.
Starts a new wave and begins accumulating again.
Those wave volumes help traders see:
Effort vs Result: Big volume with small price move ⇒ absorption; low volume with big move ⇒ weak participation.
Trend confirmation or exhaustion: High volume waves in trend direction strengthen it, while low‑volume waves hint exhaustion.
⚙️ How this Script Works
Trend & Wave Detection
Compares close with the previous bar to determine up or down movement (mov).
Detects trend reversals (when mov direction changes).
Builds “waves,” each representing a continuous run of bars in one direction.
Volume Accumulation
While price keeps the same direction, the script adds each bar’s volume to the running total (vol).
When direction flips, it resets that total and starts a new wave.
Multi‑Timeframe Computation
Calculates these wave volumes on three timeframes at once, chosen dynamically:
Active Chart Timeframe Displays WWV for:
1 min 1 min
5 min 5 min
15 min 15 min
Any other Chart TF
It uses request.security() to pull each timeframe’s latest WWV value and current wave direction.
Visual Output
Instead of plotting histogram bars, it shows a table with three numeric values:
WWV (1): 25.3 M | (15): 312 M | (240): 2.46 B
Each value is color‑coded:
user‑selected Uptrend Color when price wave = up
user‑selected Downtrend Color when wave = down
You can position this small table in any corner/center (top / bottom × left / center / right).
Font size is user‑adjustable (Tiny → Huge).
📈 How Traders Use It
Quickly gauge buying vs selling effort across multiple horizons.
Compare short‑term wave volume to higher‑timeframe waves to spot:
Alignment → all up and big volumes = strong trend
Divergence → small or opposite‑colored higher‑TF wave = potential reversal or pause
Combine with Wyckoff, VSA, or standard trend analysis to judge if a breakout or pullback has real participation.
🧩 Key Features of This Version
Feature Description
Multi‑Timeframe Panel Displays WWV values for 3 selected TFs at once
Dynamic TF Mapping Auto‑adjusts which TFs to use based on chart
Up/Down Color Coding Customizable colors for wave direction
Adjustable Font and Placement Set font size (Tiny→Huge) and screen corner/center
No Histograms Keeps chart clean; acts as a compact WWV dashboard

RightFlow Universal Volume Profile - Any Market Any TimeframeSummary in one paragraph
RightFlow is a right anchored microstructure volume profile for stocks, futures, FX, and liquid crypto on intraday and daily timeframes. It acts only when several conditions align inside a session window and presents the result as a compact right side profile with value area, POC, a bull bear mix by price bin, and a HUD of profile VWAP and pressure shares. It is original because it distributes each bar’s weight into multiple mid price slices, blends bull bear pressure per bin with a CLV based split, and grows the profile to the right so price action stays readable. Add to a clean chart, read the table, and use the visuals. For conservative workflows read on bar close.
Scope and intent
• Markets. Major FX pairs, index futures, large cap equities and ETFs, liquid crypto.
• Timeframes. One minute to daily.
• Default demo used in the publication. SPY on 15 minute.
• Purpose. See where participation concentrates, which side dominated by price level, and how far price sits from VA and POC.
Originality and usefulness
• Unique fusion. Right anchored growth plus per bar slicing and CLV split, with weight modes Raw, Notional, and DeltaProxy.
• Failure mode addressed. False reads from single bar direction and coarse binning.
• Testability. All parts sit in Inputs and the HUD.
• Portable yardstick. Value Area percent and POC are universal across symbols.
• Protected scripts. Not applicable. Method and use are fully disclosed.
Method overview in plain language
Pick a scope Rolling or Today or This Week. Define a window and number of price bins. For each bar, split its range into small slices, assign each slice a weight from the selected mode, and split that weight by CLV or by bar direction. Accumulate totals per bin. Find the bin with the highest total as POC. Expand left and right until the chosen share of total volume is covered to form the value area. Compute profile VWAP for all, buyers, and sellers and show them with pressure shares.
Base measures
Range basis. High minus low and mid price samples across the bar window.
Return basis. Not used. VWAP trio is price weighted by weights.
Components
• RightFlow Bins. Price histogram that grows to the right.
• Bull Bear Split. CLV based 0 to 1 share or pure bar direction.
• Weight Mode. Raw volume, notional volume times close, or DeltaProxy focus.
• Value Area Engine. POC then outward expansion to target share.
• HUD. Profile VWAP, Buy and Sell percent, winner delta, split and weight mode.
• Session windows optional. Scope resets on day or week.
Fusion rule
Color of each bin is the convex blend of bull and bear shares. Value area shading is lighter inside and darker outside.
Signal rule
This is context, not a trade signal. A strong separation between buy and sell percent with price holding inside VA often confirms balance. Price outside VA with skewed pressure often marks initiative moves.
What you will see on the chart
• Right side bins with blended colors.
• A POC line across the profile width.
• Labels for POC, VAH, and VAL.
• A compact HUD table in the top right.
Table fields and quick reading guide
• VWAP. Profile VWAP.
• Buy and Sell. Pressure shares in percent.
• Delta Winner. Winner side and margin in percent.
• Split and Weight. The active modes.
Reading tip. When Session scope is Today or This Week and Buy minus Sell is clearly positive or negative, that side often controls the day’s narrative.
Inputs with guidance
Setup
• Profile scope. Rolling or session reset. Rolling uses window bars.
• Rolling window bars. Typical 100 to 300. Larger is smoother.
Binning
• Price bins. Typical 32 to 128. More bins increase detail.
• Slices per bar. Typical 3 to 7. Raising it smooths distribution.
Weighting
• Weight mode. Raw, Notional, DeltaProxy. Notional emphasizes expensive prints.
• Bull Bear split. CLV or BarDir. CLV is more nuanced.
• Value Area percent. Typical 68 to 75.
View
• Profile width in bars, color split toggle, value area shading, opacities, POC line, VA labels.
Usage recipes
Intraday trend focus
• Scope Today, bins 64, slices 5, Value Area 70.
• Split CLV, Weight Notional.
Intraday mean reversion
• Scope Today, bins 96, Value Area 75.
• Watch fades back to POC after initiative pushes.
Swing continuation
• Scope Rolling 200 bars, bins 48.
• Use Buy Sell skew with price relative to VA.
Realism and responsible publication
No performance claims. Shapes can move while a bar forms and settle on close. Education only.
Honest limitations and failure modes
Thin liquidity and data gaps can distort bin weights. Very quiet regimes reduce contrast. Session time is the chart venue time.
Open source reuse and credits
None.
Legal
Education and research only. Not investment advice. Test on history and simulation before live use.

Volume Order Block Scanner [BOSWaves]Volume Order Block Scanner - Dynamic Detection of High-Volume Supply and Demand Zones
Overview
The Volume Order Block Scanner introduces a refined approach to institutional zone mapping, combining volume-weighted order flow, structural displacement, and ATR-based proportionality to identify regions of aggressive participation from large entities.
Unlike static zone mapping or simplistic body-size filters, this framework dynamically evaluates each candle through a multi-layer model of relative volume, candle structure, and volatility context to isolate genuine order block formations while filtering out market noise.
Each identified zone represents a potential institutional footprint, defined by significant volume surges and efficient body-to-ATR relationships that indicate purposeful positioning. Once mapped, each order block is dynamically adjusted for volatility and tracked throughout its lifecycle - from creation to mitigation to potential invalidation - producing an evolving liquidity map that adapts with price.
This adaptive behavior allows traders to visualize where liquidity was absorbed and where it remains unfilled, revealing the structural foundation of institutional intent across timeframes.
Theoretical Foundation
At its core, the Volume Order Block Scanner is built on the interaction between volume displacement and structural imbalance. Traditional order block systems often rely on fixed candle formations or simple engulfing logic, neglecting the fundamental driver of institutional activity: volume concentration relative to volatility.
This framework redefines that approach. Each candle is filtered through two comparative ratios:
Relative Volume Ratio (RVR) - the candle’s volume compared to its rolling average, confirming genuine transactional surges.
Body-ATR Ratio (BAR) - a measure of displacement efficiency relative to recent volatility, ensuring structural strength.
Only when both conditions align is an order block validated, marking a displacement event significant enough to create a lasting imbalance.
By embedding this logic within a volatility-adjusted environment, the system maintains scalability across asset classes and volatility regimes - equally effective in crypto, forex, or index markets.
How It Works
The Volume Order Block Scanner operates through a structured multi-stage process:
Displacement Detection - Identifies candles whose body and volume exceed dynamic thresholds derived from ATR and rolling volume averages. These represent the origin points of institutional aggression.
Zone Construction - Each qualified candle generates an order block with ATR-proportional dimensions to ensure consistency across instruments and timeframes. The zone includes two regions: Body Zone (the precise initiation point of displacement) and Wick Imbalance (the residual inefficiency representing unfilled liquidity).
Lifecycle Tracking - Each zone is continuously monitored for market interaction. Reactions within a defined window are classified as respected, mitigated, or invalidated, giving traders a data-driven sense of ongoing institutional relevance.
Volume Confirmation Layer - Reinforces signal integrity by ensuring that all detected blocks correspond with meaningful increases in transactional activity.
Temporal Decay Control - Zones that remain untested beyond a set period gradually lose visual and analytical weight, maintaining chart clarity and contextual precision.
Interpretation
The Volume Order Block Scanner visualizes how institutional participants interact with the market through zones of accumulation and distribution.
Bullish order blocks denote demand imbalances where price displaced upward under high volume; bearish order blocks signify supply regions formed by concentrated selling pressure.
Price revisiting these areas often reflects institutional re-entry or liquidity rebalancing, offering actionable insights for both continuation and reversal scenarios.
By continuously monitoring interaction and expiry, the framework enables traders to distinguish between active institutional footprints and historical liquidity artifacts.
Strategy Integration
The Volume Order Block Scanner integrates naturally into advanced structural and order-flow methodologies:
Liquidity Mapping : Identify high-volume regions that are likely to influence future price reactions.
Break-of-Structure Confirmation : Validate BOS and CHOCH signals through aligned order block behavior.
Volume Confluence : Combine with BOSWaves volume or momentum indicators to confirm real institutional intent.
Smart-Money Frameworks : Utilize order block retests as precision entry zones within SMC-based setups.
Trend Continuation : Filter zones in line with higher-timeframe bias to maintain directional integrity.
Technical Implementation Details
Core Engine : Dual-filter mechanism using Relative Volume Ratio (RVR) and Body-ATR Ratio (BAR).
Volatility Framework : ATR-based scaling for cross-asset proportionality.
Zone Composition : Body and wick regions plotted independently for visual clarity of imbalance.
Lifecycle Logic : Real-time monitoring of reaction, mitigation, and invalidation states.
Directional Coloring : Distinct bullish and bearish shading with adjustable transparency.
Computation Efficiency : Lightweight structure suitable for multi-timeframe or multi-asset environments.
Optimal Application Parameters
Timeframe Guidance:
5m - 15m : Reactive intraday zones for short-term liquidity engagement.
1H - 4H : Medium-term structures for swing or intraday trend mapping.
Daily - Weekly : Macro accumulation and distribution footprints.
Suggested Configuration:
Relative Volume Threshold : 1.5× - 2.0× average volume.
Body-ATR Threshold : 0.8× - 1.2× for valid displacement.
Zone Expiry : 5 - 10 bars for intraday use, 15 - 30 for swing/macro contexts.
Parameter optimization should be asset-specific, tuned to volatility conditions and liquidity depth.
Performance Characteristics
High Effectiveness:
Markets exhibiting clear displacement and directional flow.
Environments with consistent volume expansion and liquidity inefficiencies.
Reduced Effectiveness:
Range-bound markets with frequent false impulses.
Low-volume sessions lacking institutional participation.
Integration Guidelines
Confluence Framework : Pair with structure-based BOS or liquidity tools for validation.
Risk Management : Treat active order blocks as contextual areas of interest, not guaranteed reversal points.
Multi-Timeframe Logic : Derive bias from higher-timeframe blocks and execute from refined lower-timeframe structures.
Volume Verification : Confirm each reaction with concurrent volume acceleration to avoid false liquidity cues.
Disclaimer
The Volume Order Block Scanner is a quantitative mapping framework designed for professional traders and analysts. It is not a predictive or guaranteed system of profit.
Performance depends on correct configuration, market conditions, and disciplined risk management. BOSWaves recommends using this indicator as part of a comprehensive analytical process - integrating structural, volume, and liquidity context for accurate interpretation.

Cumulative Volume Delta Divergence Periodic EMACumulative Volume Delta Divergence Periodic EMA
extended indicator
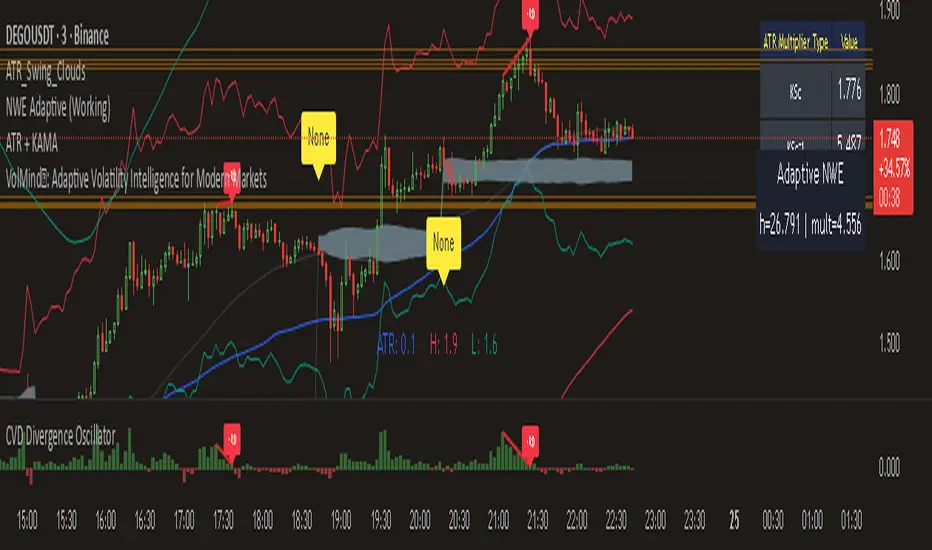
Volume Delta Volume Signals by Claudio [hapharmonic]// This Pine Script™ code is subject to the terms of the Mozilla Public License 2.0 at mozilla.org
// © hapharmonic
//@version=6
FV = format.volume
FP = format.percent
indicator('Volume Delta Volume Signals by Claudio ', format = FV, max_bars_back = 4999, max_labels_count = 500)
//------------------------------------------
// Settings |
//------------------------------------------
bool usecandle = input.bool(true, title = 'Volume on Candles',display=display.none)
color C_Up = input.color(#12cef8, title = 'Volume Buy', inline = ' ', group = 'Style')
color C_Down = input.color(#fe3f00, title = 'Volume Sell', inline = ' ', group = 'Style')
// ✅ Nueva entrada para colores de señales
color buySignalColor = input.color(color.new(color.green, 0), "Buy Signal Color", group = "Signals")
color sellSignalColor = input.color(color.new(color.red, 0), "Sell Signal Color", group = "Signals")
string P_ = input.string(position.top_right,"Position",options = ,
group = "Style",display=display.none)
string sL = input.string(size.small , 'Size Label', options = , group = 'Style',display=display.none)
string sT = input.string(size.normal, 'Size Table', options = , group = 'Style',display=display.none)
bool Label = input.bool(false, inline = 'l')
History = input.bool(true, inline = 'l')
// Inputs for EMA lengths and volume confirmation
bool MAV = input.bool(true, title = 'EMA', group = 'EMA')
string volumeOption = input.string('Use Volume Confirmation', title = 'Volume Option', options = , group = 'EMA',display=display.none)
bool useVolumeConfirmation = volumeOption == 'none' ? false : true
int emaFastLength = input(12, title = 'Fast EMA Length', group = 'EMA',display=display.none)
int emaSlowLength = input(26, title = 'Slow EMA Length', group = 'EMA',display=display.none)
int volumeConfirmationLength = input(6, title = 'Volume Confirmation Length', group = 'EMA',display=display.none)
string alert_freq = input.string(alert.freq_once_per_bar_close, title="Alert Frequency",
options= ,group = "EMA",
tooltip="If you choose once_per_bar, you will receive immediate notifications (but this may cause interference or indicator repainting).
\n However, if you choose once_per_bar_close, it will wait for the candle to confirm the signal before notifying.",display=display.none)
//------------------------------------------
// UDT_identifier |
//------------------------------------------
type OHLCV
float O = open
float H = high
float L = low
float C = close
float V = volume
type VolumeData
float buyVol
float sellVol
float pcBuy
float pcSell
bool isBuyGreater
float higherVol
float lowerVol
color higherCol
color lowerCol
//------------------------------------------
// Calculate volumes and percentages |
//------------------------------------------
calcVolumes(OHLCV ohlcv) =>
var VolumeData data = VolumeData.new()
data.buyVol := ohlcv.V * (ohlcv.C - ohlcv.L) / (ohlcv.H - ohlcv.L)
data.sellVol := ohlcv.V - data.buyVol
data.pcBuy := data.buyVol / ohlcv.V * 100
data.pcSell := 100 - data.pcBuy
data.isBuyGreater := data.buyVol > data.sellVol
data.higherVol := data.isBuyGreater ? data.buyVol : data.sellVol
data.lowerVol := data.isBuyGreater ? data.sellVol : data.buyVol
data.higherCol := data.isBuyGreater ? C_Up : C_Down
data.lowerCol := data.isBuyGreater ? C_Down : C_Up
data
//------------------------------------------
// Get volume data |
//------------------------------------------
ohlcv = OHLCV.new()
volData = calcVolumes(ohlcv)
// Plot volumes and create labels
plot(ohlcv.V, color=color.new(volData.higherCol, 90), style=plot.style_columns, title='Total',display = display.all - display.status_line)
plot(ohlcv.V, color=volData.higherCol, style=plot.style_stepline_diamond, title='Total2', linewidth = 2,display = display.pane)
plot(volData.higherVol, color=volData.higherCol, style=plot.style_columns, title='Higher Volume', display = display.all - display.status_line)
plot(volData.lowerVol , color=volData.lowerCol , style=plot.style_columns, title='Lower Volume',display = display.all - display.status_line)
S(D,F)=>str.tostring(D,F)
volStr = S(math.sign(ta.change(ohlcv.C)) * ohlcv.V, FV)
buyVolStr = S(volData.buyVol , FV )
sellVolStr = S(volData.sellVol , FV )
// ✅ MODIFICACIÓN: Porcentaje sin decimales
buyPercentStr = str.tostring(math.round(volData.pcBuy)) + " %"
sellPercentStr = str.tostring(math.round(volData.pcSell)) + " %"
totalbuyPercentC_ = volData.buyVol / (volData.buyVol + volData.sellVol) * 100
sup = not na(ohlcv.V)
if sup
TC = text.align_center
CW = color.white
var table tb = table.new(P_, 6, 6, bgcolor = na, frame_width = 2, frame_color = chart.fg_color, border_width = 1, border_color = CW)
tb.cell(0, 0, text = 'Volume Candles', text_color = #FFBF00, bgcolor = #0E2841, text_halign = TC, text_valign = TC, text_size = sT)
tb.merge_cells(0, 0, 5, 0)
tb.cell(0, 1, text = 'Current Volume', text_color = CW, bgcolor = #0B3040, text_halign = TC, text_valign = TC, text_size = sT)
tb.merge_cells(0, 1, 1, 1)
tb.cell(0, 2, text = 'Buy', text_color = #000000, bgcolor = #92D050, text_halign = TC, text_valign = TC, text_size = sT)
tb.cell(1, 2, text = 'Sell', text_color = #000000, bgcolor = #FF0000, text_halign = TC, text_valign = TC, text_size = sT)
tb.cell(0, 3, text = buyVolStr, text_color = CW, bgcolor = #074F69, text_halign = TC, text_valign = TC, text_size = sT)
tb.cell(1, 3, text = sellVolStr, text_color = CW, bgcolor = #074F69, text_halign = TC, text_valign = TC, text_size = sT)
tb.cell(0, 5, text = 'Net: ' + volStr, text_color = CW, bgcolor = #074F69, text_halign = TC, text_valign = TC, text_size = sT)
tb.merge_cells(0, 5, 1, 5)
tb.cell(0, 4, text = buyPercentStr, text_color = CW, bgcolor = #074F69, text_halign = TC, text_valign = TC, text_size = sT)
tb.cell(1, 4, text = sellPercentStr, text_color = CW, bgcolor = #074F69, text_halign = TC, text_valign = TC, text_size = sT)
cellCount = 20
filledCells = 0
for r = 5 to 1 by 1
for c = 2 to 5 by 1
if filledCells < cellCount * (totalbuyPercentC_ / 100)
tb.cell(c, r, text = '', bgcolor = C_Up)
else
tb.cell(c, r, text = '', bgcolor = C_Down)
filledCells := filledCells + 1
filledCells
if Label
sp = ' '
l = label.new(bar_index, ohlcv.V,
text=str.format('Net: {0}\nBuy: {1} ({2})\nSell: {3} ({4})\n{5}/\\\n {5}l\n {5}l',
volStr, buyVolStr, buyPercentStr, sellVolStr, sellPercentStr, sp),
style=label.style_none, textcolor=volData.higherCol, size=sL, textalign=text.align_left)
if not History
(l ).delete()
//------------------------------------------
// Draw volume levels on the candlesticks |
//------------------------------------------
float base = na,float value = na
bool uc = usecandle and sup
if volData.isBuyGreater
base := math.min(ohlcv.O, ohlcv.C)
value := base + math.abs(ohlcv.O - ohlcv.C) * (volData.pcBuy / 100)
else
base := math.max(ohlcv.O, ohlcv.C)
value := base - math.abs(ohlcv.O - ohlcv.C) * (volData.pcSell / 100)
barcolor(sup ? color.new(na, na) : ohlcv.C < ohlcv.O ? color.red : color.green,display = usecandle? display.all:display.none)
UseC = uc ? volData.higherCol:color.new(na, na)
plotcandle(uc?base:na, uc?base:na, uc?value:na, uc?value:na,
title='Body', color=UseC, bordercolor=na, wickcolor=UseC,
display = usecandle ? display.all - display.status_line : display.none, force_overlay=true,editable=false)
plotcandle(uc?ohlcv.O:na, uc?ohlcv.H:na, uc?ohlcv.L:na, uc?ohlcv.C:na,
title='Fill', color=color.new(UseC,80), bordercolor=UseC, wickcolor=UseC,
display = usecandle ? display.all - display.status_line : display.none, force_overlay=true,editable=false)
//------------------------------------------------------------
// Plot the EMA and filter out the noise with volume control. |
//------------------------------------------------------------
float emaFast = ta.ema(ohlcv.C, emaFastLength)
float emaSlow = ta.ema(ohlcv.C, emaSlowLength)
bool signal = emaFast > emaSlow
color c_signal = signal ? C_Up : C_Down
float volumeMA = ta.sma(ohlcv.V, volumeConfirmationLength)
bool crossover = ta.crossover(emaFast, emaSlow)
bool crossunder = ta.crossunder(emaFast, emaSlow)
isVolumeConfirmed(source, length, ma) =>
math.sum(source > ma ? source : 0, length) >= math.sum(source < ma ? source : 0, length)
bool ISV = isVolumeConfirmed(ohlcv.V, volumeConfirmationLength, volumeMA)
bool crossoverConfirmed = crossover and (not useVolumeConfirmation or ISV)
bool crossunderConfirmed = crossunder and (not useVolumeConfirmation or ISV)
PF = MAV ? emaFast : na
PS = MAV ? emaSlow : na
p1 = plot(PF, color = c_signal, editable = false, force_overlay = true, display = display.pane)
plot(PF, color = color.new(c_signal, 80), linewidth = 10, editable = false, force_overlay = true, display = display.pane)
plot(PF, color = color.new(c_signal, 90), linewidth = 20, editable = false, force_overlay = true, display = display.pane)
plot(PF, color = color.new(c_signal, 95), linewidth = 30, editable = false, force_overlay = true, display = display.pane)
plot(PF, color = color.new(c_signal, 98), linewidth = 45, editable = false, force_overlay = true, display = display.pane)
p2 = plot(PS, color = c_signal, editable = false, force_overlay = true, display = display.pane)
plot(PS, color = color.new(c_signal, 80), linewidth = 10, editable = false, force_overlay = true, display = display.pane)
plot(PS, color = color.new(c_signal, 90), linewidth = 20, editable = false, force_overlay = true, display = display.pane)
plot(PS, color = color.new(c_signal, 95), linewidth = 30, editable = false, force_overlay = true, display = display.pane)
plot(PS, color = color.new(c_signal, 98), linewidth = 45, editable = false, force_overlay = true, display = display.pane)
fill(p1, p2, top_value=crossover ? emaFast : emaSlow,
bottom_value =crossover ? emaSlow : emaFast,
top_color =color.new(c_signal, 80),
bottom_color =color.new(c_signal, 95)
)
// ✅ Usar colores configurables para señales
plotshape(crossoverConfirmed and MAV, style=shape.triangleup , location=location.belowbar, color=buySignalColor , size=size.small, force_overlay=true,display =display.pane)
plotshape(crossunderConfirmed and MAV, style=shape.triangledown, location=location.abovebar, color=sellSignalColor, size=size.small, force_overlay=true,display =display.pane)
string msg = '---------\n'+"Buy volume ="+buyVolStr+"\nBuy Percent = "+buyPercentStr+"\nSell volume = "+sellVolStr+"\nSell Percent = "+sellPercentStr+"\nNet = "+volStr+'\n---------'
if crossoverConfirmed
alert("Price (" + str.tostring(close) + ") Crossed over MA\n" + msg, alert_freq)
if crossunderConfirmed
alert("Price (" + str.tostring(close) + ") Crossed under MA\n" + msg, alert_freq)

VSA Volume MonitorDescription
This script provides a clear and adaptable visual representation of volume activity, helping traders understand how current participation compares to recent norms.
It calculates a moving average of volume over a user-defined smoothing window and uses that baseline to classify each bar’s volume into several intensity levels.
Bars are color-coded to reflect these levels:
• Blue for below-average activity
• Green for moderate activity
• Yellow for above-average surges
• Red for exceptionally high or climactic volume
In addition to color-coded bars, the script plots two reference bands that represent the typical (baseline) and elevated (climactic) volume zones.
These bands form a shaded cloud that helps visually separate normal market participation from periods of unusual crowd activity or volatility.
The purpose of this indicator is purely visual and informational — it does not generate buy or sell signals, and it does not predict future price movement.
Instead, it gives traders an at-a-glance view of how market interest is shifting, so they can combine that context with their own analysis or strategy.
This tool is lightweight, easy to read, and designed for use alongside other forms of technical analysis, making it suitable for traders who want to build their own framework for understanding volume behavior.
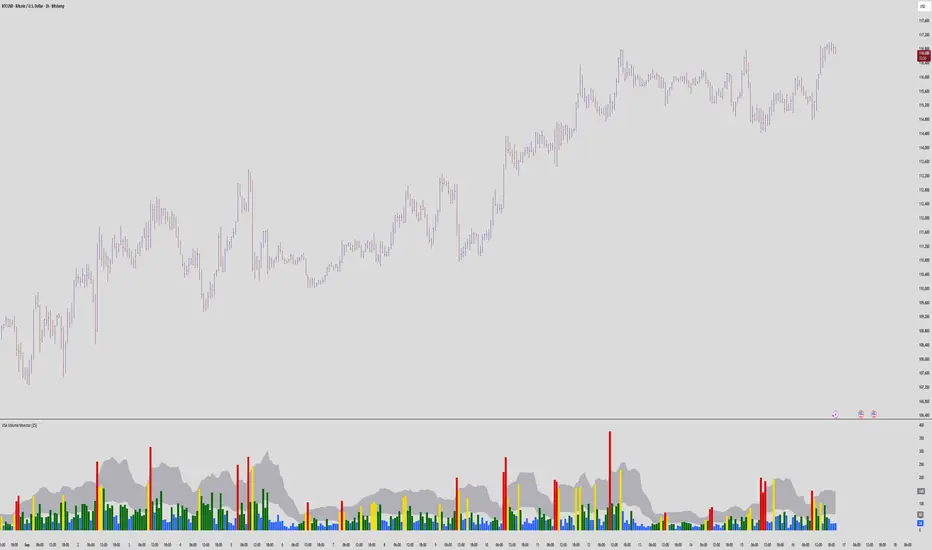
Prev Day Volume ProfileWhat the script does
Calculates yesterday’s Volume Profile from the bars on your chart (not tick data) and derives:
POC (Point of Control)
VAL (Value Area Low)
VAH (Value Area High)
Draws three horizontal lines for today:
POC in orange
VAL and VAH in purple
Adds labels on the right edge that show the level name and the exact price (e.g., POC 1.2345).
Why it’s bar-based (not tick-based)
Pine Script can’t fetch external tick/aggTrades data. The script approximates a volume profile by distributing each bar’s volume across the price bins that the bar’s high–low range covers. For “yesterday”, this produces a stable, TV-native approximation that’s usually sufficient for intraday trading.
Key inputs
Value Area %: Defaults to 0.70 (70%)—the typical value area range.
TZ Offset vs Exchange (hours): Shifts the day boundary to match your desired session (e.g., Europe/Berlin: +1 winter / +2 summer). This ensures “yesterday” means 00:00–24:00 in your target timezone.
Row Size: Manual? / Manual Row Size: If enabled, you can set the price bin size yourself. Otherwise, the script chooses a TV-like step from syminfo.mintick.
Colors & Line width: POC orange; VAL/VAH purple; configurable width.
