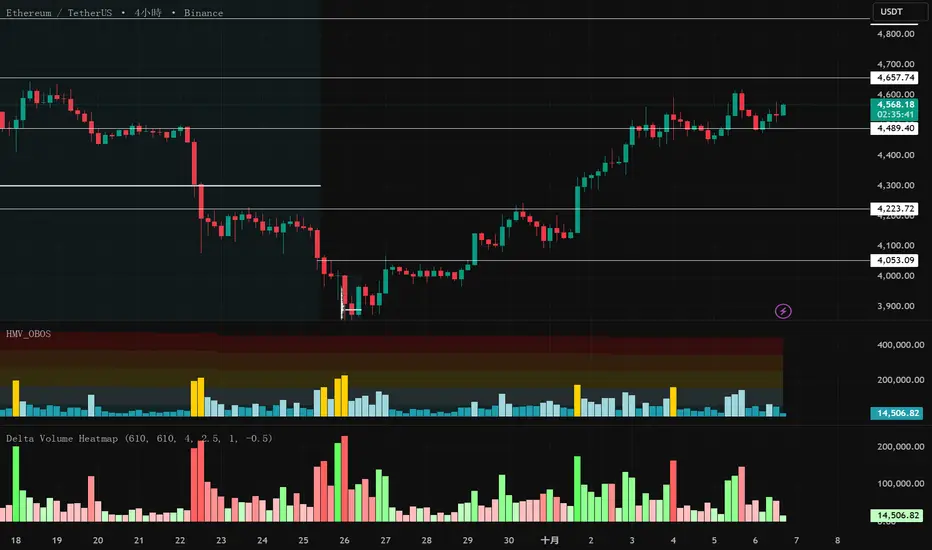
Delta Volume Heatmap Delta Volume Heatmap
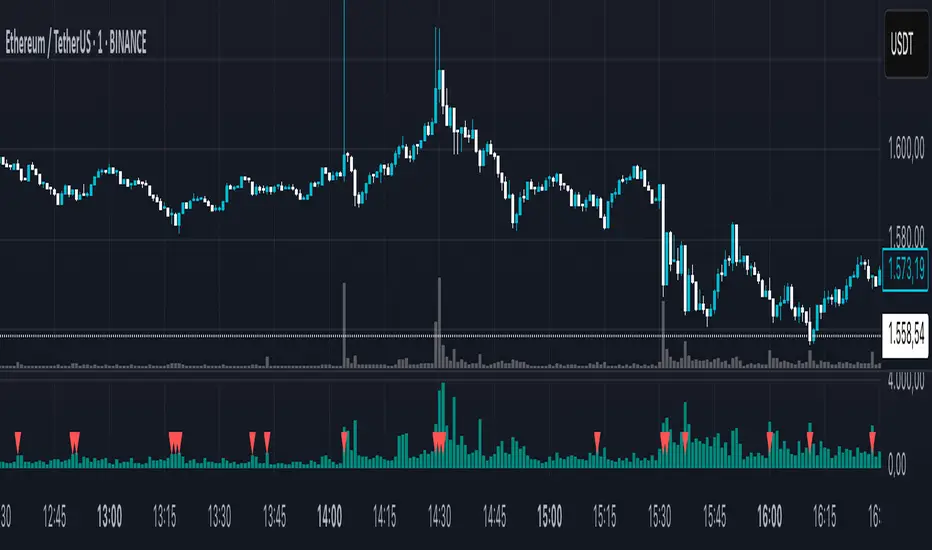
The Delta Volume Heatmap visualizes the real-time strength of per-bar delta volume — highlighting the imbalance between buying and selling pressure.
Each column’s color intensity reflects how strong the delta volume deviates from its moving average and standard deviation.
Green tones = Buy-dominant activity (bullish imbalance)
Red tones = Sell-dominant activity (bearish imbalance)
This tool helps traders quickly identify:
Abnormal volume spikes
Absorption or exhaustion zones
Potential reversal or continuation signals
Wyszukaj w skryptach "Volume"
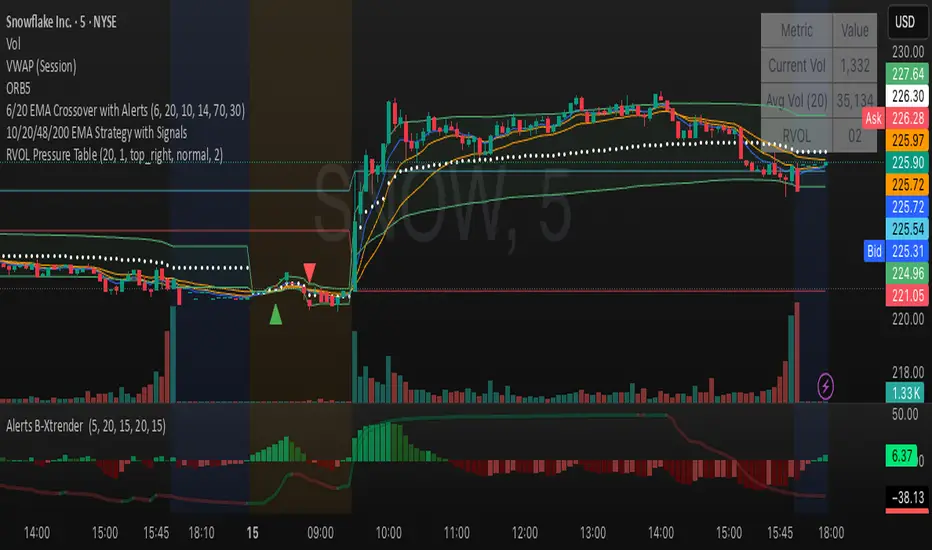
Relative Volume Table with PressureDisplay relative Volume as a table in the top right corner. Turns green when volume is high and price is increasing and red when volume is high and price is decreasing. I use this on D timeframe at the open to screen for stocks breaking out.
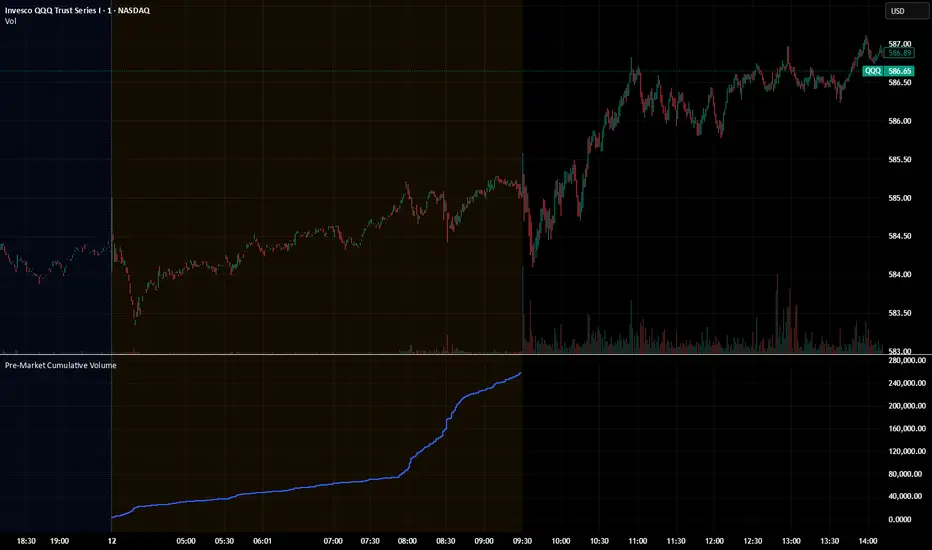
Pre‑Market Cumulative VolumeDescription:
This indicator plots the cumulative trading volume for the pre‑market session on intraday charts. It automatically detects when a bar is part of the extended pre‑market period using TradingView’s built‑in session variables, starts a new running total at the first pre‑market bar of each day, and resets at the beginning of regular trading hours. During regular market hours or the post‑market session, the indicator does not display values.
To use this script effectively, ensure extended‑hour data is enabled on the chart, and select an intraday timeframe where pre‑market data is available. The result is a simple yet powerful tool for monitoring cumulative pre‑market activity.
How to use
Add the script to a chart and make sure you are on an intraday timeframe (e.g., 1‑min, 5‑min). Extended‑hour data must be enabled; otherwise session.ispremarket will always be false.
During each pre‑market session, the indicator will reset at the first pre‑market bar and then accumulate the volume of subsequent pre‑market bars.
Outside the pre‑market (regular trading hours and post‑market), the plot outputs na, so it does not draw on those bars.
Customization (optional)
If you want to define your own pre‑market times instead of relying on TradingView’s built‑in session, you can replace the isPreMarket line with a time‑range check. For example, isPreMarket = not na(time(timeframe.period, "0400-0930")) detects bars between 04:00 and 09:30 (U.S. Eastern time). You can parameterize the session string with input.session("0400-0930", "Pre‑Market Session") to let users adjust it.

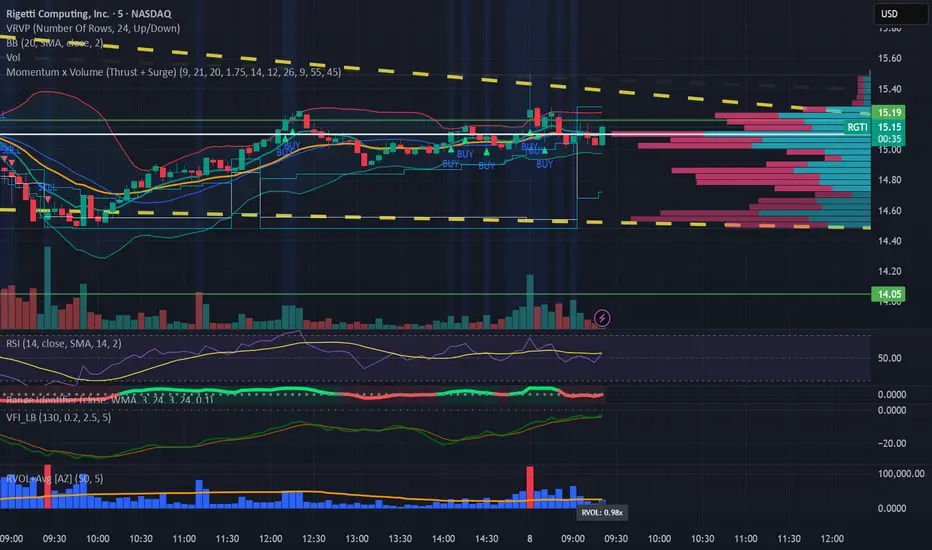
Relative Volume (RVOL) + Average Volume [AZ]The script helps you instantly see whether today’s volume is unusual compared to the past (relative volume). It’s built for breakout/fakeout filters, like the 15-minute ORB strategy you’re running.
VSA Volume OverlaySimple. When the VSA volume is above the average volume the line will draw orange. When below average volume plot , it will draw white.

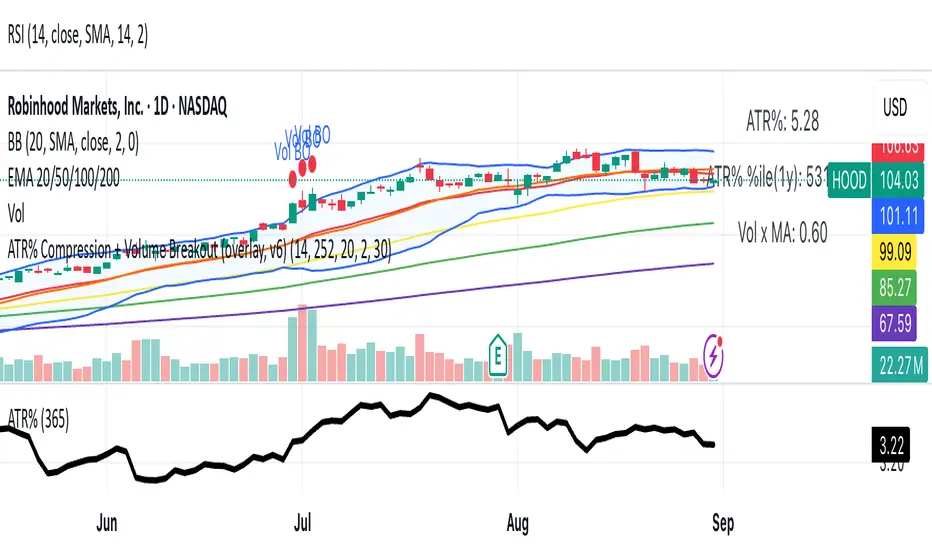
ATR% Compression + Volume Breakout (overlay price panel)this is your signal/alerts tool. It tints compression regimes, marks volume-breakout bars, and fires the two alerts (“Compression Detected” and “Volume Breakout + ATR% Rising”).
Momentum x Volume (Thrust + Surge)highlights bars where trend, momentum, and volume align. It filters for an uptrend (EMA pair or VWAP), confirms thrust with MACD histogram, measures momentum quality with volume-weighted RSI (vwRSI), and requires a volume surge vs a rolling average before signaling. The goal: surface higher-conviction breakouts and breakdowns while avoiding weak, low-volume moves.

Buy Sell Volume Dashboard (Conditional Colors)Display all data in the box (dashboard) on the top right chart.
✅ Data output:
Buy Volume
Sell Volume
Volume Difference (Buy – Sell)
Buy % / Sell % Dominance
✅ Auto according to the timeframe we open (for example if open 5m, data follows 5m; if daily, follow daily).

M3EDGE™ Relative Volume (RVOL)Relative Volume (RVOL) compares the current volume to its historical average.
🎯 Goal: Spot abnormal flows and anticipate impulsive moves.
🔍 M3EDGE™ Key Reading:
• RVOL > 2.0 → Likely institutional activity.
• RVOL > 1.5 → Heightened surveillance: potential move building.
• Price falling + high RVOL → Stealth accumulation / sell-side absorption.
• Price rising + high RVOL → Confirmed breakout with real flows.
💡 In the M3EDGE™ method, RVOL filters out false signals and validates setups by aligning flow + structure + momentum.
Applied to ETFs or stocks, it reveals what price action alone won’t show

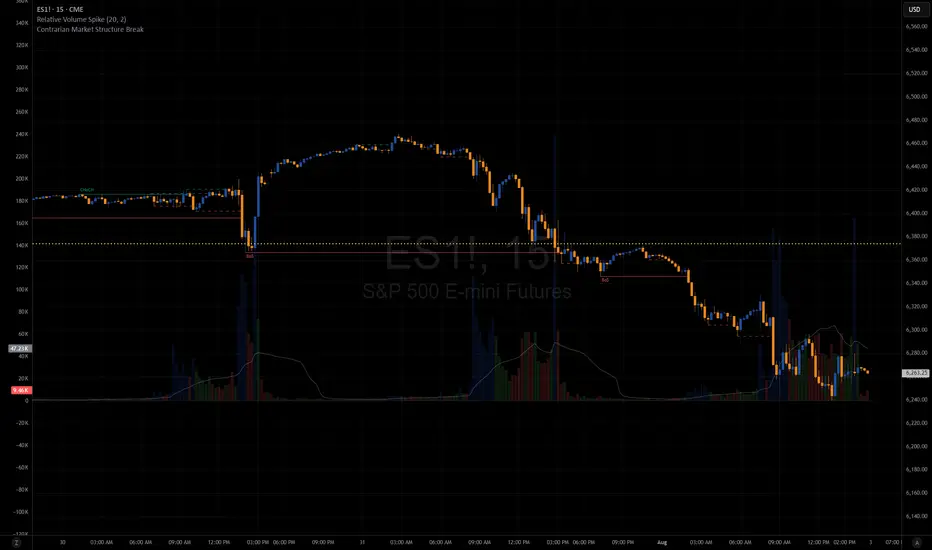
Relative Volume SpikeThis indicator lets you know when a wick has 2x (default value) more volume than the average.
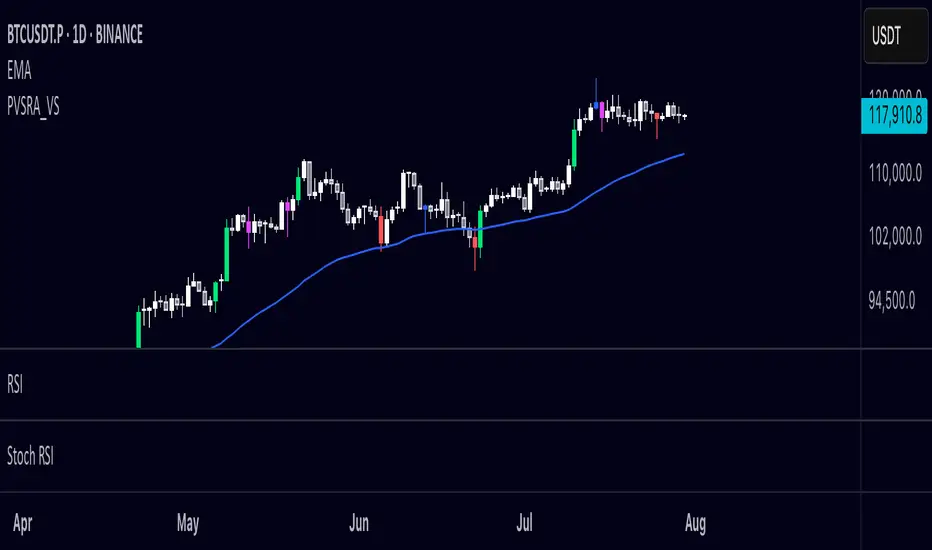
PVSRA Volume Suite OverlayPVSRA Volume Suite v5 is a volume-based candle coloring tool inspired by the original PVSRA system from MT4. It identifies and highlights Climax candles (extremely high volume/spread) and Above-Average volume candles relative to the last 10 bars. Bullish and bearish candles are colored differently based on their volume classification to help spot potential institutional activity or market reversals.
This script also includes a symbol override option, allowing volume analysis from another ticker (e.g., BTC volume on altcoin charts).
📌 Credit to creengrack for the open-source code that informed this TradingView version.
Thank you
Session VolumeThis script tracks and displays 30-minute volume segments during the Regular Trading Hours (RTH) session. It allows traders to visually compare each time block’s volume today vs. the same block from the previous day, helping spot early signs of strength, weakness, or divergence.
Features:
Tracks 13 blocks from 9:30 AM to 4:15 PM ET.
Compares today's volume against historical volume from the same time block yesterday.
Highlights percentage changes per block.
Summary row totals show overall volume trend today vs. yesterday.
This tool is useful for discretionary traders, auction market theorists, and anyone who incorporates market-generated information into their decision-making.

Climax Volume FilterThis script helps filter out volume spikes caused by sudden market events (e.g. CPI, FOMC), which can distort volume-based analysis.
It identifies and optionally smooths or excludes high “climax” candles to provide a clearer view of natural volume trends during pullbacks and consolidations.
Use it to:
• Avoid misreading volume during news events
• Improve your reading of exhaustion vs. continuation
• Support better entry timing during flag or FVG setups
Cumulative Volume Delta with SignalThis premium-grade technical indicator provides deep insights into market sentiment by tracking the difference between buying and selling pressure through volume analysis. SCVD offers a sophisticated approach to volume profile analysis, helping traders identify potential trend reversals and momentum shifts before price action confirms them.
Key Features:
Real-Time Volume Delta Analysis: Visualizes buying vs. selling pressure through color-coded candles
Smart Signal Line Integration: EMA-based signal line helps identify trend changes and trading opportunities
Multi-Timeframe Capabilities: Automatically selects optimal lower timeframes for precision or can be customized
Daily Reset Option: Anchor period functionality for intraday delta analysis
Professional Visualization: Clean, color-coded display with zero reference line
Trading Applications:
Identify divergences between price action and volume delta for potential reversals
Spot accumulation/distribution patterns through delta behavior
Use signal line crossovers for entry/exit timing
Confirm trend strength by analyzing delta momentum
Detect potential false breakouts through volume confirmation
Perfect for day traders, swing traders, and institutional investors who rely on volume analysis for decision-making. This indicator combines sophisticated volume delta metrics with an intuitive interface to provide actionable trading insights across all markets and timeframes.

Projected VolumeCalculates Projected Volume for the current trading day. Builds on Pocket Pivot Breakout Script by simatricks.

Ticker Screener by Volume Heatmap [SS]Fun little screener that creates a heatmap by daily volume trend.
The numbers expressed are the Sell to Buy ratio (Selling volume / buying volume). The % is the % change over the lookback period.
The default lookback period is 25 days, but you can adjust it as you see fit. The brightness of the green and red will change based on the extent of buying / selling.
Anything 1 or over means there is a lot of selling. A percent change in the negatives is good, it means that selling is decreasing and buying is increasing. Vice versa for a percent change in the positives.
It will accomodate up to 12 tickers, there are some pre-set but you can obviously customize it with your own tickers of interest.
And that's pretty much the indicator, pretty simple indicator but I hope you enjoy!
Safe trades everyone!

Ace VolumeThis is volume indicator that can help you identify either the volume is increasing or decreasing gradually.
The color based on the previous volume price.
The bigger the volume from the previous, it will show bull color (white) and vice versa bear color (blue).
The example of the indicator volume as shown above. Feel free to used it. Thank you!
Performante's Average Bitcoin Volume IndicatorThe volume of all major exchanges, including:
Bitfinex, Coinbase, Bitstamp, Bitmex, Kraken, Binance, Bithumb, Flyer, and OkEx

Zanger Volume Profile ZVR v1This is an attempt to make a zanger volume profile indicator, it needs improvement and some sort of forward looking volume estimator.
Last Price minus Open Price Intraday VolumeLast Price minus Open Price Intraday Volume
Change in price from day Open price to Last Price indicate the stock price movement. Last Price minus Open Price Intraday Volume indicator is framed on volume change during change in price from day Open price to Last Price. It takes into account the average intraday volume based on intraday length of bars and actual volume attributed to change in price from day Open Price to Last Price. The indicator reflects the change in trend .By analyzing the position of price on the basis of average change in volume during intraday with that of volume attributed to change in price from day open Price to Last price one may decide upon the course of trade.
DISCLAIMER: For educational and entertainment purposes only. Nothing in this content should be interpreted as financial advice or a recommendation to buy or sell any sort of security or investment including all types of crypto.
LazyScalp Volume in Currency AVGThis indicator displays the volume in the currency of the asset.
It also draws the average for a certain period and the average multiplied by the coefficient. If the volume is higher than the average multiplied by the coefficient, then the histogram bars and candlesticks on the chart are highlighted in color.
Also, the indicator sends alerts at such moments.
The indicator allows you to quickly see when the volume rises sharply. Often these are very interesting points for trading.
The indicator has many settings and display styles.

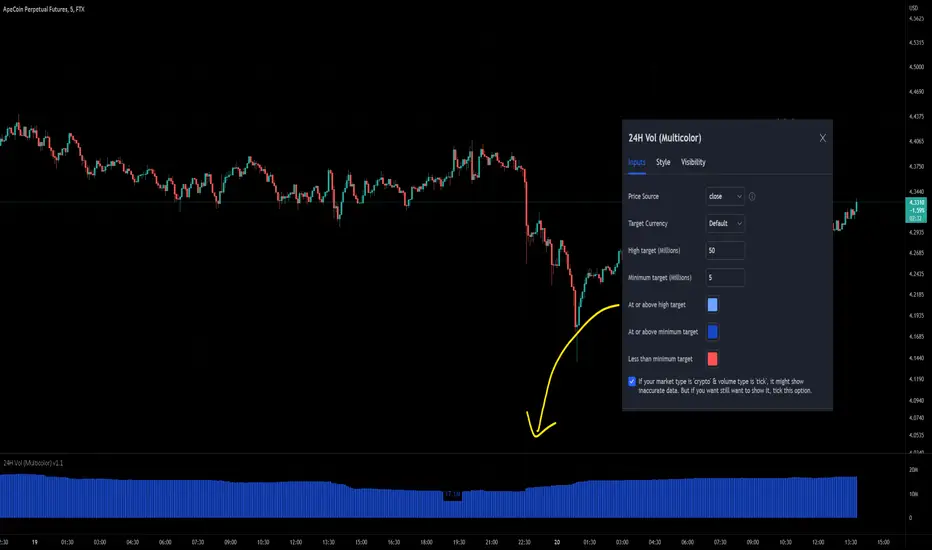
24-hour Volume (Multi-color with target size)This indicator has added the option to set different colors for a size target so you can set and instantly knows if the volume is above or below your target by seeing the different colors. Furthermore, I've added the option to opt-out of the error message that blocked the use of the 'crypto' market with the 'tick' type because maybe some users needed it, for example: BYBIT:APEUSDT is by default not available but personally I want to see it, so I can turn it on in this script.