Volatility ContractionVolatility Contraction is a strong trading setup for Positional Traders. It works on following time frame: Daily, Weekly and Monthly.
Wyszukaj w skryptach "Volatility"


VolatilityThis script shows three different calculations for volatility.
All three can be used as Stop-Loss...
- Absolute Price Changes
- Maximum Price Fluctuation
- and every one should know Average True Range
The script has a dark and light theme.
And the colors can be changed and each can be deactivated.
On top of that I stumbled over the fact that when MPF crosses over APC
this could result in a significant change in price and could also be used as an entry or exit.
This is also highlighted by default. You can change its background color and you can deactivate it too.
ACP measures volatility over most recent close prices.
This is excellent for comparing volatility.
It includes both frequency and magnitude.
In other words: Sum of differences between second to last close price and last close price as absolute value for 'n' bars.
MPF measures volatility over most recent candles, which could be used as an estimate of risk.
It may also be effective as the basis for a stop-loss or take-profit,
like the ATR but it ignores the frequency of directional changes within the time interval.
In other words: The difference between the highest high and lowest low over 'n' bars.
When you don't know what the ATR is then you can look at this link .

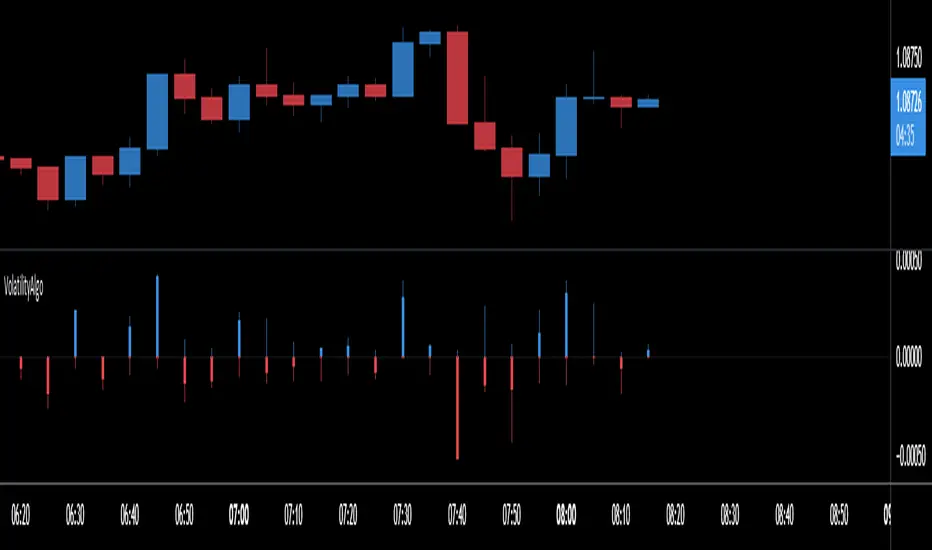
VolatilityAlgoThis indicator allows you to calculate the precise volatility in real time
> Allows analyzing the periods of high/low volatility
> Also to do a technical analysis on the volatility of each bar
> It works with all assets as well as all periods
Here are the different Values:
Upper Volatility Calculation
1 open to close
2 open to high
3 upper shadow
Lower Volatility Calculation
4 open to close
5 open to low
6 lower shadow
VolatilityFlex LevelsThe VolatilityFlex Levels indicator computes the degree of change (or sigma) by leveraging the selected Volatility Index (such as VIX or any user-specified volatility index). It utilizes this information to graphically represent distinct levels for a designated financial instrument. These levels include -sigma, -3/4sigma, -1/2sigma, -1/4sigma, 1/4sigma, 1/2sigma, 3/4sigma, and sigma.

Volatility StopThe Volatility Stop Indicator is able to define the current trend. When a downward trend is determined a red line above the prices bars is plotted; when an upward trend is determined a green line below the prices bars is plotted. These lines are generally used as trailing stops. The Volatility Stop Indicator is more used as an exit tool than an entry tool. When the price crosses the VStop value, the trend reverses and VStop moves to the other side of price.
We'd like to present you VStop indicator written in Pine Script. Please notice new Pine Script features used in this indicator: variables max_, min_, is_uptrend, vstop. We may refer to previous values of the indicator in the source code (e.g. vstop , is a vstop value on the previous bar) before the actual vstop variable definition. Enjoy and leave your comments!

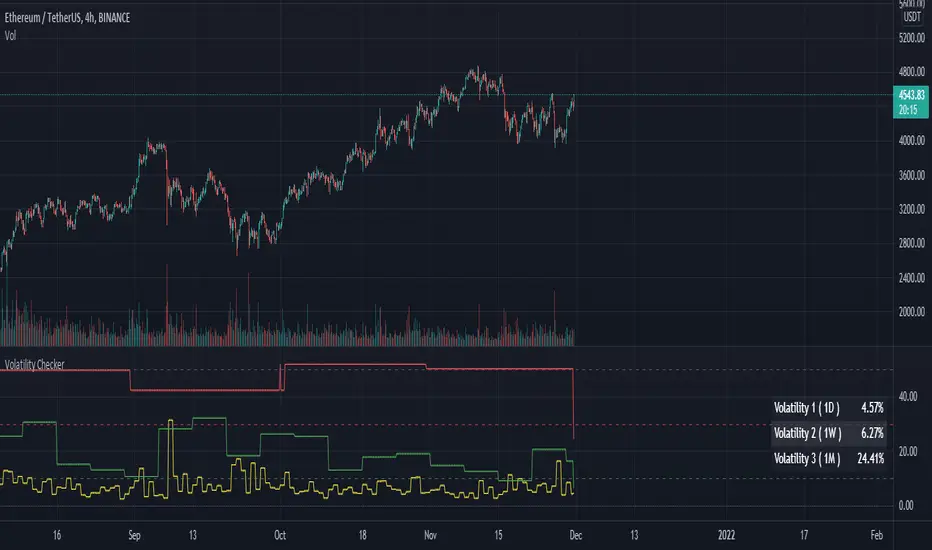
Volatility CheckerWhenever we want to find out volatility of the current chart, we need to visit screener and check the latest percentage. Because of this frustration by visiting screener page, I made this script. And there is no script like this, so it's open and free to use.
This script is detect current percentage of volatility as indicator way. Screener show default 1D volatility. But this script is not only show 1D volatility. You can change the resolution whatever you like. And you can switch more resolution style. But I think, 1D resolution is better. This script is best for crypto investors. I've no idea about stock/forex, so hmmmmm.
Hline helps you to detect the position of the volatility. I always like to check those symbol which is less than 30. Because it's best for scalping. Less than 10 is best for swing traders.
Feel free to use. Any feedback? welcome to comment zone :)
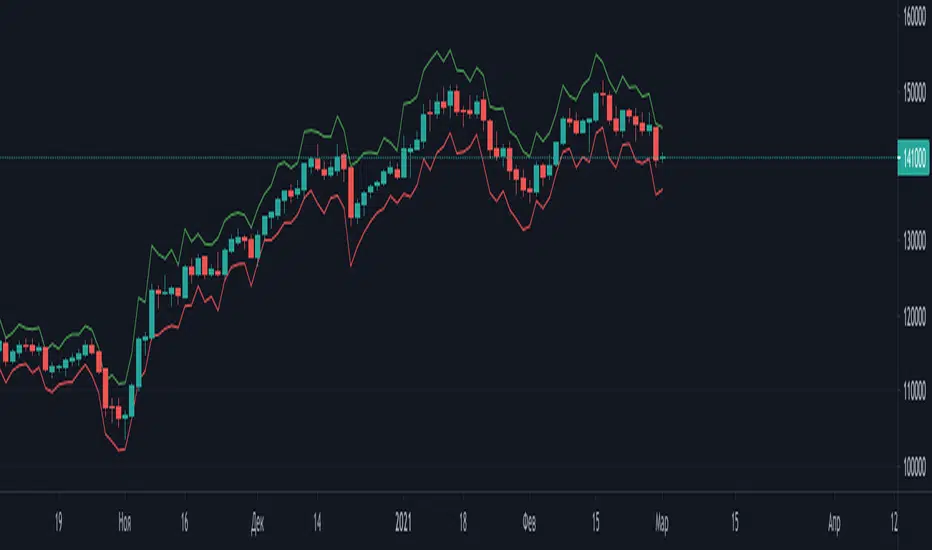
Volatility LevelУровень возможного отклонения цены для текущей волатильности инструмента.
Period - Временной диапазон в днях для расчета отклонений цены.
Sigma - Множитель сигма для расчета уровней.
The level of price deviation for the current instrument volatility.
Period - Time range in days for calculating price deviations.
Sigma - Sigma multiplier for calculating levels.
Volatility Rainbow [Nic]What is this
The volatility rainbow tracks divergences in a security and its volatility index. This can be used to identify periods of heightened implied (future) risk.
About Volatility
The volatility is calculated by looking at put / call ratios. When VIX goes up it means that puts are outpacing calls. This is a bearish signal.
About Correlation
When the security goes up while the VIX goes up, the divergence on the plot will increase and turn a color. This should be a warning.
Colors
RED - DIA
BLUE - SPX
GREEN - IWM
GOLD - GLD
YELLOW - QQQ
ORANGE - TLT
White- VVIX
Related

Volatility Percentage MonitorVolatility Percentage Monitor (VPM)
What it’s meant for:
- VPM quickly shows asset volatility trend in percentage making easy to recognise how on-going price move compare to average. This is particularly useful in day-trading analysis too understand when the move possibly reaches it’s top.
- By default VPM shows a 1 period trend and Bollinger Bands on 20 periods.
How it works:
- VPM use a Simple Moving Average to reflect the exact percentage value in both daily and optional trend average measures. There’s also a switch in ‘Setting Menu’ to change the average method (Eg. You can choose RMA with a 14 period average and see a standard ATR graph on chart)
Settings:
- Additional averages can show short, mid and longterm volatility trends and can be adjusted from Setting Menu.
- An additional graph can be shown to display Standard Deviation from longterm period data: (Note: this is used to understand how reliable average data is on the given asset)
- Bollinger Bands can be turned on/off by the Setting Menu and adjusted in period and standard deviation (Suggestion: you can check standard deviation with longterm period average parameter and display trend)
- Average Method switch allow to change the calculation method for all averages with the most common methods
- The indicator is designed to be used with daily, weekly or monthly timeframe, but will work on any timeframe anyway.
- Works on any asset
Alerts:
- Preconfigured alerts can be activated to be notify on mid and top volatility daily reach

Volatility Breakout Daily [Alert]Valid on Bitcoin Daily Chart .
yellow line : open
green line : upward Volatility Breakthrough
red line : downward Volatility Breakthrough
Long strategy: Buy on the green line and liquidate the next day. (recommendation)
Short strategy: Sell on the red line and clear the market the next day. (Not recommended)
You can change the volatility coefficient K.
Only open to invited trader.
Test it before auto trading.
If isOpen is true then VK = (previous high - previous low) * k + open
if isOpen is false then VK = (previous high - previous low) * k + previous close
Alert setting
- Long
Condition : BTCUSD / Crossing Up / VKD (A) / VK (Long)
Options : Once Per Bar
- Exit long
Condition : VKD (A) / longExitCondition
Options : Once Per Bar Close
- Short
Condition : BTCUSD / Crossing Down / VKD (A) / VK (Short)
Options : Once Per Bar
- Exit short
Condition : VKD (A) / shortExitCondition
Options : Once Per Bar Close
* * *
비트코인 일간 차트에서 유효한 지표입니다.
시가(노란선)를 기준으로 위와 아래에 상방 변동성 돌파선(녹색선)과 하방 변동성 돌파선(빨간선)이 표시됩니다.
매수 전략 : 녹색선에서 매수하여 다음날 시가 청산합니다. (추천)
매도 전략 : 빨간선에서 매도하여 다음날 시가 청산합니다. (추천안함)
변동성 계수 K를 바꿀 수 있습니다.
초대된 분들께만 공개합니다.
자동 매매시 반드시 테스트해보고 사용하세요.
isOpen 이 참이면 VK = (전일 고가 - 전일 저가) * K + 당일 시가
isOpen 이 거짓이면 VK = (전일 고가 - 전일 저가) * K + 전일 종가
얼러트 설정 방법
- 매수 진입
조건 : BTCUSD / 상향돌파 / VKD (A) / VK (Long)
옵션 : 봉마다 한번
-매수 청산
조건 : VKD (A) / longExitCondition
옵션 : 봉 닫힐때 한번
- 매도 진입
조건 : BTCUSD / 하향돌파 / VKD (A) / VK (Short)
옵션 : 봉마다 한번
-매도 청산
조건 : VKD (A) / shortExitCondition
옵션 : 봉 닫힐때 한번

Volatility Breakout [Alert]Valid on Bitcoin Daily Chart.
yellow line : open
green line : upward Volatility Breakthrough
red line : downward Volatility Breakthrough
Long strategy: Buy on the green line and liquidate the next day. (recommendation)
Short strategy: Sell on the red line and clear the market the next day. (Not recommended)
You can change the volatility coefficient K.
Only open to invited trader.
* * *
비트코인 일간 차트에서 유효한 지표입니다.
시가(노란선)를 기준으로 위와 아래에 상방 변동성 돌파선(녹색선)과 하방 변동성 돌파선(빨간선)이 표시됩니다.
매수 전략 : 녹색선에서 매수하여 다음날 시가 청산합니다. (추천)
매도 전략 : 빨간선에서 매도하여 다음날 시가 청산합니다. (추천안함)
변동성 계수 K를 바꿀 수 있습니다.
초대된 분들께만 공개합니다.

Volatility PercentileIn this script, we look at 3 volatility indicators percentile distribution
1. VIX
2. VIX/VIX3M
3. VVIX/VIX
Default value of percentile lookback is 1 month = 21 periods on the daily chart.
A general observation is when the percentile drags along the 0th/100th mark, is when we get the "trend" part of the volatility move, before a reversal. This is not a set-in-stone observation, and should not be used as a guidance for trade entries/exits.
Feel free to use, and comment if any observations.

Volatility Detector by AjeetThis indicator is used for detecting Volatility
To be applied only on 15 mins chart
As soon as you spot a circle (Inc. in Volatility) then high movement is
expected in further 5-6 candles
Movement can be up or down
Its can be best used for scalping...
Run a chart on 15 mins, detect a candle with an indication of high movement ahead
shift to smaller timeframe like 3 mins
apply lower setting supertrend like 11,2
and take benefit of the move

Volatility SwitchThis is originally a script built by LazyBear in version 2 and updated to version 4. Slowly trying to learn other concepts in Pine and sharing what I come up with just in case it adds any value to the community. This gives a good idea of low volatility in the market and is a good warning sign to pay attention for a larger move when volatility swings back the other way.

Volatility Indicator 波动率指标 According to the improved indicators based on volatility, parameters can be customized to adjust to personal preferences.
Volatility HeatmapThis indicator uses Mark Whistlers' Wave PM of various period lengths to show the overall volatility of the market. The dark red represents the most volatile a period can reach while the violet shows the least volatile. THIS INDICATOR DOES NOT IMPLY DIRECTION.

Volatility ConfluenceThis indicator uses many measures of volatility to display situations where price is likely to squeeze. Works in all markets (stock market, futures, cryptocurrency, etc.).

Volatility Range [by JQBS]Plotting the volatility over time. This is used to find reversal patterns in the BTC markets. Best used on higher timeframes 1D and higher. I haven't looked at it at lower TF but I reckon it's fairly useless.

Volatility LikelihoodCurrently in development, this script identifies if there is enough gas in the tank for a move. A cross above the yellow band means that volatility is likely to increase drastically.
Price is unlikely to move if you are below the yellow band.
Do note that it does not indicate direction but only tells you if a move is likely. This can be used in confluence with any other indicator to identify if the signal other indicators give you are actually likely to move price.
This can be used on any timeframe and is very useful to see if price is just wicking or actually going to be a move outside of a tight trading range. A very useful tool in an over leveraged market where price swings are drastic.
Thanks to Happy for helping code this script.

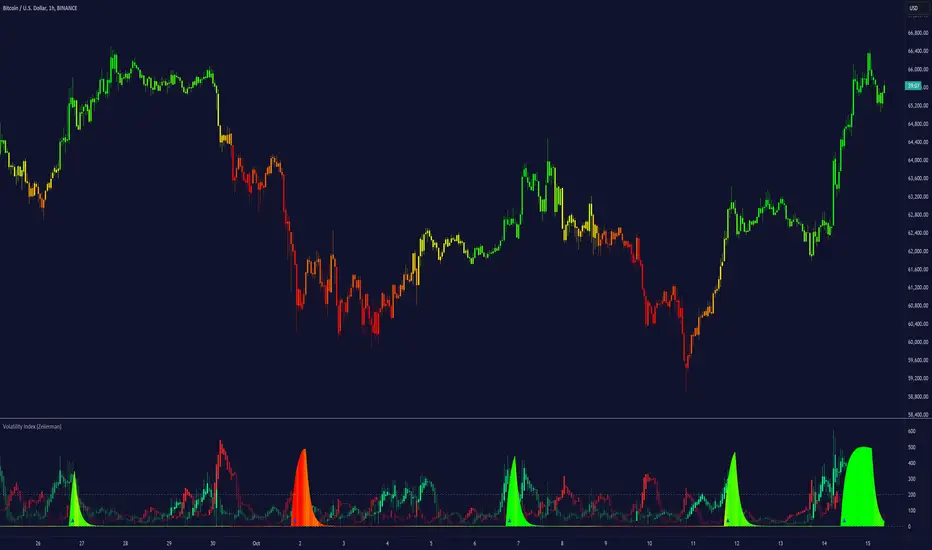
Volatility Index (Expo)Volatility Index (Expo)
DESCRIPTION
Volatility can be referred to many things, but a commonly accepted definition of volatility is that it’s a measure of the risk or uncertainty in the market. Higher volatility is equal to more risk in the market. A simple way of describing it is that when volatility is high, the value of the market can be spread out over a larger range of values. This means that the price of the market can change dramatically over a short time period in either direction. A lower volatility means that a market's value does not fluctuate dramatically, and tends to be steadier. However, how to calculate and to apply volatility has been widely debated and many different calculations have been used. Volatility Index is a must for a professional trader in today's volatile markets.
This Volatility Index is derived from research within Volatility.
HOW TO USE
1. Use the indicator to detect low- respectively high volatility.
2. Enter the market when the volatility is low, and exit the market when the volatility is high.
3. Use the indicator to identify when the volatility peaks. Can indicate that the market will shift or can be good areas to take profits.
Trend
When the market is in a positive trend, the volatility is low and stable. The opposite happens when the market is in a negative trend, the volatility is high and price moves boldly.
As a rule ,when volatility increases unusually(abnormal) in relation to previous periods something is happening in the market, then wait until the volatility peaks or when the indicator does not make any new highs (the indicator becomes flat), and in conjunction with that the trending price action doesn’t make any new lows or respectively highs. When this happens there is a high probability that the market will take a temporary turn.
Positive volatility refers to when the volatility index increases with green candlesticks this means that the buyers are more aggressive than sellers. (Can indicate a trend change)
Negative volatility refers to when the volatility index increases with red candlesticks this means that the sellers are more aggressive than buyers. (Can indicate a trend change)
INDICATOR IN ACTION
This indicator is best presented live, the graphs below gives a hint of how the Volatility Index works.
The indicator works on any market, security, currency, stock, etc. and on any timeframe.
BTCUSD
EURUSD
WALL STREET
I hope you find this indicator useful , and please comment or contact me if you like the script or have any questions/suggestions for future improvements. Thanks!
I will continue to work on this indicator, so please share your experience and feedback with me so that I can continuously improve it. Thanks to everyone that have contacted me regarding my scripts. Your feedback is valuable for future developments!
ACCESS THE INDICATOR
• Contact me on TradingView or use the links below
-----------------
Disclaimer
Copyright by Zeiierman.
The information contained in my scripts/indicators/ideas does not constitute financial advice or a solicitation to buy or sell any securities of any type. I will not accept liability for any loss or damage, including without limitation any loss of profit, which may arise directly or indirectly from use of or reliance on such information.
All investments involve risk, and the past performance of a security, industry, sector, market, financial product, trading strategy, or individual’s trading does not guarantee future results or returns. Investors are fully responsible for any investment decisions they make. Such decisions should be based solely on an evaluation of their financial circumstances, investment objectives, risk tolerance, and liquidity needs.
My scripts/indicators/ideas are only for educational purposes!
Volatility Risk Premium (VRP) 1.0ENGLISH
This indicator (V-R-P) calculates the (one month) Volatility Risk Premium for S&P500 and Nasdaq-100.
V-R-P is the premium hedgers pay for over Realized Volatility for S&P500 and Nasdaq-100 index options.
The premium stems from hedgers paying to insure their portfolios, and manifests itself in the differential between the price at which options are sold (Implied Volatility) and the volatility the S&P500 and Nasdaq-100 ultimately realize (Realized Volatility).
I am using 30-day Implied Volatility (IV) and 21-day Realized Volatility (HV) as the basis for my calculation, as one month of IV is based on 30 calendaristic days and one month of HV is based on 21 trading days.
At first, the indicator appears blank and a label instructs you to choose which index you want the V-R-P to plot on the chart. Use the indicator settings (the sprocket) to choose one of the indices (or both).
Together with the V-R-P line, the indicator will show its one year moving average within a range of +/- 15% (which you can change) for benchmarking purposes. We should consider this range the “normalized” V-R-P for the actual period.
The Zero Line is also marked on the indicator.
Interpretation
When V-R-P is within the “normalized” range, … well... volatility and uncertainty, as it’s seen by the option market, is “normal”. We have a “premium” of volatility which should be considered normal.
When V-R-P is above the “normalized” range, the volatility premium is high. This means that investors are willing to pay more for options because they see an increasing uncertainty in markets.
When V-R-P is below the “normalized” range but positive (above the Zero line), the premium investors are willing to pay for risk is low, meaning they see decreasing uncertainty and risks in the market, but not by much.
When V-R-P is negative (below the Zero line), we have COMPLACENCY. This means investors see upcoming risk as being lower than what happened in the market in the recent past (within the last 30 days).
CONCEPTS:
Volatility Risk Premium
The volatility risk premium (V-R-P) is the notion that implied volatility (IV) tends to be higher than realized volatility (HV) as market participants tend to overestimate the likelihood of a significant market crash.
This overestimation may account for an increase in demand for options as protection against an equity portfolio. Basically, this heightened perception of risk may lead to a higher willingness to pay for these options to hedge a portfolio.
In other words, investors are willing to pay a premium for options to have protection against significant market crashes even if statistically the probability of these crashes is lesser or even negligible.
Therefore, the tendency of implied volatility is to be higher than realized volatility, thus V-R-P being positive.
Realized/Historical Volatility
Historical Volatility (HV) is the statistical measure of the dispersion of returns for an index over a given period of time.
Historical volatility is a well-known concept in finance, but there is confusion in how exactly it is calculated. Different sources may use slightly different historical volatility formulas.
For calculating Historical Volatility I am using the most common approach: annualized standard deviation of logarithmic returns, based on daily closing prices.
Implied Volatility
Implied Volatility (IV) is the market's forecast of a likely movement in the price of the index and it is expressed annualized, using percentages and standard deviations over a specified time horizon (usually 30 days).
IV is used to price options contracts where high implied volatility results in options with higher premiums and vice versa. Also, options supply and demand and time value are major determining factors for calculating Implied Volatility.
Implied Volatility usually increases in bearish markets and decreases when the market is bullish.
For determining S&P500 and Nasdaq-100 implied volatility I used their volatility indices: VIX and VXN (30-day IV) provided by CBOE.
Warning
Please be aware that because CBOE doesn’t provide real-time data in Tradingview, my V-R-P calculation is also delayed, so you shouldn’t use it in the first 15 minutes after the opening.
This indicator is calibrated for a daily time frame.
ESPAŇOL
Este indicador (V-R-P) calcula la Prima de Riesgo de Volatilidad (de un mes) para S&P500 y Nasdaq-100.
V-R-P es la prima que pagan los hedgers sobre la Volatilidad Realizada para las opciones de los índices S&P500 y Nasdaq-100.
La prima proviene de los hedgers que pagan para asegurar sus carteras y se manifiesta en el diferencial entre el precio al que se venden las opciones (Volatilidad Implícita) y la volatilidad que finalmente se realiza en el S&P500 y el Nasdaq-100 (Volatilidad Realizada).
Estoy utilizando la Volatilidad Implícita (IV) de 30 días y la Volatilidad Realizada (HV) de 21 días como base para mi cálculo, ya que un mes de IV se basa en 30 días calendario y un mes de HV se basa en 21 días de negociación.
Al principio, el indicador aparece en blanco y una etiqueta le indica que elija qué índice desea que el V-R-P represente en el gráfico. Use la configuración del indicador (la rueda dentada) para elegir uno de los índices (o ambos).
Junto con la línea V-R-P, el indicador mostrará su promedio móvil de un año dentro de un rango de +/- 15% (que puede cambiar) con fines de evaluación comparativa. Deberíamos considerar este rango como el V-R-P "normalizado" para el período real.
La línea Cero también está marcada en el indicador.
Interpretación
Cuando el V-R-P está dentro del rango "normalizado",... bueno... la volatilidad y la incertidumbre, como las ve el mercado de opciones, es "normal". Tenemos una “prima” de volatilidad que debería considerarse normal.
Cuando V-R-P está por encima del rango "normalizado", la prima de volatilidad es alta. Esto significa que los inversores están dispuestos a pagar más por las opciones porque ven una creciente incertidumbre en los mercados.
Cuando el V-R-P está por debajo del rango "normalizado" pero es positivo (por encima de la línea Cero), la prima que los inversores están dispuestos a pagar por el riesgo es baja, lo que significa que ven una disminución, pero no pronunciada, de la incertidumbre y los riesgos en el mercado.
Cuando V-R-P es negativo (por debajo de la línea Cero), tenemos COMPLACENCIA. Esto significa que los inversores ven el riesgo próximo como menor que lo que sucedió en el mercado en el pasado reciente (en los últimos 30 días).
CONCEPTOS:
Prima de Riesgo de Volatilidad
La Prima de Riesgo de Volatilidad (V-R-P) es la noción de que la Volatilidad Implícita (IV) tiende a ser más alta que la Volatilidad Realizada (HV) ya que los participantes del mercado tienden a sobrestimar la probabilidad de una caída significativa del mercado.
Esta sobreestimación puede explicar un aumento en la demanda de opciones como protección contra una cartera de acciones. Básicamente, esta mayor percepción de riesgo puede conducir a una mayor disposición a pagar por estas opciones para cubrir una cartera.
En otras palabras, los inversores están dispuestos a pagar una prima por las opciones para tener protección contra caídas significativas del mercado, incluso si estadísticamente la probabilidad de estas caídas es menor o insignificante.
Por lo tanto, la tendencia de la Volatilidad Implícita es de ser mayor que la Volatilidad Realizada, por lo cual el V-R-P es positivo.
Volatilidad Realizada/Histórica
La Volatilidad Histórica (HV) es la medida estadística de la dispersión de los rendimientos de un índice durante un período de tiempo determinado.
La Volatilidad Histórica es un concepto bien conocido en finanzas, pero existe confusión sobre cómo se calcula exactamente. Varias fuentes pueden usar fórmulas de Volatilidad Histórica ligeramente diferentes.
Para calcular la Volatilidad Histórica, utilicé el enfoque más común: desviación estándar anualizada de rendimientos logarítmicos, basada en los precios de cierre diarios.
Volatilidad Implícita
La Volatilidad Implícita (IV) es la previsión del mercado de un posible movimiento en el precio del índice y se expresa anualizada, utilizando porcentajes y desviaciones estándar en un horizonte de tiempo específico (generalmente 30 días).
IV se utiliza para cotizar contratos de opciones donde la alta Volatilidad Implícita da como resultado opciones con primas más altas y viceversa. Además, la oferta y la demanda de opciones y el valor temporal son factores determinantes importantes para calcular la Volatilidad Implícita.
La Volatilidad Implícita generalmente aumenta en los mercados bajistas y disminuye cuando el mercado es alcista.
Para determinar la Volatilidad Implícita de S&P500 y Nasdaq-100 utilicé sus índices de volatilidad: VIX y VXN (30 días IV) proporcionados por CBOE.
Precaución
Tenga en cuenta que debido a que CBOE no proporciona datos en tiempo real en Tradingview, mi cálculo de V-R-P también se retrasa, y por este motivo no se recomienda usar en los primeros 15 minutos desde la apertura.
Este indicador está calibrado para un marco de tiempo diario.

Volatility Risk Premium GOLD & SILVER 1.0ENGLISH
This indicator (V-R-P) calculates the (one month) Volatility Risk Premium for GOLD and SILVER.
V-R-P is the premium hedgers pay for over Realized Volatility for GOLD and SILVER options.
The premium stems from hedgers paying to insure their portfolios, and manifests itself in the differential between the price at which options are sold (Implied Volatility) and the volatility GOLD and SILVER ultimately realize (Realized Volatility).
I am using 30-day Implied Volatility (IV) and 21-day Realized Volatility (HV) as the basis for my calculation, as one month of IV is based on 30 calendaristic days and one month of HV is based on 21 trading days.
At first, the indicator appears blank and a label instructs you to choose which index you want the V-R-P to plot on the chart. Use the indicator settings (the sprocket) to choose one of the precious metals (or both).
Together with the V-R-P line, the indicator will show its one year moving average within a range of +/- 15% (which you can change) for benchmarking purposes. We should consider this range the “normalized” V-R-P for the actual period.
The Zero Line is also marked on the indicator.
Interpretation
When V-R-P is within the “normalized” range, … well... volatility and uncertainty, as it’s seen by the option market, is “normal”. We have a “premium” of volatility which should be considered normal.
When V-R-P is above the “normalized” range, the volatility premium is high. This means that investors are willing to pay more for options because they see an increasing uncertainty in markets.
When V-R-P is below the “normalized” range but positive (above the Zero line), the premium investors are willing to pay for risk is low, meaning they see decreasing uncertainty and risks in the market, but not by much.
When V-R-P is negative (below the Zero line), we have COMPLACENCY. This means investors see upcoming risk as being lower than what happened in the market in the recent past (within the last 30 days).
CONCEPTS :
Volatility Risk Premium
The volatility risk premium (V-R-P) is the notion that implied volatility (IV) tends to be higher than realized volatility (HV) as market participants tend to overestimate the likelihood of a significant market crash.
This overestimation may account for an increase in demand for options as protection against an equity portfolio. Basically, this heightened perception of risk may lead to a higher willingness to pay for these options to hedge a portfolio.
In other words, investors are willing to pay a premium for options to have protection against significant market crashes even if statistically the probability of these crashes is lesser or even negligible.
Therefore, the tendency of implied volatility is to be higher than realized volatility, thus V-R-P being positive.
Realized/Historical Volatility
Historical Volatility (HV) is the statistical measure of the dispersion of returns for an index over a given period of time.
Historical volatility is a well-known concept in finance, but there is confusion in how exactly it is calculated. Different sources may use slightly different historical volatility formulas.
For calculating Historical Volatility I am using the most common approach: annualized standard deviation of logarithmic returns, based on daily closing prices.
Implied Volatility
Implied Volatility (IV) is the market's forecast of a likely movement in the price of the index and it is expressed annualized, using percentages and standard deviations over a specified time horizon (usually 30 days).
IV is used to price options contracts where high implied volatility results in options with higher premiums and vice versa. Also, options supply and demand and time value are major determining factors for calculating Implied Volatility.
Implied Volatility usually increases in bearish markets and decreases when the market is bullish.
For determining GOLD and SILVER implied volatility I used their volatility indices: GVZ and VXSLV (30-day IV) provided by CBOE.
Warning
Please be aware that because CBOE doesn’t provide real-time data in Tradingview, my V-R-P calculation is also delayed, so you shouldn’t use it in the first 15 minutes after the opening.
This indicator is calibrated for a daily time frame.
----------------------------------------------------------------------
ESPAŇOL
Este indicador (V-R-P) calcula la Prima de Riesgo de Volatilidad (de un mes) para GOLD y SILVER.
V-R-P es la prima que pagan los hedgers sobre la Volatilidad Realizada para las opciones de GOLD y SILVER.
La prima proviene de los hedgers que pagan para asegurar sus carteras y se manifiesta en el diferencial entre el precio al que se venden las opciones (Volatilidad Implícita) y la volatilidad que finalmente se realiza en el ORO y la PLATA (Volatilidad Realizada).
Estoy utilizando la Volatilidad Implícita (IV) de 30 días y la Volatilidad Realizada (HV) de 21 días como base para mi cálculo, ya que un mes de IV se basa en 30 días calendario y un mes de HV se basa en 21 días de negociación.
Al principio, el indicador aparece en blanco y una etiqueta le indica que elija qué índice desea que el V-R-P represente en el gráfico. Use la configuración del indicador (la rueda dentada) para elegir uno de los metales preciosos (o ambos).
Junto con la línea V-R-P, el indicador mostrará su promedio móvil de un año dentro de un rango de +/- 15% (que puede cambiar) con fines de evaluación comparativa. Deberíamos considerar este rango como el V-R-P "normalizado" para el período real.
La línea Cero también está marcada en el indicador.
Interpretación
Cuando el V-R-P está dentro del rango "normalizado",... bueno... la volatilidad y la incertidumbre, como las ve el mercado de opciones, es "normal". Tenemos una “prima” de volatilidad que debería considerarse normal.
Cuando V-R-P está por encima del rango "normalizado", la prima de volatilidad es alta. Esto significa que los inversores están dispuestos a pagar más por las opciones porque ven una creciente incertidumbre en los mercados.
Cuando el V-R-P está por debajo del rango "normalizado" pero es positivo (por encima de la línea Cero), la prima que los inversores están dispuestos a pagar por el riesgo es baja, lo que significa que ven una disminución, pero no pronunciada, de la incertidumbre y los riesgos en el mercado.
Cuando V-R-P es negativo (por debajo de la línea Cero), tenemos COMPLACENCIA. Esto significa que los inversores ven el riesgo próximo como menor que lo que sucedió en el mercado en el pasado reciente (en los últimos 30 días).
CONCEPTOS :
Prima de Riesgo de Volatilidad
La Prima de Riesgo de Volatilidad (V-R-P) es la noción de que la Volatilidad Implícita (IV) tiende a ser más alta que la Volatilidad Realizada (HV) ya que los participantes del mercado tienden a sobrestimar la probabilidad de una caída significativa del mercado.
Esta sobreestimación puede explicar un aumento en la demanda de opciones como protección contra una cartera de acciones. Básicamente, esta mayor percepción de riesgo puede conducir a una mayor disposición a pagar por estas opciones para cubrir una cartera.
En otras palabras, los inversores están dispuestos a pagar una prima por las opciones para tener protección contra caídas significativas del mercado, incluso si estadísticamente la probabilidad de estas caídas es menor o insignificante.
Por lo tanto, la tendencia de la Volatilidad Implícita es de ser mayor que la Volatilidad Realizada, por lo cual el V-R-P es positivo.
Volatilidad Realizada/Histórica
La Volatilidad Histórica (HV) es la medida estadística de la dispersión de los rendimientos de un índice durante un período de tiempo determinado.
La Volatilidad Histórica es un concepto bien conocido en finanzas, pero existe confusión sobre cómo se calcula exactamente. Varias fuentes pueden usar fórmulas de Volatilidad Histórica ligeramente diferentes.
Para calcular la Volatilidad Histórica, utilicé el enfoque más común: desviación estándar anualizada de rendimientos logarítmicos, basada en los precios de cierre diarios.
Volatilidad Implícita
La Volatilidad Implícita (IV) es la previsión del mercado de un posible movimiento en el precio del índice y se expresa anualizada, utilizando porcentajes y desviaciones estándar en un horizonte de tiempo específico (generalmente 30 días).
IV se utiliza para cotizar contratos de opciones donde la alta Volatilidad Implícita da como resultado opciones con primas más altas y viceversa. Además, la oferta y la demanda de opciones y el valor temporal son factores determinantes importantes para calcular la Volatilidad Implícita.
La Volatilidad Implícita generalmente aumenta en los mercados bajistas y disminuye cuando el mercado es alcista.
Para determinar la Volatilidad Implícita de GOLD y SILVER utilicé sus índices de volatilidad: GVZ y VXSLV (30 días IV) proporcionados por CBOE.
Precaución
Tenga en cuenta que debido a que CBOE no proporciona datos en tiempo real en Tradingview, mi cálculo de V-R-P también se retrasa, y por este motivo no se recomienda usar en los primeros 15 minutos desde la apertura.
Este indicador está calibrado para un marco de tiempo diario.
