[HM] HORIZONTAL GRID ROUNDED (VOLATILITY BASED)The purpose of this indicator is to draw a horizontal grid having in mind:
- rounded price levels instead tradingview standard grid, zoom-based;
- calculated by volatility, using daily ATR;
- independent of timeframe in use, locked to DAILY calculations.
Further improvements are intended.
Wish this could be useful. Any questions, feel free to comment.
Wyszukaj w skryptach "Volatility"
Bollinger Band - Keltner Squeeze - Failed Volatility BreakoutThis simple script provides Bollinger Band and Keltner Channel indicators, and will highlight areas where the Bollinger Bands enter into the Keltner Channel.
This script is based on the Failed Volatility Breakout (FVBO) System used by professional trader ChrisD_Macro. The default plot styles for the indicators in this script are based on Chris's setup, but visual styles as well as BB and Kelt settings (length, standard deviation, etc...) can all be easily customized with the user interface in the indicator settings.
You can also choose whether you want the condition to be triggered by just one Bollinger Band entering the Keltner Channel, or if it has to be both bands entering the channel.
This script is very useful when manually back testing the FVBO strategy, as it clearly highlights the BB-Kelt squeezes instead of having to constantly scroll in and out looking for them.
It can also be useful live as it has the ability to trigger TradingView alerts using the condition "BB-Kelt Squeeze".
Hope it's helpful
- JDC
Side Notes:
With Forex / Currencies this indicator I usually use this indicator on the 1 Day time frame.
Keep in mind that the script includes the Bollinger Bands and Keltner Channels, so if you already have your own version of these indicators on your chart, it will get really messy. (Just hide the other indicators while you get to know this one).

Historical Volatility STDThis aims to help provide an equity to volatility ratio for trading bitcoin options.


Volatility Index Oscillator LargeCap [aamonkey]There are two versions of this indicator (Large and Small Cap).
Both work exactly the same the only difference are the default coins selected.
What does this indicator do?
- can be used on any timeframe
- plots the percentage change of the candles of the selected timeframe of 9 LargeCap coins (Default: ETH, EOS, TRX, IOTA, XLM, ADA, ATOM, Tezos, BTC)
- +1 line for the chart you are currently on (Default: red line)
Why use this indicator:
- compare selected coins to the LargeCap coins in terms of volatility
- see correlations in price movements
- see which coin outperforms the others
- find coins that are behind
Settings:
- pairs, exchanges, and colors changeable
- always write the pairs and exchanges in caps!

Volatility Index Oscillator SmallCap [aamonkey]There are two versions of this indicator (Large and Small Cap).
Both work exactly the same the only difference are the default coins selected (and this version compares only 9 coins in total instead of 10).
What does this indicator do?
- can be used on any timeframe
- plots the percentage change of the candles of the selected timeframe of 8 SmallCap coins (Default: REN, LOOM, MANA, ENJ , KNC, ZRX, BNT, REP)
- +1 line for the chart you are currently on (Default: red line)
Why use this indicator:
- compare selected coins to the SmallCap coins in terms of volatility
- see correlations in price movements
- see which coin outperforms the others
- find coins that are behind
Settings:
- pairs, exchanges, and colors changeable
- always write the pairs and exchanges in caps!
Futures - Measure and compare volatility in USDThis is a dirty fix.
Dollar value (syminfo.pointvalue) is wrong in Tradingview for the below listed futures, where the price is in quarters of cents.
For example ZC (Corn) says syminfo.pointvalue = 5000 (syminfo.mintick = 0.13), which gives you (with ATR = 6) volatility of $30,000 (6 * 5000) instead of the correct $300.
For all other futures I used the default syminfo.pointvalue.
Feel free to correct me, if I am wrong regarding the syminfo.pointvalue error.
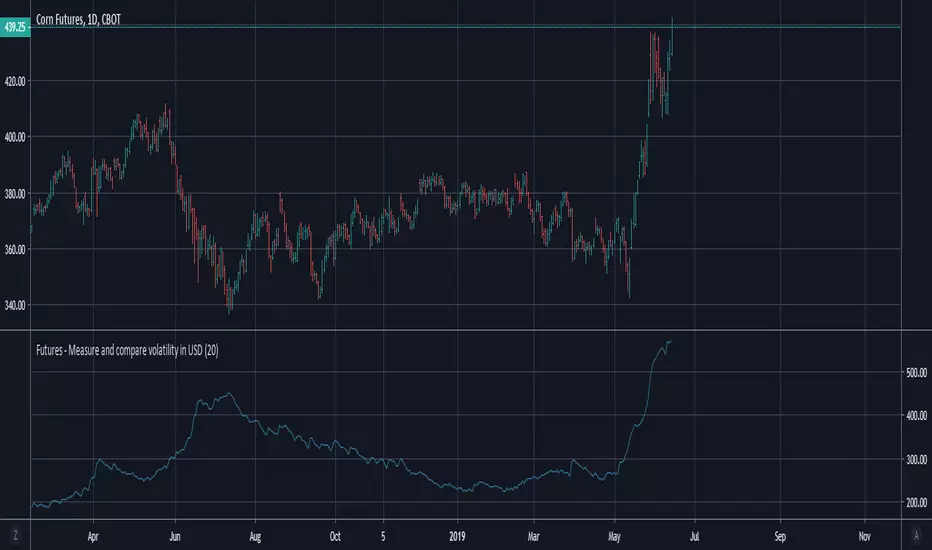
Futures - Measure and compare volatility in USDDollar value (syminfo.pointvalue) is wrong in Tradingview for the below listed futures, where the price is in quarters of cents. So this is a dirty fix.
For example ZC (Corn) says syminfo.pointvalue = 5000 (syminfo.mintick = 0.13), which gives you (ATR = 6) volatility 30,000 USD instead of the correct 300 USD.
For all other futures is used the default syminfo.pointvalue.

Historical Volatility RankSame formulation of IVR but based on Historical Volatility instead.
Serves the same purpose as IV rank.

Volatility after Momentum/SMA crossChanged default value of average true range, to make changes in volatility more distinct.

XBT Volatility Weighted Bottom Finder. [For Daily Charts]An update to:
Made it into and indicator.
v. 0.0.1
DESIGNED FOR DAILY CHARTS

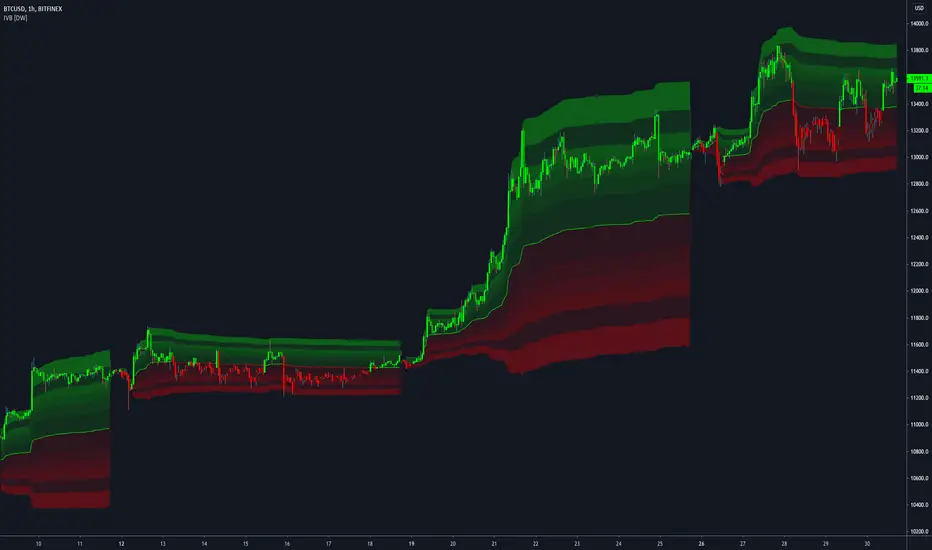
Interval Volatility Bands [DW]This is an experimental study that utilizes Volume Weighted Average Price or Time Weighted Average Price calculations, Bollinger Bands, and Fibonacci numbers to estimate volatility over a specified interval.
First, the basis is calculated by selecting:
-VWAP, which has the option to be calculated using real volume or tick volume
-TWAP, which has the option to be calculated using the standard method or exponential method
Next, standard deviation from the basis is calculated and multiplied by a specified expansion coefficient. The result is then added to and subtracted from the basis to calculate the high and low bands.
There are three band calculation methods to chosse from in this script:
-Standard, which uses the default calculations
-Average, which takes a cumulative average of standard deviation
-Hybrid, which takes the maximum of the standard and average standard deviation methods
Lastly, the high and low band ranges are multiplied by Fibonacci Percentages 23.6 - 78.6.
A custom color scheme with eight default presets to choose from is included.
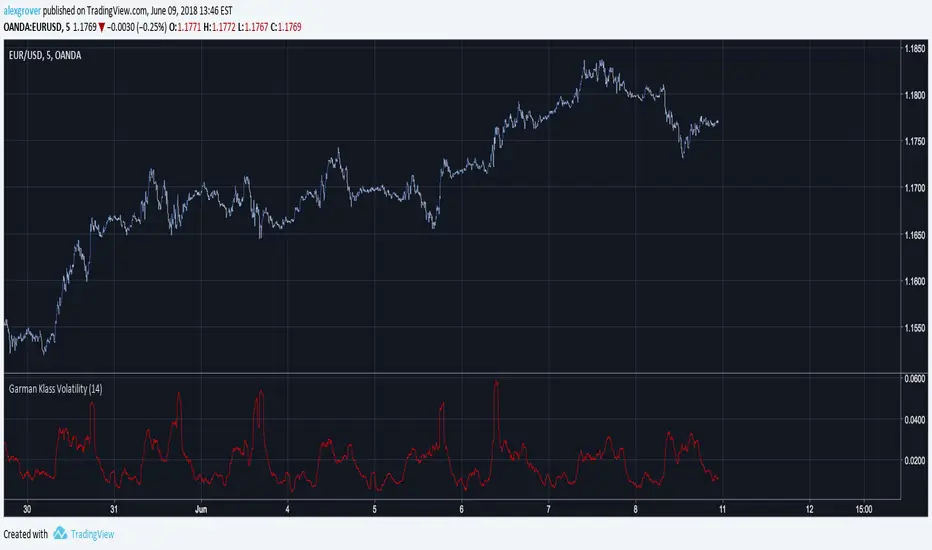
Garman Klass VolatilityThe Garman and Klass estimator for estimating historical volatility assumes Brownian motion with zero drift and no opening jumps (i.e. the opening = close of the previous period). This estimator is 7.4 times more efficient than the close-to-close estimator.
Dhananjay Volatility stop strategy v1.0
Sharing one more strategy after getting good feedback on my earlier published strategy.
This is simple volatility stop strategy where in we are using VStop as entry and exit point.
Again smart traders can add MA to decide the trend and can avoid trading in opposite direction of trend which will help them to minimize loss making trades.
There are more than 1 parameters which traders can use/change to make this strategy compatible to their instrument.
To understand what is VStop use google.com :-)
Looking forward to receiving feedback from all of you.

Periodic Volatility Channels [DW]This is an experimental study in which a geometric moving average is taken of price, then the range is multiplied by average annualized volatility based on the current trading timeframe and specified lookback, and by Fibonacci numbers 1 through 21.

Compression Bar - alphatradingdotin Volatility trading is the term used to describe trading the volatility of the price of an underlying instrument rather than the price itself. Volatility trading is simply buying and selling the expected future volatility of the instrument. There are many ways or rather innumerable ways to measure volatility one of the easiest is - a range of the price bars.
Volatility is often thought of as measuring risk or uncertainty. We are never sure where an asset is going to be at some point in the future, but a more volatile asset or underlying will have a wider spread of likely ending values, compared to a less volatile asset for the same time period.

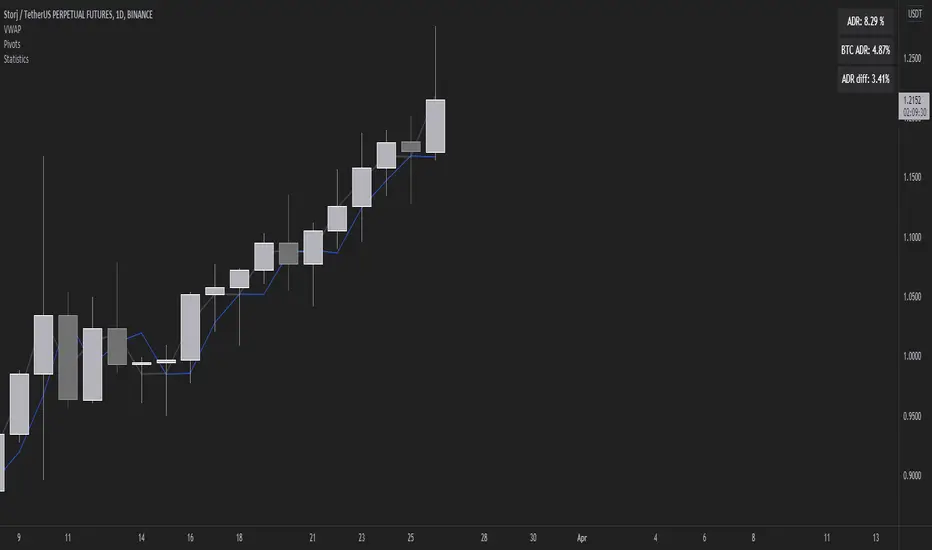
Volatility Stats compared to BTCMeasuring ADR we can find the difference between the daily range of BTC and the daily range of altcoins in order to find something more volatile (in percentage terms) to trade.