Extended Volume With Historical & Realtime Intrabar ProfileExtended Volume With Historical & Realtime Intrabar Profile
This indicator displays some additional information on the normal volume bars. Apart from the normal co-relation between price action, it is possible to configure an intrabar timeframe.
Intrabar volume analysis
On historical bars, this will calculate the last intrabar timeframe minutes volumes. The intrabar timeframe is user input. On a realtime bar, it will calculate the "rolling/forward" minutes cumulative volume . Which means from the time the script is loaded, it will on subsequent volume ticks, calculate the cumulative volume till then. The realtime cumulative volume will roll-over once the intrabar timeframe minutes is reached. For example, if the script was set to an intrabar timeframe of 30 minutes and loaded on the chart at 2:00 PM, then the realtime bar, will start adding up the volume on each volume tick. At 2:30 PM, this cumulative volume will be reset to zero, again start the same process for 30 minutes till 3:00 PM. It must be noted that fetching lower timeframe data from higher timeframe is not supported/guaranteed in pine script, yet. So the data is approximate and can be erroneous at times. Physical checking maybe required on lower timeframes to confirm the actions.
Price Action and Volume
Each volume bar is coloured on the basis of resulting price action and relative to volume bars prior to this day. This is very helpful in spotting "unusual" volumes.
Color Codes
A normal day volume on an up day, (today close > previous close) is displayed in Blue.
A normal day volume on a down day, is displayed in Fuchsia.
An up day with up volume day with today's volume higher than daily average volume is displayed in Teal.
A down volume day but with high close with lower average volume maybe a sign of weak hands, displayed in Orange.
An up day with volume above the weekly average is displayed in Lime.
Special Info
When enabled, a 52W High volume bar is noted by the sign "1Yr H".
When enabled (for historical bars), if the last intrabar cumulative volume is greater than 1.5 times the 5 day's average intrabar volume , "HD:XX" is displayed on top of the volume bar. The ratio of the day's volume to last 5 day's is displayed. For many markets, a higher value is indicative of delivery based trades near the end of the trading sessions when intraday volumes reside.
Nudge
A modification of the "Volume Buzz", this is a percentage change of the current rolling volume to the daily average of the intrabar volumes for realtime bar. For historical bars, it is the percentage change of the day volume to the daily average volume . The realtime "Nudge" is displayed in the
RT Box
The RT Box, displays the following information:
Elapsed Time - Time elapsed since realtime monitoring, will reset to 0 after intrabar timeframe is elapsed
Vol : Cumulative volume till recent tick since start of monitoring
Chng% : Change in price between the current time and the price at start of the monitoring
Nudge : The volume Nudge value, as explained above
Input controls
Intrabar volumes
Session Closing Volumes, when enabled activates realtime monitoring
Lookback minutes , in steps of 15 minutes, define the intrabar timeframe. Max 210 minutes. Minimum 15 minutes.
Show Only Intrabar Volumes , display on the intrabar timeframe volumes on historical bars, turn off normal day volumes
RT Box , when enabled displays realtime stats about rolling volumes on realtime bar
Volume Averages
Daily Avg Lookback , enable and set the lookback for daily volume average - disabled when "Only Last bars Info" is selected
Weekly Avg Lookback , enable and set the lookback for weekly volume average
Intrabars Avg Lookback , enable and set the lookback for intrabar volume average - enabled only when "Only Last bars Info" is selected
Debug & Info
Display Debug info on each volume bar, set by offset. 0 will show on last bar, 1 on the second last and sop on.
Enhanced Info : When enabled displays "1 Yr H" and "HD" data as explained above
Known Issue
The intrabar volume average does not get displayed on the last historical bar during market-off hours.
Wyszukaj w skryptach "VOLUME BAR"

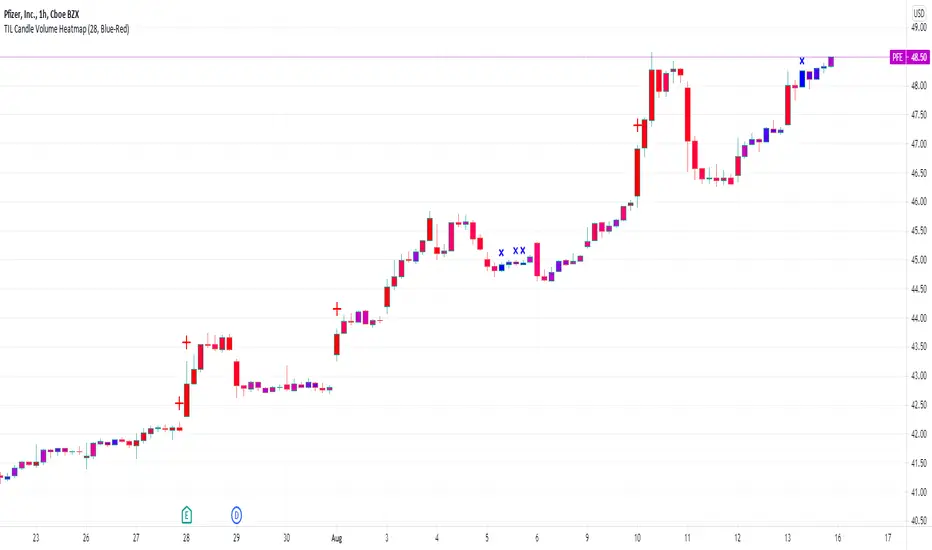
TIL Candle Volume HeatmapTrading Indicator Lab’s Candle Volume Heatmap for TradingView merges volume with price by applying gradient colors in the bars. It can also detect bars that have the most volume and the least volume.
Gradient Coloring
When applied to a chart, the Candle Volume Heatmap indicator applies colors to each bar which may vary according to its number of volume. The chart becomes a heatmap where you can easily spot which parts of the chart that are “hottest” or the bars that had the greatest number of volume and the “coldest” or ones that had the least volume. The indicator uses colors that transitions from BLUE to RED where shades closer to blue are “cold” (low volume) and those that are more in the shade of red are considered “hot” (high volume).
- Blue candlesticks – has low volume
- Red candlesticks – has high volume
High and Low Volume Bars
In addition to bar color changes, the Candle Volume Heatmap indicator also marks bars that have the lowest and highest volume within a certain length. Low and high-volume bars are marked as follows.
- – Low volume bars are marked with a small cross above them signifying a very low volume. Please note that this symbol always appears in new bars which are only starting to accumulate volume.
- – High volume bars are marked with a large plus sign above them signifying a very high volume. These bars along with other red-colored bars are the ones that should be monitored most.
Uses
Identifying low and high-volume bars can be useful in determining whether there is weight or “force” behind the price action that occurs in each bar. High volume bars can be used to validate candlestick reversal patterns and confirm breakouts in support and resistance levels.
Available Alert Conditions
- High Volume – triggers when a high-volume bar (marked with a plus sign) is detected
- Low Volume – triggers when a low-volume bar (marked with a cross sign) is detected
Inputs
- Length – sets the number of bars the indicator analyzes at each execution.
- Color Gradient – sets the color set for applying the heatmap on the chart candlesticks. Choices available are Blue-Red (good for light mode) and Yellow-Red (good for dark mode). Red color always signifies the highest concentration of volume.
- Apply Heatmap Colors – applies the color gradient on the chart candlesticks to indicate the amount of volume in each one
- Display Markers Below – moves the position of the high volume (plus) and low volume (cross) markers below the candlestick
efficiency of bulls and bears for VSA(Google translation from Russian.)
This indicator shows the effectiveness of selling or buying.
It is calculated as follows: using percentrank, the volume and the value of the spread are estimated (momentum = 1)
the resulting estimate of the volume value is divided by the estimate of the spread (momentum = 1) and thus we obtain the value. The larger it is, the more efficient and easier the price movement was.
If the indicator value is small, then this means that the movement was ineffective, because the volume (money) was invested. but no result.
The color of the volume bars is assigned as follows:
Buyers:
If the volume is large - Blue - green
If middle, then blue
Small - light blue
Sellers:
If the volume is large - Burgundy color
If middle, then purple
Small volume - light purple
Indicator parameters:
Comparison period - the period at which the volumes and spread are compared with each other - by default it is 50, selected as the most universal period suitable for different timeframes. But for daytime ones. Weekly and monthly timeframes may need to be shortened. This is true after significant spikes in volume that are exceptional over the long term.
Period spread - Bars from close to close - or in other words, it is momentum - defaults to 1
sensitivity of increased volumes - according to the percentrank indicator - the limit above which the volume will be considered large, the same as in the Volume on bar VSA - indicator V2 - for clarity, I recommend looking at it.
The default is 85, which means. that if the current value of the volume is greater than 85% of the remaining values in this period, then such a value of the volume will be considered high.
medium volume sensitivity - the same sensitivity of increased volumes but for medium volumes.
multiplier of increased volumes - this is an empirical factor to emphasize the importance of increased volumes - default = 20
multiplier of average volumes - the same. As above, but for medium volumes - the default is 10
reduced volume multiplier - Default is 1.
Knowledge of VSA is required to read this indicator
This indicator is recommended for use with indicators:
Volume on bar VSA - indicator V2
BAR for VSA
Russian language
Этот индикатор показывает эффективность продаж или покупок.
Рассчитывается следующим образом: с помощью percentrank оценивается величина объема и велечина спреда (momentum = 1)
полученная оценка велечины объема делится на оценку спреда (momentum = 1) и таким образом получаем значение. Чем оно больше, тем движение цены было эффективнее и легче.
Если значение индикатора маленькое, то это означает, что движение было неэффективным, поскольку объем (деньги) вложили. а результата нет.
Цвет барам объемов присваиваются следующим образом:
У покупателей:
Если объем большой - Сине – зелёный цвет
Если средний – то голубой
Маленький – свело-голубой
У продавцов:
Если объем большой - Бордовый цвет
Если средний – то пурпурный
Маленький объем – светло-пурпурный
Параметры индикатора:
Comparison period (период для сравнения) – период на котором между собой сравниваются объемы и спред – по умолчанию равно 50 , выбрано как наиболее универсальный период подходящий для различных таймфреймов. Но для дневных. Недельных и месячных таймфреймов может потребоваться уменьшить период. Это актуально после значительных всплесков объемов, которые являются исключительными на длительном периоде.
Period spread - Bars from close to close (Период спреда - Баров от закрытия до закрытия) – или другими словами это momentum – по умолчанию равно 1
sensitivity of increased volumes (чувствительность повышенных объемов) – согласно индикатору percentrank – граница выше которой объем будет считаться большим, то же самое, что в индикаторе Volume on bar VSA - indicator V2 – для наглядности как это работает рекомендую посмотреть его.
По умолчанию задано 85 – это означает. что если текущее значение объема больше, чем 85% остальных значений на этом периоде, то такое значение объема будет считаться высоким.
medium volume sensitivity (чувствительность средних объемов) – то же самое sensitivity of increased volumes но для средних объемов.
multiplier of increased volumes (множитель (вес) повышенных объемов) – это эмперический коэффициент для придания особой важности повышенным объемам- по умолчанию = 20
multiplier of average volumes (множитель (вес) средних объемов) – то же самое. Что и выше, но для средних объемов – по умолчанию равно 10
reduced volume multiplier (множитель (вес) пониженных объемов) – по умолчанию равно 1.
Для чтения данного индикатора необходимо знание VSA
Этот индикатор рекомендуется использовать с индикаторами:
Volume on bar VSA - indicator V2
BAR for VSA
Smart Money Flow TrackerSmart Money Flow Tracker - Liquidity & Fair Value Gap Indicator
Overview
The Smart Money Flow Tracker is a comprehensive Pine Script indicator designed to identify and analyze institutional trading patterns through liquidity prints and Fair Value Gaps (FVGs). This advanced tool combines multiple analytical approaches to help traders understand where smart money is operating in the market, providing crucial insights for better trade timing and market structure analysis.
Core Functionality
1. Liquidity Prints Detection
The indicator identifies liquidity prints by analyzing pivot highs and lows that represent potential areas where institutional orders may be resting. Key features include:
Pivot-Based Analysis: Uses configurable pivot lengths (default 5) to identify significant highs and lows
Volume Confirmation: Optional volume filter ensures liquidity prints occur during periods of significant trading activity
Dynamic Labeling: Visual markers on chart showing liquidity print locations with customizable colors
Success Rate Tracking: Monitors how often liquidity prints lead to meaningful price reactions
2. Fair Value Gap (FVG) Analysis with Volume Integration
Advanced FVG detection that goes beyond basic gap identification:
Three-Bar Pattern Recognition: Identifies gaps where the high of bar 1 is below the low of bar 3 (bullish) or low of bar 1 is above high of bar 3 (bearish)
Volume-Enhanced Detection: Incorporates comprehensive volume analysis including:
Average volume calculation over configurable periods
Total volume across the 3-bar FVG pattern
Dominant volume bar identification
Volume ratio calculations for strength assessment
Volume Threshold Filtering: Optional minimum volume requirements to filter out low-conviction FVGs
Visual Enhancement: FVG boxes with volume-based coloring and detailed volume labels
3. Comprehensive Statistics Dashboard
Real-time statistics table displaying:
Total liquidity prints detected
Success rate percentage with dynamic color coding
Volume filter status
Total Fair Value Gaps identified
High-volume FVG count and percentage
All metrics update in real-time as new data becomes available
4. Advanced Alert System
Multiple alert conditions for different scenarios:
Standard liquidity print detection
Volume-confirmed liquidity prints
Bullish and bearish FVG formation
High-volume FVG alerts for institutional-grade setups
Key Input Parameters
Display Controls
Show Liquidity Prints: Toggle main functionality on/off
Show Statistics Table: Control visibility of the analytics dashboard
Show Fair Value Gaps: Enable/disable FVG detection and display
Technical Settings
Pivot Length: Adjusts sensitivity of liquidity print detection (1-20 range)
Volume Confirmation: Requires above-average volume for liquidity print validation
Volume Lookback: Period for calculating average volume (5-50 bars)
FVG Volume Settings
Show FVG Volume Info: Display detailed volume metrics on FVG labels
FVG Volume Threshold: Minimum volume multiplier for high-volume FVG classification
FVG Volume Average Period: Lookback period for FVG volume calculations
Visual Customization
Bullish/Bearish Colors: Separate color schemes for different market directions
Text Colors: Bright lime green for optimal visibility on all background types
Table Positioning: Flexible placement options for the statistics dashboard
Trading Applications & Use Cases
1. Institutional Order Flow Analysis
Liquidity Hunting: Identify areas where institutions may be targeting retail stops
Smart Money Tracking: Follow institutional footprints through volume-confirmed liquidity prints
Market Structure Understanding: Recognize key levels where large orders are likely resting
2. Fair Value Gap Trading Strategies
Gap Fill Trading: Trade the statistical tendency of FVGs to get filled
Volume-Confirmed Entries: Use high-volume FVGs as higher-probability trade setups
Institutional FVG Recognition: Focus on FVGs with dominant volume bars indicating institutional participation
3. Multi-Timeframe Analysis
Higher Timeframe Context: Use on daily/weekly charts to identify major institutional levels
Intraday Precision: Apply to lower timeframes for precise entry and exit timing
Cross-Timeframe Confirmation: Combine signals across multiple timeframes for enhanced accuracy
4. Risk Management Applications
Stop Loss Placement: Use liquidity print levels as logical stop loss areas
Position Sizing: Adjust position sizes based on volume confirmation and success rates
Trade Filtering: Use statistics dashboard to assess current market conditions
Technical Logic & Methodology
Liquidity Print Algorithm
Pivot Identification: Scans for pivot highs/lows using the specified lookback period
Volume Validation: Optionally confirms prints occur during above-average volume periods
Success Tracking: Monitors subsequent price action to calculate effectiveness rates
Dynamic Updates: Continuously updates statistics as new data becomes available
FVG Detection Process
Pattern Recognition: Identifies 3-bar patterns with qualifying gaps
Volume Analysis: Calculates comprehensive volume metrics across the pattern
Strength Assessment: Determines volume ratios and dominant bars
Classification: Categorizes FVGs based on volume thresholds and characteristics
Visual Representation: Creates boxes and labels with volume-based styling
Statistical Framework
Real-time Calculations: All metrics update with each new bar
Percentage-based Metrics: Success rates and volume confirmations shown as percentages
Color-coded Feedback: Visual indicators for quick assessment of current conditions
Historical Tracking: Maintains running totals throughout the session
Best Practices for Usage
1. Parameter Optimization
Start with default settings and adjust based on market conditions
Lower pivot lengths for more sensitive detection on volatile instruments
Higher volume thresholds for cleaner signals in high-volume markets
2. Market Context Consideration
Combine with broader market structure analysis
Consider economic events and news that may affect institutional flow
Adjust expectations based on market volatility and liquidity conditions
3. Integration with Other Analysis
Use alongside support/resistance levels for confluence
Combine with momentum indicators for timing confirmation
Integrate with volume profile analysis for additional context
Conclusion
The Smart Money Flow Tracker represents a sophisticated approach to institutional flow analysis, combining traditional liquidity concepts with modern volume analytics. By providing both visual signals and comprehensive statistics, it enables traders to make more informed decisions based on where smart money is likely operating in the market. The indicator's flexibility and customization options make it suitable for various trading styles and timeframes, from scalping to position trading.

ds-Volume with Flags & Alerts v1.2ds-Volume with Flags & Alerts: User & Training Guide
1. Summary of Features
This indicator is a powerful, all-in-one tool designed to give you a deep and customizable view of market volume. By analyzing volume in multiple ways, it helps you spot unusual activity, confirm trends, and identify potential reversals.
How It Helps a Trader:
Spotting Institutional Activity: The core purpose of the Volume Flags (using either the Multiplier or Standard Deviation method) is to highlight bars with exceptionally high volume. These spikes often signal the entry or exit of large institutional players. A high-volume up-bar can confirm bullish conviction, while a high-volume down-bar can signal significant selling pressure.
Identifying Climactic Events: The HVE (Highest Volume Ever) and HV1 (Highest Volume - 1 Year) labels automatically pinpoint the most significant volume events on the chart. A "blow-off top" at the end of a long uptrend or a "capitulation" event at a market bottom is almost always accompanied by an HVE or HV1 bar. These are critical moments to watch for potential trend reversals.
Gauging Buying vs. Selling Pressure: The Up/Down Volume Ratio gives you a more nuanced view than volume alone. A ratio consistently above 1.2 suggests that buyers are more aggressive, while a ratio below 0.8 suggests sellers are in control. Watching this ratio can help you confirm the strength of a trend or spot divergences where price is rising but the ratio is falling (a potential warning sign).
Visual Confirmation & Customization: With options to color both the volume bars and the main price bars, you can get instant visual confirmation of these events without having to look away from the price action. The ability to toggle features on and off keeps your chart clean and focused on what matters most to you.
Actionable Alerts: The comprehensive alert system ensures you don't miss a key event. You can be notified of everything from a new all-time high volume bar to a subtle shift in the Up/Down Volume Ratio, allowing you to react to market changes in real-time.
2. User-Changeable Options
This indicator is highly customizable. Here is a breakdown of every setting available in the "Inputs" tab.
General Settings
MA Length: The lookback period for the simple moving average (the gray area plot) of the volume.
Volume Flags
Color Price Bars with Flags: If checked, the main price bars on your chart will be colored when a high or low volume flag condition is met.
Color Volume Bars with Flags: If checked, the volume bars in the indicator pane will be colored for flag conditions.
Flag Calculation Method: This is a crucial setting.
Multiplier (Default): Identifies high volume based on a simple multiple of the average volume (e.g., volume is 1.4x its average). It's simple and intuitive.
Standard Deviation: Identifies high volume based on how statistically unusual it is compared to its recent behavior. This method is more adaptive to changing market volatility.
Daily/Weekly Lookback (Multiplier): Sets the lookback period for calculating the average volume when using the "Multiplier" method.
Daily/Weekly High-Vol Multiplier: Sets the multiplier for a high volume event (e.g., 1.4).
STDEV Length (Daily/Weekly): Sets the lookback period for calculating the average and standard deviation when using the "Standard Deviation" method.
STDEV Threshold (Daily/Weekly): Sets the number of standard deviations above the average required to trigger a high volume flag (e.g., 2.0).
Daily/Weekly Low-Vol Multiplier: Sets the threshold for a low volume event (e.g., 0.5 means volume is less than 50% of its average). This is always based on the multiplier method.
Ratios & Stats
Up/Down Ratio Daily/Weekly Lookback: Sets the lookback period for calculating the sum of up volume and down volume for the ratio.
Ratio Calculation Method:
Close vs. Open: Defines an "up volume" bar as one where the close is higher than the open.
Close vs. Previous Close (Default): Defines an "up volume" bar as one where the close is higher than the previous bar's close. This is a common standard.
Up Ratio Arrow Threshold: If the U/D Ratio exceeds this value, a green "up" arrow will appear.
Show Up Ratio Arrow: Toggles the visibility of the green "up" arrow.
Down Ratio Arrow Threshold: If the U/D Ratio falls below this value, a red "down" arrow will appear.
Show Down Ratio Arrow: Toggles the visibility of the red "down" arrow.

WhispererRealtimeVolumeLibrary "WhispererRealtimeVolume"
▮ Overview
The Whisperer Realtime Volume Library is a lightweight and reusable Pine Script® library designed for real-time volume analysis.
It calculates up, down, and neutral volumes dynamically, making it an essential tool for traders who want to gain deeper insights into market activity.
This library is a simplified and modular version of the original "Realtime Volume Bars w Market Buy/Sell/Neutral split & Mkt Delta" indicator by the_MarketWhisperer , tailored for integration into custom scripts.
How bars are classified
- Up Bars
If the current bar’s closing price is higher than the previous bar’s closing price, it is classified as an up bar.
Volume handling:
The increase in volume for this bar is added to the up volume.
This represents buying pressure.
- Down Bars
If the current bar’s closing price is lower than the previous bar’s closing price, it is classified as a down bar.
Volume handling:
The increase in volume for this bar is added to the down volume.
This represents selling pressure.
- Neutral Bars
If the current bar’s closing price is the same as the previous bar’s closing price, it is classified as a neutral bar.
Volume handling:
If neutral volume is enabled, the volume is added to the neutral volume.
If neutral volume is not enabled, the volume is assigned to the same direction as the previous bar (up or down). If the previous direction is unknown, it is added to the neutral volume.
▮ What to look for
Real-Time Volume Calculation : Analyze up, down, and neutral volumes in real-time based on price movements and bar volume.
Customizable Start Line : Add a visual reference line to your chart for better context by viewing the starting point of real-time bars.
Ease of Integration : Designed as a library for seamless use in other Pine Script® indicators or strategies.
▮ How to use
Example code:
//@version=6
indicator("Volume Realtime from Whisperer")
import andre_007/WhispererRealtimeVolume/4 as MW
MW.displayStartLine(startLineColor = color.gray, startLineWidth = 1, startLineStyle = line.style_dashed,
displayStartLine = true, y1=volume, y2=volume + 10)
= MW.mw_upDownVolumeRealtime(true)
plot(volume, style=plot.style_columns, color=color.gray)
plot(volumeUp, style=plot.style_columns, color=color.green)
plot(volumeDown, style=plot.style_columns, color=color.red)
plot(volumeNeutral, style=plot.style_columns, color=color.purple)
▮ Credits
This library is inspired by the original work of the_MarketWhisperer , whose "Realtime Volume Bars" indicator served as the foundation.
Link to original indicator :

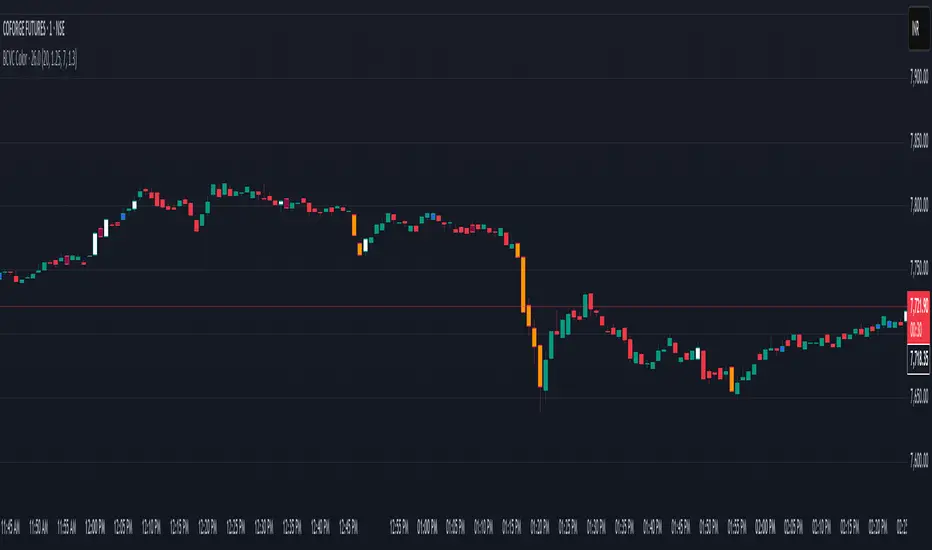
BCVC - Volume & Big Candle ColorThe BCVC (Volume & Big Candle Color) indicator helps traders identify significant price movements accompanied by unusual volume activity. By dynamically coloring bars based on volume spikes and candle size, it highlights potential momentum shifts, breakouts, or reversals. This tool is ideal for traders who want to:
Spot institutional buying/selling activity.
Confirm trend strength using volume and price volatility.
Filter noise by focusing on high-impact bars.
Key Features
Volume Spike Detection:
Compares current volume to a moving average (EMA) of volume.
Highlights bars where volume exceeds the average by a user-defined multiplier.
Big Candle Detection:
Identifies bars with a range (high-low) larger than the historical average range (EMA of candle ranges).
Thresholds for "big candles" are customizable.
Color-Coded Logic:
White Bars: High volume + Big candle + Bullish (close > open).
Orange Bars: High volume + Big candle + Bearish (close < open).
Blue Bars: High volume + Regular candle + Bullish.
Maroon Bars: High volume + Regular candle + Bearish.
Input Parameters
Volume Settings:
Volume Period: EMA length for average volume calculation (default: 20).
Volume Multiplier: Threshold multiplier for volume spikes (e.g., 1.25 = 25% above average).
Candle Size Settings:
Lookback Period: EMA length for average candle range (default: 7).
Big Candle Multiplier: Threshold multiplier for large candles (e.g., 1.3 = 30% above average range).
How It Works
Volume Analysis:
The indicator calculates an EMA of volume over the specified period.
If the current bar’s volume exceeds Average Volume × Volume Multiplier, it’s flagged as a high-volume bar.
Candle Range Analysis:
The average candle range (high-low) is calculated using an EMA over the lookback period.
A "big candle" is identified when the current bar’s range exceeds Average Range × Big Candle Multiplier.
Combined Signals:
High-volume bars are colored based on whether they are bullish/bearish and whether their range exceeds the big-candle threshold.
Example: A white bar (high volume + big candle + bullish) suggests strong buying pressure with institutional participation.
Usage Scenarios
Breakout Confirmation: A white/orange bar at a support/resistance level may validate a breakout.
Reversal Signals: A maroon/orange bar after a long trend could indicate exhaustion and potential reversal.
Trend Strength: Clusters of blue/white bars during uptrends (or maroon/orange in downtrends) confirm momentum.
Benefits
Visual Clarity: Instantly spot high-impact bars without manually scanning volume or candle size.
Customizable Sensitivity: Adjust multipliers to filter noise (e.g., increase for fewer signals).
Universal Application: Works on all timeframes and instruments (stocks, forex, crypto).
Notes
Best Paired With: Trendlines, support/resistance levels, or momentum oscillators (e.g., RSI).
Avoid False Signals: Use higher multipliers (e.g., 1.5) on lower timeframes to reduce noise.
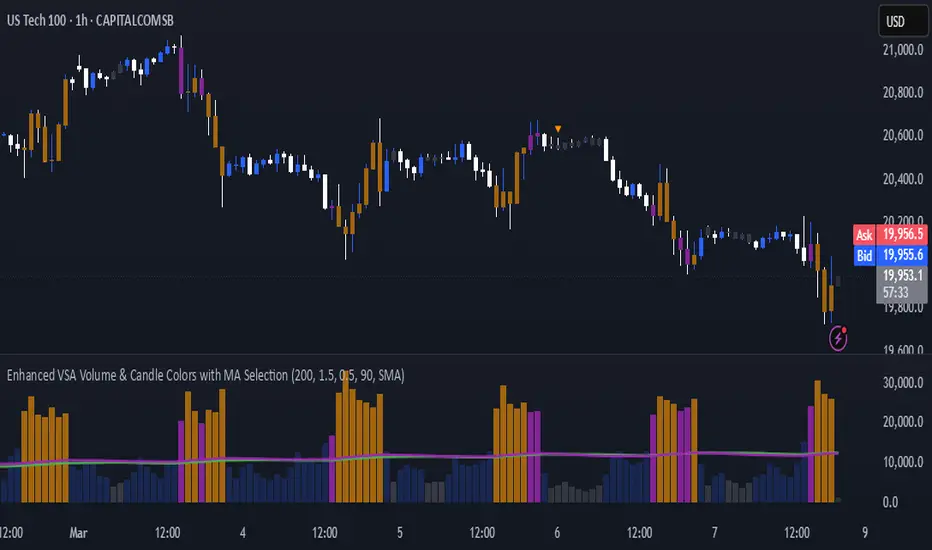
Enhanced VSA Volume & Candle Colors with MA SelectionOverview:
This script aims to enhance the visualization of volume spikes and price action by coloring volume bars and price candles dynamically based on the volume behavior. It allows traders to customize the type of volume moving average (SMA, EMA, or VWMA) used and apply various color schemes to highlight high, low, and extreme volume conditions. Additionally, alerts are generated when extreme or low-volume conditions occur.
---------------------------------------------------------------------------------------------------------------------
Key Features:
Customizable Volume Lookback Period:
The script allows users to define the period for calculating the moving average of volume (default: 200).
Volume Multiplier Settings:
High and low volume thresholds are defined using multipliers. Users can adjust these to customize how volume is categorized (default multipliers: 1.5 for high volume, 0.5 for low volume).
Percentile-Based Extreme Volume Detection:
The script calculates a percentile threshold for extreme volume (default: 90th percentile) based on the volume data, highlighting exceptionally high volume spikes.
Moving Average Selection:
Users can choose between Simple Moving Average (SMA), Exponential Moving Average (EMA), or Volume Weighted Moving Average (VWMA) to track volume trends over the selected lookback period.
Volume-Based Price Bar Coloring:
Price bars can be colored according to the volume conditions (high, low, or extreme). This feature can be toggled on or off.
Dynamic Transparency and Color Customization:
The script allows users to set custom colors for different volume conditions (high, low, neutral, extreme) and adjusts the transparency of volume bars based on the relative size of the volume.
Alerts:
Alerts can be set for when extreme volume spikes or low volume conditions are detected.
---------------------------------------------------------------------------------------------------------------------
Script Components:
Volume Histogram Plot:
Displays the volume bars with dynamic coloring based on the volume condition (high, low, or extreme). The color of the bars adjusts for clarity, with transparency based on volume levels.
Moving Average Plot:
Plots the selected volume moving average (SMA, EMA, or VWMA) to visualize the trend of volume over the chosen lookback period.
Smoothed Average Volume (EMA of Volume):
A smoothed EMA line is plotted to provide a clear representation of volume trends over time.
Price Bar Coloring:
If enabled, price bars are colored according to the current volume condition, providing immediate visual feedback to the trader.
---------------------------------------------------------------------------------------------------------------------
How It Can Be Used:
Volume Analysis for Entry/Exit Points: Traders can use the volume conditions (high, low, and extreme) to identify potential entry or exit points. High-volume bars often signal strong market activity, while low-volume bars may indicate consolidation or indecision.
Volume Confirmation for Trend Reversal: Extreme volume spikes can sometimes precede significant price movements. Traders can monitor these spikes for potential trend reversal signals.
Customizing Alerts: Alerts based on volume conditions help traders stay updated on important volume events without constantly monitoring the chart.
Color-Coded Price Action: The dynamic coloring of price bars makes it easier to identify periods of strong or weak market participation, allowing traders to make informed decisions quickly.
---------------------------------------------------------------------------------------------------------------------
Compliance with TradingView's House Rules:
No Promotion of Financial Products: The script does not promote any specific financial instruments or products, ensuring compliance with TradingView’s content guidelines.
Clear Functionality: The script provides clear, functional analysis tools without making unsupported claims about predicting market movements.
No Automated Trading: The script does not include any automated trading or order execution features, which complies with TradingView’s policy on non-automated scripts.
This breakdown ensures clarity on the script’s purpose, features, and how it might be used by traders. It's written in a way that fits TradingView's content guidelines, keeping the focus on providing valuable analytical tools rather than making promises or promoting any financial product.
Adaptive On Balance Volume with Trend█ Introduction
The Adaptive On Balance Volume (AOBV) indicator enhances the traditional On Balance Volume (OBV) by introducing adaptability, volatility detection, and trend analysis. It helps traders identify the direction of volume flow, assess volume momentum, and spot potential reversals in the market.
Detecting market tops and bottoms is crucial for making informed trading decisions. The AOBV indicator offers a method for identifying these points by using an adaptive volatility detection function that highlights potential volume peaks or climaxes, suggesting when a price top or bottom may be forming.
█ Understanding the AOBV
Note: Details on how calculations are conducted can be found at the end of this script description.
1. The Basics of the AOBV Function:
• Adaptive Momentum Calculation: Instead of using a fixed momentum formula, the AOBV uses the original formula for basic momentum and enhances it based on relative strength and applies an adaptive smoothing function.
• Dynamic Smoothing:
• Strong Momentum: When the AOBV detects significant changes (strong momentum), it reduces smoothing. This makes the indicator more responsive to major market movements.
• Weak Momentum: When momentum is weak (small changes), it increases smoothing to filter out market noise.
This adaptability allows the AOBV to more accurately reflect volume momentum, responding promptly during significant market moves and remaining stable during quieter periods.
To determine the trend direction (bullish or bearish), the indicator calculates a signal curve and displays the difference as bars:
• Bar Above the Middle Line: Indicates a bullish trend.
• Bar Below the Middle Line: Indicates a bearish trend.
2. Volatility Function:
The volatility function measures how much the AOBV deviates from its average by comparing it to its smoothed version. It calculates the exponential standard deviation to estimate volatility.
• Purpose: Identifies when volume momentum is near a climax or when a trend is nearing exhaustion.
• How It Works:
• Compares current volatility to previous bars.
• Computes a percentage indicating how often the current volatility is higher than past values.
• If this percentage exceeds a defined threshold, it signals a significant volatility event by plotting a dot above or below the bar.
This pattern typically manifests itself during strong runs on price followed by a period of consolidation. Thus, estimating volatility would be an acceptable measure of when a market is reaching or nearing an implied top or bottom.
3. The Trend Function:
The trend function combines several common indicators to gauge buildup toward a reversal or a continuation of a trend when the AOBV changes direction.
• Components:
• AOBV Strength Percentage: Calculates the percentage change in the AOBV to gauge its strength and direction.
• Supertrend Indicator: Acts as the main driver for trend buildup.
• Vertical Horizontal Filter (VHF): Measures market consolidation, adjusting the trend strength accordingly.
• Adaptive RSI: Further refines the trend strength based on volume momentum.
• Trend Ranking:
• Assigns a trend rank to the AOBV that reflects both market direction and momentum.
• Colors are used to represent different trend strengths: Strong Bullish, Bullish, Strong Bearish, and Bearish.
█ How to Use the AOBV
• Above the Middle Line: Suggests a bullish trend.
• Below the Middle Line: Suggests a bearish trend
• The Volatility dots:
• Indicate strong momentum relative to previous bars.
• Signal that the trend may be nearing a climax or exhaustion.
• Can imply a potential market top or bottom.
• Consolidation can be detected by visually comparing current bars to previous ones. This should be obvious since, and as described, the AOBV bars represent volume momentum.
• The trend function is used to gauge the likelihood of a reversal or a continuation of a trend; trend is represented with several colors: strong bullish trend, bullish trend, strong bearish trend, and finally simply a bearish trend.
It is important to understand that this trend function is not the typical trend function found on other technical indicators. It must be viewed within the context of the AOBV momentum. For example, if AOBV is exerting a bullish trend (bars above middle line), then a bearish trend with no major change in momentum and no volatility indication could mean a false reversal. Conversely, a large charge in AOBV could be a strong indication of a market reversal.
█ Key Features
• Two Display Modes: Curve and Bars:
The Adaptive OBV can be viewed in two different display modes: Curve and Bars Mode. "Curve Mode" offers the classic OBV representation (but as AOBV) with trend, while "Bars Mode" incorporates volatility detection and trend, making it the recommended mode.
• Volatility Function:
• Dots appear above or below the volume bars when significant volatility events are detected.
• The sensitivity can be adjusted by changing the percentage threshold.
• Trend Analysis:
• Helps gauge the likelihood of a trend continuation or reversal.
• Uses color-coded trend ranks for easy interpretation.
• Flexible Lookback Period:
Lookback periods for the main AOBV, its signal line, trend function, and volatility function can be customized.
• Recommendations:
• Match the main lookback period with the volatility period: Ensures consistency in momentum and volatility measurements.
• Match the trend lookback period with the signal AOBV lookback period: Aligns trend analysis with the underlying momentum signals.
Below is a sample demonstrating the utility on a 1- minute chart.
█ Calculation Details:
• AOBV Calculations
The AOBV differs the traditional OBV by focusing on the differences in OBV values rather than absolute price movements. Initially, it calculates the standard OBV by accumulating volume based on whether the closing price is higher or lower than the previous close. Next, it computes the difference between the current OBV and the previous OBV to measure changes in volume momentum. It calculates the average net change and average total change of these OBV differences over a specified period using a selected averaging method (e.g., EMA, SMA). By dividing the average net change by the average total change, it obtains a change ratio that reflects the strength and direction of volume momentum.
This change ratio is then scaled to an RSI-like value between 0 and 100, which is used to derive an adaptive smoothing factor (alpha). The alpha adjusts dynamically—when the change ratio indicates strong momentum, alpha increases, making the indicator more responsive to recent changes; when momentum is weak, alpha decreases, increasing smoothing to filter out noise.
The adaptive OBV is calculated by applying this alpha to combine the current OBV and the previous adaptive OBV value. This adaptive smoothing allows the indicator to adjust its sensitivity based on market conditions, becoming more responsive during strong momentum and more stable during weak momentum.
A smoothed OBV signal line is also computed using weighted moving averages for comparison. By analyzing the difference between the adaptive OBV and this smoothed signal line, the indicator identifies bullish or bearish trends. Positive differences suggest bullish momentum (bars above the middle line), while negative differences indicate bearish momentum (bars below the middle line).
• Volatility Calculations
The volatility function in the AOBV indicator identifies significant changes in volume momentum by estimating the variability of recent momentum shifts. It begins by calculating the difference between the AOBV and its smoothed signal line, capturing the current change in volume momentum. To assess volatility, the function employs exponential smoothing to compute adaptive averages of both the volume and the squared volume over a specified lookback period. By combining these averages, it estimates the current standard deviation of the volume momentum changes, effectively measuring how much the momentum deviates from its average level.
This estimated volatility is then compared to historical volatility values over the lookback period to determine how frequently the current volatility exceeds past levels. If the proportion of times the current volatility is higher than previous values and it surpasses a user-defined threshold, it signals a significant volatility event, indicating a potential volume climax
• Trend Calculations
As outlined earlier in description, the trend function is composed of several components:
The Supertrend indicator calculates dynamic support and resistance levels based on price movements and volatility using the Average True Range. It assesses whether the closing price is above or below these levels to determine the primary trend direction. If the price is above the Supertrend line: The market is considered to be in an uptrend. If the price is below the Supertrend line: The market is considered to be in a downtrend.
The Vertical Horizontal Filter measures the strength of the trend by comparing the price range over a period to the sum of absolute price changes. It does this by comparing the difference between the highest and lowest prices over a given period (the "vertical" movement) to the sum of the absolute differences between consecutive prices (the "horizontal" movement). A higher VHF value indicates a stronger, more directional trend, while a lower value suggests that the market is moving sideways without a clear trend.. If the VHF detects consolidation, it downgrades the trend strength indicated by the Supertrend. This prevents the trend function from overemphasizing the Supertrend's signals when the market lacks clear direction.
The Adaptive RSI Analyzes recent changes in the AOBV to identify whether volume momentum is strengthening or weakening (based on the volume percent change) correlating price movement with volume momentum. It only upgrades or downgrades on a bar by bar basis if price movement is correlating with percent change. This acts as a corrective measure against the VHF since quiet periods (consolidation) can occur between strong moves. The alpha generated from the adaptive function is the same as the one generated with the AOBV calculations.
█ Disclaimer
This script is provided for educational and informational purposes only and should not be considered financial advice. Trading financial instruments carries a high level of risk and may not be suitable for all investors. Before using this script, please consult with a qualified financial advisor to ensure it aligns with your individual circumstances. The author does not guarantee the accuracy or completeness of the script and is not responsible for any losses or damages that may occur from its use. Use this script at your own risk.

Dix$on's Weighted Volume FlowDixson's Weighted Volume Flow
Dixson's Weighted Volume Flow is a technical indicator designed to analyze and visualize the distribution of buy and sell volume within a given timeframe. It dynamically calculates the proportional allocation of volume based on price action within each bar, providing insights into market sentiment and activity. This indicator displays horizontal volume bars in a separate pane and annotates them with precise volume values.
How It Works
1. Volume Allocation:
- The indicator calculates buy and sell volume using the following formulas:
- Buy Volume = (Close - Low) / (High - Low) Total Volume
- Sell Volume = (High - Close) / (High - Low) Total Volume
- These formulas allocate volume proportionally based on the bar's price range, attributing more volume to buying or selling depending on the relationship between the close, high, and low prices.
2. Dynamic Scaling:
- The buy and sell volumes are scaled relative to their combined total for the period.
- The resulting values determine the length of the horizontal bars, providing a comparative view of buy and sell activity.
3. Bar Visualization:
- Buy Volume Bars: Displayed as green horizontal bars.
- Sell Volume Bars: Displayed as red horizontal bars.
- The lengths of the bars represent the dominance of buy or sell volume, scaled dynamically within the pane.
4. Labels:
- Each bar is annotated with a label showing its calculated buy or sell volume value.
5. Timeframe Adjustment:
- The indicator uses the request.security() function to fetch data from the selected timeframe, allowing users to customize their analysis for intraday, daily, or longer-term trends.
6. Customization Options:
- Enable or disable the indicator using a toggle.
- Adjust colors for the buy/sell bars and text labels to suit your chart theme.
How to Use It
1. Enable the Indicator:
- Activate the indicator using the "Enable/Disable" toggle in the settings.
2. Select a Timeframe:
- Choose the timeframe for analysis (e.g., 1-minute, 1-hour, daily). The indicator fetches volume data specific to the selected timeframe.
3. Interpret the Visualization:
- Compare Bar Lengths:
- Longer buy volume bars (green) indicate stronger buying activity.
- Longer sell volume bars (red) suggest dominant selling pressure.
- Labels:
- Use the labels to view the exact buy and sell volume values for precise analysis.
4. Combine with Other Tools:
- Use the indicator alongside price action analysis, support/resistance levels, or trend indicators to confirm market sentiment and detect potential reversals.
5. Monitor Imbalances:
- Significant disparities between buy and sell volume can signal shifts in market sentiment, such as the end of a trend or the start of a breakout.
Practical Applications
- Trend Confirmation:
- Align the dominance of buy or sell volume with price trends to confirm market direction.
- Reversal Signals:
- Watch for volume imbalances or a sudden shift in the dominance of buy or sell volume to identify potential reversals.
- High-Activity Zones:
- Identify areas with increased volume to anticipate significant price movements or key support/resistance interactions.
Dixson's Weighted Volume Flow provides a clear and systematic way to analyze market activity by visualizing the dynamics of buy and sell volume. It is particularly useful for traders looking to enhance their understanding of volume-based sentiment and its impact on price movements.

Bullish/Bearish Volume Indicator ABDJO1- red bars are bearish volume
2- yellow bars are a weakness of bearish volume.
3-green bars are a strong bullish volume.
4-Orange bars are a weakness of bullish volume.
1. Price Movements
The chart does not explicitly show price movements, but the volume bars can give us indirect clues. Typically, a transition from green (strong bullish volume) to red (bearish volume) suggests a potential reversal from an uptrend to a downtrend. The presence of orange bars (weakness of bullish volume) following green bars indicates a decrease in buying momentum, which often precedes a price decline.
2. Trading Volume
Green Bars: Represent strong bullish volume, indicating strong buying interest.
Orange Bars: Indicate a weakening of bullish volume, suggesting that buyers are losing strength or interest at higher price levels.
Yellow Bars: Represent a weakening of bearish volume, which could indicate that selling pressure is decreasing and a potential reversal or stabilization in price might occur.
Red Bars: Signify strong bearish volume, indicating strong selling pressure.
3. Price-Volume Relationship
The transition from green to orange and then to red bars shows a typical pattern where initial strong buying interest (green) is followed by a decrease in buyer enthusiasm (orange), and eventually overtaken by sellers (red). This pattern often corresponds to a peak in prices followed by a reversal to the downside.
4. Technical Indicators
Without specific price data, traditional indicators like MA (Moving Averages), MACD (Moving Average Convergence Divergence), or KDJ (Stochastic Oscillator) cannot be calculated directly. However, the volume pattern itself can be used as a rudimentary momentum indicator, with decreasing bullish volume (orange) and increasing bearish volume (red) suggesting a bearish momentum.
5. Support and Resistance Levels
Support Level: Could be hypothesized near the transition point from yellow to green bars, where buyers previously started to overpower sellers.
Resistance Level: Likely near the transition from green to orange bars, where sellers begin to regain control and buying momentum fades.
6. Overall Trend Patterns
The overall trend, inferred from the volume bars, suggests a bullish phase losing momentum and transitioning into a bearish phase. This is typical of a market top where buying interest wanes and sellers begin to dominate.
7. Future Projections and Recommendations
Given the observed shift from bullish to bearish volume, there is a higher likelihood of a downward price movement in the near term. Investors should consider this a potential sell signal, especially as bearish volume (red bars) increases. Caution is advised for buyers, and it might be prudent for holders to take profits or set stop-loss orders to protect against potential declines.

[Opening Range Breakout] S&R Strategy with Backtest (TSO) S&R Strategy with Backtest (TSO)
===========================================================================
===========================================================================
This indicator serves as a comprehensive full-cycle trading system, providing alerts at each stage of the trade, from opening to closure. The algorithm initiates by calculating the Opening/Pre-Market Price Range, waiting for a breakout to generate signals, and establishing TP (Take Profit and SL (Stop Loss) levels. The Opening/Pre-Market range, known for its robust support and resistance levels, is a key element. To filter out false breakouts and capture valid ones, the indicator incorporates a Smart Breakout feature, requiring confirmation through an initial breakout, a confirmation bounce, and a subsequent confirmation breakout. The indicator offers a variety of automated approaches for TP (Take-Profit) and SL (Stop-Loss) settings. These include leveraging opening range levels, both the most recent and historical S&R (Support and Resistance) levels, and an ATR (Average True Range) trailing stop-loss. This diverse set of tools ensure flexibility in tailoring TP (Take-Profit) and SL (Stop-Loss) parameters to different market conditions, contributing to a more adaptive and robust trading system. Additionally, a series of signal analysis tools, including candle bar analysis, divergence, and volume, enhance the precision of trading signals.
* Works with popular timeframes: 1M, 3M, 5M, 15M, 30M, 45M, 1H.
* Works best with Indices, Stocks, and Commodities, since there is pre-market price movement, which is used to obtain support and resistance price range.
* Every action of the trade is calculated on a confirmed closed candle bar state (barstate.isconfirmed), so the indicator will never repaint.
==============================================================
Indicator visual examples with various instruments:
---------------------------------------------------------------------------
Strategy Config: ORB_AAPL(NASDAQ)_15M
Example of Signal Cleanup confirmations via SMA and ATR. Take-Profit is calculated per optimal S&R (resistance) most recent levels.
---------------------------------------------------------------------------
Strategy Config: ORB_AMD(NASDAQ)_5M
Example of optimal S&R (resistance) level from previous day for Take-Profit 1 target, which gets hit.
---------------------------------------------------------------------------
Strategy Config: ORB_META(NASDAQ)_5M
Example of dynamic SL (Stop-Loss), which reduces the risk by moving to the new support level, which is at the same time is below the current price. Also Signal Cleanup confirmations via SMA, ATR and VWAP
---------------------------------------------------------------------------
Strategy Config: ORB_MSFT(NASDAQ)_15M
Example of automated ATR Trail Stop-Loss activation at no optimal S&R (support) feature.
---------------------------------------------------------------------------
Strategy Config: ORB_NFLX(NASDAQ)_3M
Example of a skipped LONG trade due to no optimal S&R (support) for Stop-Loss (can be seen per chart that it would be a loss trade). On another side, a SHORT SMA Confirmed trade hits all 3 profit targets.
---------------------------------------------------------------------------
Strategy Config: ORB_NVDA(NASDAQ)_15M
Example of no optimal support for SHORT Take-Profit targets, with ATR Trail Stop-Loss.
---------------------------------------------------------------------------
Strategy Config: ORB_SPY(AMEX)_15M
Example of several signal confirmations at the same time (SMA, VWAP, EWO) and S&R-TP-Entry-SL SL (Stop-Loss) system, which at trade open sets SL (Stop-Loss) per optimal S&R (since this is a LONG trade - support) and then moves to Entry at first take-profit.
===========================================================================
Trading open/close/TP/SL labels, plots and colors explanations:
---------------------------------------------------------------------------
>>> Opening/Pre-Market range: White dashed lines show opening range/pre-market levels with dotted white line extend along the Trading Schedule (if Trading Schedule is turned off - it will extend until next day).
>>> Smart Breakout: 1) Initial Breakout: "init_Brekout" | 2) Confirmation Bounce: "conf_Bounce" | 3) Confirmation Breakout: "conf_Breakout" (additional lables on chart can be hidden with only Confirmation Breakout shown).
>>> Additional S&R (Support and Resistance) lines: yellow - support, blue - resistance (can be hidden).
>>>>> LONG open: green "house" looking arrow below candle bar.
>>>>> SHORT open: red "house" looking arrow above candle bar.
>>>>> LONG/SHORT take-profit target: green/red circles (multi-profit > TP2/3/4/5 smaller circles).
>>>>> LONG/SHORT stop-loss target: green/red + crosses.
>>>>> LONG/SHORT take-profit hits: green/red diamonds.
>>>>> LONG/SHORT stop-loss hits: green/red X-crosses.
>>>>> LONG/SHORT EOD (End of Day | Intraday style) close (profitable trade): green/red squares.
>>>>> LONG/SHORT EOD (End of Day | Intraday style) close (loss trade): green/red PLUS(+)-crosses.
===========================================================================
STATS TABLE ///////////////////////////////////////////////////////////////
---------------------------------------------------------------------------
>>> Trading STATS table on the chart showing current trade direction, Last TP (Take-Profit) Taken, Current Trade PL (profit/loss in price difference from trade open to the very current state).
---------------------------------------------------------------------------
CUSTOM TRADING DATE RANGE /////////////////////////////////////////////////
---------------------------------------------------------------------------
>>>>> This feature can be used to manually set indicator trading range from and to a specific date and time. NOTE: This is not intended for a very long date range backtesting, utilize TradingView Strategy Tester for that.
* Use TradingView “Strategy Tester” to see Backtesting results
NOTE: If Strategy Tester does not show any results with Date Ranged fully unchecked, there may be an issue where a script opens a trade, but there is not enough TradingView power to set the Take-Profit and Stop-Loss and somehow an open trade gets stuck and never closes, so there are “no trades present”. In such case - manually check “Start”/“End” dates or use “Deep Backtesting” feature!
---------------------------------------------------------------------------
INTRADAY/TRADING SCHEDULE | ET (EASTERN TIMEZONE) ////////////////////////
---------------------------------------------------------------------------
>>> Trading Schedule - On/Off: This is where an Intraday Session or any custom session can be turned on and then scheduled.
>>>>> Trading Schedule - Time: Trade open Signals/Alerts time zone Hours. | NOTE: US Market Active Hours: 09:30 - 16:00 ET / Power Hour: 15:00 - 16:00 ET)
>>> Trading Schedule - EOD(End of Day) Close - On/Off: Close trade if still open by certain hour (set below).
>>>>> Trading Schedule - EOD(End of Day) Close - Hour (ET): US trading session closes at 4PM ET > 16:00.
Here is when the trade will close with EOD(End of Day) Close/Trading Cut Off Hour set to 16, which is end of US trading session:
1/3/5min > will close at 15:55pm ET
15min > will close at 15:45pm ET
30min > will close at 15:30pm ET
45min > will close at 15:45pm ET
60min > will close at 16:00pm ET
Here is when the trade will close with EOD(End of Day) Close/Trading Cut Off Hour set to 15, which is 1 hour before the end of US trading session (right before power hour starts):
1/3/5min > will close at 14:55pm ET
15min > will close at 14:45pm ET
30min > will close at 14:30pm ET
45min > will close at 14:45pm ET
60min > will close at 15:00pm ET
---------------------------------------------------------------------------
TRADE SIGNAL CONFIGURATION ////////////////////////////////////////////////
---------------------------------------------------------------------------
>>> Opening Range - Time Period (ET): Opening/Pre-Market Range time, which by default is set to US Session Pre-Market Range, can be customized to any time range as there are different market hours around the world and this setting can be customized to any time. Pre-Market Time/Price Range Hours(ET) | Pre-Market EU/Asia Hours: 4:00-9:30 ET | Pre-Market US (NY) Hours: 7:00-9:30 ET | Post-Market US Hours: 16:00-19:00 ET | First US Market Hour: 9:30-10:30 ET | Power Hour: 15:00-16:00)
>>> Opening Range - Levels Structure: determines how the price range is calculated, based on the highest/lowest price zones or based on the candle body bar.
>>> Opening Range - Breakout System: "Simple": bar close price has to simply break the opening range level | "Smart": After initial breakout (which is basically 'Simple' Breakout), a price come back is expected to the opening range level, a bounce, then a confirmation breakout with price closing ahead of the initial breakout.
>>>>> Opening Range - Smart Breakout: # of bars until Initial Breakout becomes invalid
>>>>> Opening Range - Smart Breakout: Bounce Settings, "Cross-Return" - LONG: Price has to cross down the initial breakout S&R, but never close below it; SHORT: Price has to cross up the initial breakout S&R, but then close above it; ||| "Cross-Close-Return" - LONG: At least 1 candle has to close below initial breakout S&R; SHORT: At least 1 candle has to close above initial breakout S&R.
>>>>> Alerts - Opening Range - Smart Breakout: Confirmation Bounce Alert. Trigger an alert at confirmation bounce. This is for live trading (especially scalping) Smart Breakout approach - to get ready to open the trade in the correct direction.
---------------------------------------------------------------------------
TAKE-PROFIT/STOP-LOSS CONFIGURATION ///////////////////////////////////////
---------------------------------------------------------------------------
>>> TP (Take-Profit) and SL (Stop-Loss): S&R Search - Left Bars: This setting is for calculating optimal S&R (Support and Resistance) levels (in combination with below - Right Bars) for S&R (Support and Resistance) TP (Take-Profit) levels calculations. NOTE: if at any point - there will be no available S&R (Support & Resistance) found for SL (Stop-Loss, 'S&R-Dynamic-SL' or 'S&R-Static-SL' setting, since both settings search for optimal SL (Stop-Loss) at trade open) or TP (Take-Profit, at any setting, since at trade open, an optimal TP (Take-Profit) level is searched) > SL (Stop-Loss) will automatically switch to trailing ATR-Trailing-SL and the trade will continue to run until it either hits ATR-Trailing-SL (Stop-Loss) or closes at EOD (End of Day).
>>> TP (Take-Profit) and SL (Stop-Loss): S&R Search - Right Bars: This setting is for calculating optimal S&R (Support and Resistance) levels (in combination with above - Left Bars) for S&R (Support and Resistance) TP (Take-Profit) levels calculations. NOTE: if at any point - there will be no available S&R (Support & Resistance) found for SL (Stop-Loss, 'S&R-Dynamic-SL' or 'S&R-Static-SL' setting, since both settings search for optimal SL (Stop-Loss) at trade open) or TP (Take-Profit, at any setting, since at trade open, an optimal TP (Take-Profit) level is searched) > SL (Stop-Loss) will automatically switch to trailing ATR-Trailing-SL and the trade will continue to run until it either hits ATR-Trailing-SL (Stop-Loss) or closes at EOD (End of Day).
>>> TP (Take-Profit) and SL (Stop-Loss): S&R Search - Custom Resolution: This is a custom timeframe setting specifically for S&R Search, it disregards current chart timeframe. This is great to use for scalping, for example: with main chart set to 1min and the custom timeframe set to 3min or 5min - there will be stronger support/resistance levels with more detailed price action.
>>> TP (Take-Profit) and SL (Stop-Loss): # of Bars (5000 max) to search back for optimal Support and Resistance levels: This is how many candles will be searched backwards for previous S&Rs (Support and Resistance) to find the optimal levels for TP (Take-Profit) and SL (Stop-Loss). NOTE: If SL (Stop-Loss) System is set to 'ATR-Trailing-SL' - this setting is only relevant for searching TP (Take-Profit) levels.
>>> TP (Take-Profit) and SL (Stop-Loss): At Trade Open - No S&R (Support and Resistance) found behavior: 'Skip Trade': If at trade open there are no S&R (Support and Resistance) levels for TP1 (Take-Profit 1) or SL (Stop-Loss) - trade is skipped. 'Open/ATR-Trailing-SL': If at trade open there are no S&R (Support and Resistance) levels for TP1 (Take-Profit 1) or SL (Stop-Loss), the trade will still be open with SL (Stop-Loss) set to 'ATR-Trailing-SL'.
>>> TP (Take-Profit) System: Pre-Market-Range-TP: All TP (Take-Profit) targets are calculated at trade open using the distance between Support and Resistance per Opening Pre-market Range and then divided by TP (Take-Profit) Divider, which can be set below; S&R-Current-Optimal-TP1: TP1 (Take-Profit) level is set per currently available S&R (Support & Resistance), if none available - historical S&R (Support & Resistance) levels will be searched, remaining TP (Take-Profit) targets (if selected, up to 5 # of TPs) are searched through most recent closest historical S&R (Support & Resistance) levels; S&R-Historic-Optimal-TP1: TP1 (Take-Profit) level is set per historically most recent closest available S&R (Support & Resistance) to the Entry price, remaining TP (Take-Profit) targets (if selected, up to 5 # of TPs) are searched through historical S&R (Support & Resistance) levels as well.
>>> TP (Take-Profit, Pre-Market-Range-TP) Divider #: This is for 'Pre-Market-Range-TP' setting only, where TP (Take-Profit) level is the distance between top/bottom levels of the opening range. It can be reduced by the divider #. (1 - full distance; 2 - 1/2 distance; 3 - 1/3 distance; etc.
>>> TP (Take-Profit) # of targets: It is wise to divide the trade into several profit targets. With this setting - up to 5 TP (Take-Profit) targets can be approached. The trade will be equally divided up by the selected # of TP (Take-Profit) targets.
>>> TP (Take-Profit) target(s) Consumed: Signal Bar consuming Take-Profits - trade signal bar is big enough to 'consume'/close ahead of the first TP setting > the signal can either be skipped, or all Take-Profit targets pushed ahead by average bar size).
>>> TP (Take-Profit) Offset - On/Off: This is a feature where TP (Take-Profit) target will be considered taken even if the price never crosses the target(s), but comes close enough (based on the offset amount). Set the offset amount below.
>>>>> TP (Take-Profit) Offset - Amount: Some Examples: (for SPY 0.1 would be $0.10 offset - if TP1 is $400 and price hits $399.90 > TP1 considered taken/signal shown/alert) | NOTE: For EURUSD, it is very different and if wrong will show TP1 immediately at trade open, typical good offset for EURUSD is: 0.0005 | Similar for BTCUSD, for example: 10 - $10 offset, if TP is $15,000 > $14,990.
>>> SL (Stop-Loss) System: 'Pre-Market-Range-SL': SL (Stop-Loss) is set to the opposite market range level from trade direction; 'S&R-Static-SL': SL (Stop-Loss) is set at trade open per optimal most recent S&R level and remains there until trade closes; 'S&R-Dynamic-SL': SL (Stop-Loss) is set at a trade open per optimal S&R (Support and Resistance) level from the most recent AND historical S&Rs (Support and Resistance), with every bar closed it will check if there are new S&Rs (Support and Resistance) levels, if these levels appear closer to the current price then current level - it will move SL (Stop-Loss) to that level, therefore reducing the risk; 'ATR-Trailing-SL': SL (Stop-Loss) is trail-following the ATR (Average True Range) line, NOTE: If at signal trigger, ATR will be against the trade direction - trade open signal will be skipped; 'S&R-TP-Entry-SL': SL (Stop-Loss) initially is set per S&R, then moves to Entry price at the very first TP (Take-Profit) hit and remains there until trade closes; 'S&R-TP-Trail-SL': SL (Stop-Loss) initially is set per S&R, then moves to Entry at TP1 (Take-Profit 1) hit, then keeps trailing per previously taken profit targets (TP2 taken, SL moves to TP1 | TP3 taken, SL moves to TP2 | TP4 taken, SL moves to TP3). NOTE: 'ATR-Trailing-SL' will not switch automatically if 'S&R-Dynamic-SL', S&R-TP-Entry-SL', 'S&R-TP-Trail-SL' system is selected, as already the most optimal SL (Stop-Loss) level is calculated - it will switch automatically only with 'S&R-Static-SL' system.
>>> SL (Stop-Loss) - On/Off: Without SL (Stop-Loss), unless EOD (End of Day) Close is turned on - there will be no SL (Stop-Loss) at all!
---------------------------------------------------------------------------
SIGNAL ANALYSIS AND CLEANUP ///////////////////////////////////////////////
---------------------------------------------------------------------------
>>> Signal Cleanup - Bar Color: Include Bar Color (bullish/bearish) confirmation, LONG signal will only be opened if signal bar is green/bullish, SHORT if red/bearish.
>>> Signal Cleanup - Bar Directional Structure: Skip opposite bar structure types signals (For example: bearish green hammer).
>>> Signal Cleanup - Bar Doji Skip: Skip doji (indecisive) candles signals.
>>> Signal Cleanup - EWO (Elliott Wave Oscillator): Include EWO (Elliott Wave Oscillator), LONG will only be opened if EWO is bullish / SHORT if EWO is bearish.
>>> Signal Cleanup - VWAP (Volume-Weighted Average Price): Include VWAP (Volume-Weighted Average Price), LONG will only be opened if price is above VWAP / SHORT if price is below VWAP.
>>> Signal Cleanup - MA (Moving Average) Confirmation: Include MA (Moving Average), LONG will only be opened if MA is bullish / SHORT if MA is bearish.
>>> Signal Cleanup - ATR (Average True Range): Include ATR (Average True Range) confirmation, LONG will only be opened if ATR is bullish / SHORT if ATR is bearish.
>>> Signal Cleanup - Divergence(RSI + MACD): Include Divergence (RSI + MACD ) confirmation, LONG will only be opened if Divergence is bullish / SHORT if Divergence is bearish.
>>> Signal Cleanup - Volume % Strength: Include Volume strength/percentage confirmation, LONG/SHORT will only be opened with strong Volume matching the signal direction | By default, strong Volume percentage is set to 150% and weak to 50%.
>>> Signal Cleanup - Volume Above Average: Include Volume Above Moving Average (Volume closing bar closes above volume moving average) confirmation, LONG/SHORT will only be opened with Volume above average - Volume closed bar color must match the closed price color (bullish/bearish direction) + Volume bar must be closed above volume MA line).
---------------------------------------------------------------------------
===========================================================================
||||||||||||||||||||||||||||||||||| *** ||||||||||||||||||||||||||||||||||| *** |||||||||||||||||||||||||||||||||||
||||||||||||||||||||||||||||||||||| *** ||||||||||||||||||||||||||||||||||| *** |||||||||||||||||||||||||||||||||||
TP System - VERY IMPORTANT INFO!
-------------------------------------------------------------------------------------------------------------------
"TP PERCENTAGE" - amount by which current trade/position needs to be reduced/partially closed/sold.
-------------------------------------------------------------------------------------------------------------------
TP System: Dynamic
"TP PERCENTAGE" - will always be the same amount (trade/position size divided by the # of take-profit(TP) targets) and percentage to be closed will always be of the ORIGINAL trade/position.
-------------------------------------------------------------------------------------------------------------------
TP System: Static
"TP PERCENTAGE" - will always be the same amount IF take-profit(TP) targets are hit 1-by-1 (TP1 > TP2 > TP3 > TP4 > TP5), otherwise it will vary and unless it is a 1st take-profit(TP1), the REMAINING trade/position size will always be smaller than original and therefore the percentage to be closed will always be of the REMAINING trade/position and NOT the original one!
-------------------------------------------------------------------------------------------------------------------
"TP PERCENTAGE" CheatSheet (these are the only percentages you may see)
-----------------------------------------------------------------------
TP PERCENTAGE---Close/Sell Amount-------------Example (trade size: 50 stocks)
20%-------------trade size * 0.2--------------50 * 0.2 = 10 stocks
25%-------------trade size * 0.25-------------50 * 0.25 = 12.5(~13) stocks
34%-------------trade size * 0.34-------------50 * 0.34 = 17 stocks
40%-------------trade size * 0.4--------------50 * 0.4 = 20 stocks
50%-------------trade size * 0.5--------------50 * 0.5 = 25 stocks
60%-------------trade size * 0.6--------------50 * 0.6 = 30 stocks
66%-------------trade size * 0.66-------------50 * 0.66 = 33 stocks
75%-------------trade size * 0.75-------------50 * 0.75 = 37.5(~38) stocks
80%-------------trade size * 0.8--------------50 * 0.8 = 40 stocks
100%------------trade size--------------------50 = 50 stocks
-----------------------------------------------------------------------
If for any reason a portion of the current/remaining trade closed at such occurrence was slightly wrong, it is not an issue. Such occurrences are rare and with slight difference in partial TP closed is not significant to overall performance of our algorithms.
||||||||||||||||||||||||||||||||||| *** ||||||||||||||||||||||||||||||||||| *** |||||||||||||||||||||||||||||||||||
||||||||||||||||||||||||||||||||||| *** ||||||||||||||||||||||||||||||||||| *** |||||||||||||||||||||||||||||||||||
===========================================================================
Alert Settings (you don’t have to touch this section unless you will be using TradingView alerts through a Webhook to use with trading bot)
---------------------------------------------------------------------------
Here is how a LONG OPEN alert looks like.
NOTE: Each label , , etc. is customizable, you can change the text of it within indicator Input settings.
ALERT >>>>>>>>>>>>>>>>>>>>>>>>>>>>>>>>>>>>>>>>>>>>>>>
COIN: BTCUSD
TIMEFRAME: 15M
LONG: OPEN
ENTRY: 20000
TP1: 20500
TP2: 21000
TP3: 21500
TP4: 22500
TP5: 23500
SL: 19000
Leverage: 0
---------------------------------------------------------------------------
Here is how a TP1 alert will look with 5 TPs breakdown of the trade.
NOTE1: Next to TP1 taken it will show at which price it was triggered.
NOTE2: Next to "TP Percentage" it shows how much of the CURRENT/ACTIVE/REMAINING trade needs to be closed.
NOTE2: If TP2/3/4/5 comes before TP1 - the alert will tell you exactly how many percent of the trade needs to be closed!
ALERT >>>>>>>>>>>>>>>>>>>>>>>>>>>>>>>>>>>>>>>>>>>>>>>
COIN: BTCUSD
TIMEFRAME: 15M
LONG: TP1
TP1: 20500
TP Percentage: 20%
---------------------------------------------------------------------------
Here is how an alert will look for LONG - STOP-LOSS.
ALERT >>>>>>>>>>>>>>>>>>>>>>>>>>>>>>>>>>>>>>>>>>>>>>>
COIN: BTCUSD
TIMEFRAME: 15M
ENTRY: 20000
LONG: SL
SL: 19000
---------------------------------------------------------------------------
Here is how an alert will look for LONG - EOD (End of Day) In Profit close.
ALERT >>>>>>>>>>>>>>>>>>>>>>>>>>>>>>>>>>>>>>>>>>>>>>>
COIN: BTCUSD
TIMEFRAME: 15M
LONG: EOD-Close (profit)
ENTRY: 20000
EOD-Close: 21900
===========================================================================
Adding Alerts in TradngView
---------------------------------------------------------------------------
-Add indicator to chart and make sure the correct strategy is configured (check Backtesting results)
-Right-click anywhere on the TradingView chart
-Click on Add alert
-Condition: Select this indicator by it’s name
-Immediately below, change it to "alert() function calls only", as other wise there will be 2 alerts for every alert!
-Expiration: Open-ended (that may require higher tier TradingView account, otherwise the alert will need to be occasionally re-triggered)
-Alert name: Whatever you desire
-Hit “Create”
-Note: If you change ANY Settings within the indicator – you must DELETE the current alert and create a new one per steps above, otherwise it will continue triggering alerts per old Settings!
===========================================================================
If you have any questions or issues with the indicator, please message me directly via TradingView.
---------------------------------------------------------------------------
Good Luck! (NOTE: Trading is very risky, past performance is not necessarily indicative of future results, so please trade responsibly!)
---------------------------------------------------------------------------
NOTE: There seems to be a strange glitch when strategy is running live, it will show "double-take" take-profits labels on the chart. This is not affecting the script logic and backtesting results, if you simply change the timeframe real quick to something else then back - it will no longer show the duplicate orders... this must be some sort of a glitch as every alert was thoroughly tested to make sure everything is working!

YinYang VolumeOverview:
YinYang Volume is an Advanced Volume Indicator. Regular Volume can be deceiving. It can be hard to tell how much of the Volume bar is Buy vs Sell volume, especially since the bar is green or red simply based on if it closes at a greater price than it opened. With YinYang Volume you'll be able to see how much Buy AND Sell Volume there is on each bar. Being able to see both is very useful, but the cherry on top is the Buy and Sell Moving Average Lines. These lines (White is Buy and Orange is Sell) can show who is currently winning the fight, Bulls or Bears. When the lines cross it's a shift in momentum and when combined with other technical analysis you can better understand the direction the market is moving and make an informed and educated trading decision. YinYang Volume also has Information tables, these tables display the Buy vs Sell volume on different Timeframes. This way even if you're trading on a Low Timeframe (like 15 minutes) you can see how the Buy vs Sell volume is fairing on other Timeframes.
Tutorial:
Unlike most volume indicators, including standard volume, we can see both Buy AND Sell volume for each bar. You may be wondering, well what’s the importance of this? The answer is EVERYTHING! Volume is one of the most important indicators when it comes to trading. Nothing moves without volume. However, with standard volume, the bar is either red or green simply based on if it closes greater than it opens. Now, that is pretty silly if you ask us. Let’s get into depth as to why seeing both Buy and Sell volume is important, and examples for how you can make trades with it:
In this example above, we have 2 green bars and they both have high levels of volume. This bar on the right however, has more volume than the one on the left. The issue here is, the bar on the right has MORE Sell volume than it even does have Buy volume; meanwhile the bar on the left has way more buy volume than the bar on the right with little sell volume. Without separating them and by simply looking at the price bar and regular volume bar, we would never be able to deduce this. It is crucial to understand and see how much of each volume there is as it plays a huge role in the price movements.
The white line represents the Buy Volume Moving Average and the orange line represents the Sell Volume Moving Average. These moving averages are very useful as when they cross they represent strong Buy and Sell Signals.
We’ve enabled signals which plot circles onto the MA’s to display when they’ve crossed. The white circle represents a Buy Signal and the Orange circle represents a Sell Signal. These signals are very strong, but there is a catch that comes with it. The bar right after the signal has the highest chance of a reversal so it isn’t always advised to make the trade until confirmed that the reversal didn’t happen on the following bar. If you have enough data based on other technical analysis to know the first signal is true, then use it as a way to solidify the fact that it is a good entry/exit location.
You can change the length of which the MA’s are smoothed out over. For instance, in the previous examples and by default the length is 14. However, if we are to change it to 50 for instance, it makes them a longer lasting MA that has much fewer crosses. This can be useful based on your trading style and if you prefer to stay in trades for quite awhile. As you can see, all signals with the 50 length are quite accurate and would have produced profitable trades, likely more so than at 14, but since it moves slower there's fewer signals to trade on.
Our Information Tables are there to show you the amount of Buy vs Sell %’s on 6 different Time Frames at the same time. It can be very useful to know how people are feeling on different Time Frames without you having to change your own. This way you can stay on say the 15 minute Time Frame locked in your trade and can see if the momentum of your long trade is cooling down based on higher Time Frames Buy vs Sell volume %’s.
For example, let's say you got an alert from YinYang Volume for Buy Signal on the 1 Day. You then entered a trade which you deemed a good location on the 15 minutes (after doing your own technical analysis on the 15 minute too). The Buy vs Sell Volume %’s on the 1 Day was 55% Buy and 45% Sell when you entered the trade. You are still waiting for exit confirmation on the 15 minute but you notice the Buy vs Sell Volume % on the 1 Day goes down to 52% Buy and 48% Sell. You can see the momentum changing. Even though you haven’t received confirmation for exit on the 15 minute, it may still be a good time to get out as momentum is clearly changing on the 1 Day.
We will conclude this Tutorial here. We hope you’ll get some good use out of our Volume Indicator and its ability to display unique Volume Data. If you have any Questions, Comments, Suggestions or Concerns, please don’t hesitate to contact us.
Settings:
1. Show Signals:
Toggling this setting shows when the Buy and Sell Volume MA’s cross each other. It produces a white circle when the Buy Volume Crosses over the Sell Volume (BULLISH) and an orange circle when the Sell Volume Crosses over the Buy Volume (BEARISH).
2. Length:
How far back should we average the Buy and Sell Volume Moving Averages? 14 is default has been tested and proven to work well, however you can change it if there is a different value that suits your trading style better.
3. Type:
How is the Moving Averages calculated? VWMA (Volume Weighted Moving Average) is the default as it has been tested and worked best; afterall, we are calculating volume and therefore should use a volume weighted MA calculation. However, you can change it as your options are:
VWMA, EMA and SMA
4. Information Tables:
4.1. Show Information Tables:
Our Information tables display 6 different resolutions so you can see how much Buy vs Sell volume there is as a % in multiple different Time Frames without having to change your Time Frame.
4.2. Strength:
The Buy / Sell Volume %’s displayed within your Information Tables are based on Moving Averages. The length this moving average uses is based on the Strength you select. The strengths aren’t as simple as just a length amount but are a calculation involving multiple different lengths and averages. However, the stronger the strength, generally the farther the lookback length is as an average. Your options for strength are:
Unbreakable
Very Strong
Strong
Average
Weak
Very Weak
Glass
We recommend ‘Average’ Strength, however if you find you want to see the %’s change more or less frequently you can adjust to your trading style
4.3. Res1 / Res2/ Res3 / Res4 / Res5 / Res6:
These represent the different resolutions (Time Frames) being used in your information tables and can be modified to display whatever resolution works best for your trading style. By default they are:
Res1: Current Timeframe
Res2: 15 Minute
Res3: 1 Hour
Res4: 4 Hour
Res5: 1 Day
Res6: 1 Week
Backup Res (not changeable): 5 Minute (this is only used if your Current Timeframe in Res1 is a duplicate of one of the other resolutions)
HAPPY TRADING!

SMC Pro+ ICT v4 Enhanced - FINAL🎯 SMC Pro+ ICT v4 Enhanced - Complete Smart Money Trading System📊 Professional All-in-One Indicator for Smart Money Concepts & ICT MethodologyThe SMC Pro+ ICT v4 Enhanced is a comprehensive trading system that combines Smart Money Concepts (SMC) with Inner Circle Trader (ICT) methodology. This indicator provides institutional-grade market structure analysis, liquidity mapping, and volume profiling in one powerful package.✨ CORE FEATURES🏗️ Advanced Market Structure Detection
MSS (Market Structure Shift) - Identifies major trend reversals with precision
BOS (Break of Structure) - Confirms trend continuation moves
CHoCH (Change of Character) - Detects internal structure shifts
Modern LuxAlgo-Style Lines - Clean, professional visualization
Dual Sensitivity System - External structure (major swings) + Internal structure (minor swings)
Customizable Labels - Tiny, Small, or Normal sizes
Structure Break Visualization - Clear break point markers
💎 Supply & Demand Zones (POI - Point of Interest)
Institutional Order Blocks - Where smart money enters/exits
ATR-Based Zone Sizing - Dynamically adjusted to market volatility
Smart Overlap Detection - Prevents cluttered charts
Historical Zone Tracking - Maintains up to 50 zones
POI Central Lines - Pinpoint entry/exit levels
Auto-Extension - Zones extend to current price
Auto-Cleanup - Removes broken zones automatically
📦 Fair Value Gap (FVG) Detection
Bullish & Bearish FVGs - Institutional inefficiencies
Consequent Encroachment (CE) - 50% fill levels
Auto-Delete Filled Gaps - Keeps charts clean
Customizable Lookback - 1-30 days of history
Color-Coded Zones - Easy visual identification
CE Line Styles - Dotted, Dashed, or Solid
🚀 Enhanced PVSRA Volume Analysis
This is one of the most powerful features:
200% Volume Candles - Extreme institutional activity (Lime/Red)
150% Volume Candles - High institutional interest (Blue/Fuchsia)
Volume Climax Detection - Major reversal signals with 2.5x+ volume
Exhaustion Signals - Identifies buying/selling exhaustion with high accuracy
Enhanced Volume Divergence - NEW! High-quality reversal detection
Price makes lower low, Volume makes higher low = Bullish Divergence
Price makes higher high, Volume makes lower high = Bearish Divergence
Strict trend context filtering for accuracy
Rising/Falling Volume Patterns - Momentum confirmation (allows 1 exception in 3 bars)
Volume Spread Analysis - Price range × Volume for true strength
Body/Wick Ratio Analysis - Candle structure quality
ATR Normalization - Adjusts for different market volatility
Volume Profile Indicators - 🔥 EXTREME, ⚡ VERY HIGH, 📈 HIGH, ✅ ABOVE AVG
💧 Advanced Liquidity System
Smart money targets these levels:
Weekly High/Low Liquidity - Major institutional targets
Daily High/Low Liquidity - Intraday key levels
4H Session Liquidity - Short-term targets
Distance Indicators - Shows % distance from current price
Strength Indicators - Identifies high-probability sweeps
Swept Level Detection - Tracks executed liquidity grabs
Customizable Line Styles - Width, length, offset controls
Color-Coded Levels - Easy visual hierarchy
🎯 Master Bias System
Data-driven directional bias with 9-factor scoring:
Bull/Bear Bias Calculation - 0-100% scoring system
Multi-Timeframe Analysis - Daily, 4H, 1H trend alignment
Kill Zone Integration - London (2-5 AM) & NY (8-11 AM) sessions
EMA Alignment Factor - Trend confirmation
Volume Confirmation - Adds 5% when volume supports direction
Range Filter Integration - Adds 10% for trending markets
Session Context - Above/below session midpoint scoring
Bias Strength Rating - STRONG (>75%), MODERATE (60-75%), WEAK (<60%)
Real-Time Updates - Dynamic recalculation
📈 Premium & Discount Zones
Fibonacci-based institutional pricing:
Extreme Premium - Above 78.6% (Overvalued)
Premium Zone - 61.8% - 78.6% (Expensive)
Equilibrium - 38.2% - 61.8% (Fair Value)
Discount Zone - 21.4% - 38.2% (Cheap)
Extreme Discount - Below 21.4% (Undervalued)
Visual Zone Boxes - Color-coded for instant recognition
200-500 Bar Lookback - Customizable range calculation
🔄 Range Filter
Advanced trend detection:
Smoothed Range Calculation - Eliminates noise
Dynamic Support/Resistance - Auto-adjusting levels
Upward/Downward Counters - Measures trend strength
Color-Coded Line - Green (uptrend), Red (downtrend), Orange (ranging)
Adjustable Period - 1-200 bars
Multiplier Control - Fine-tune sensitivity (0.1-10.0)
🌊 Liquidity Zones (Vector Zones)
PVSRA-based horizontal liquidity:
Above Price Zones - Resistance clusters
Below Price Zones - Support clusters
Maximum 500 Zones - Professional-grade capacity
Body/Wick Definition - Choose zone boundaries
Auto-Cleanup - Removes cleared zones
Color Override - Custom styling options
Transparency Control - 0-100% opacity
📊 EMA System
Triple EMA trend confirmation:
Fast EMA (9) - Green line - Immediate trend
Medium EMA (21) - Blue line - Short-term trend
Slow EMA (50) - Red line - Major trend
EMA Alignment Detection - Bull/Bear stack confirmation
Dashboard Integration - Status: 📈 BULL ALIGN, 📉 BEAR ALIGN, 🔀 MIXED
Adjustable Lengths - Customize all three EMAs (5-200)
🎯 IDM (Institutional Decision Maker) Levels
Key institutional price levels:
Latest IDM Detection - 20-bar pivot lookback
Extended Lines - Projects 50 bars into future
Customizable Styles - Solid, Dashed, or Dotted
Line Width Control - 1-5 pixels
Color Selection - Match your chart theme
Price Label - Shows exact level with tick precision
📱 Professional Dashboard
Real-time market intelligence panel:
🎯 SIGNAL - 🟢 LONG, 🔴 SHORT, ⏳ WAIT, 🛑 NO TRADE
🎲 BIAS - Bull/Bear with STRONG/MODERATE/WEAK rating
📊 BULL/BEAR Scores - 0-100% percentage display
💎 ZONE - Current premium/discount location
🕐 KZ - Kill Zone status (🇬🇧 LONDON/🇺🇸 NY/⏸️ OFF)
🏗️ STRUCT - Market structure status (BULLISH/BEARISH/NEUTRAL)
⚡ EVENT - Last structure event (MSS/BOS)
⚡ INT - Internal structure trend
🎯 IDM - Latest institutional level
📊 EMA - EMA alignment status
🔄 RF - Range Filter direction
📊 PVSRA - Volume status (🚀 CLIMAX/📈 RISING/📉 FALLING)
📅 MTF - Multi-timeframe alignment (✅ FULL/⚠️ PARTIAL/❌ CONFLICT)
💪 CONF - Confidence score (0-100%)
📊 VOL - Volume ratio (e.g., 1.8x average)
Advanced Metrics (Toggle On/Off):
📏 RSI - Value + Status (OVERBOUGHT/STRONG/NEUTRAL/WEAK/OVERSOLD)
📈 MACD - Value + Direction (BULL/BEAR)
🌪️ VOL - Volatility state (⚠️ EXTREME/🔥 HIGH/📊 NORMAL/😴 LOW)
🔊 VOL PROF - Volume profile ratio
⏱️ TF - Current timeframe
Dashboard Customization:
4 Positions - Top Left, Top Right, Bottom Left, Bottom Right
3 Sizes - Small, Normal, Large
2 Modes - Compact (MTF combined) or Full (separate rows)
Professional Design - Dark theme with color-coded cells
🎮 TRADING SIGNALS & SETUP SCORING🟢 LONG Setup Requirements (9-Factor Confidence Score)
MTF Alignment - Daily/4H/1H/Structure all bullish (+2 points for full, +1 for partial)
Volume Confirmation - Above 1.2x average (+1 point)
Structure Event - MSS or BOS bullish (+2 points)
EMA Alignment - 9 > 21 > 50 (+1 point)
Kill Zone Active - London/NY + Bull bias >75% (+2 points)
Bias Match - Master bias matches structure trend (+1 point)
Confidence Threshold - >60% minimum for signal
🔴 SHORT Setup Requirements
Same 9-factor system but inverted for bearish conditions.💪 Confidence Levels
75-100% - ⭐ HIGH CONFIDENCE (Strong setup, all factors aligned)
50-74% - ⚠️ MODERATE (Good setup, partial alignment)
0-49% - ❌ LOW CONFIDENCE (Wait for better setup)
🎯 Signal Output
🟢 LONG - Bull bias + Bullish structure + >60% confidence
🔴 SHORT - Bear bias + Bearish structure + >60% confidence
⏳ WAIT LONG - Bull bias but low confidence
⏳ WAIT SHORT - Bear bias but low confidence
🛑 NO TRADE - Neutral bias or conflicting signals
🔔 COMPREHENSIVE ALERT SYSTEM (12 Alerts)Structure Alerts
⚡ MSS Bullish - Major bullish reversal
⚡ MSS Bearish - Major bearish reversal
📈 BOS Bullish - Bullish continuation
📉 BOS Bearish - Bearish continuation
⚠️ CHoCH Bullish - Internal bullish shift
⚠️ CHoCH Bearish - Internal bearish shift
Bias & Confidence Alerts
🟢 Bias Shift Bull - Master bias turns bullish
🔴 Bias Shift Bear - Master bias turns bearish
⭐ High Confidence - Setup reaches 75%+ confidence
Volume Alerts (High Probability)
🚀 Volume Climax Buy - Extreme bullish volume spike
💥 Volume Climax Sell - Extreme bearish volume spike
⚠️ Selling Exhaustion - Potential bullish reversal
⚠️ Buying Exhaustion - Potential bearish reversal
📊 Bullish Volume Divergence - High-quality bullish reversal signal
📊 Bearish Volume Divergence - High-quality bearish reversal signal
🎨 EXTENSIVE CUSTOMIZATIONColors & Styling
✅ All colors customizable for every component
✅ Supply/Demand zone colors + outlines
✅ FVG colors (bullish/bearish)
✅ PVSRA candle colors (6 types)
✅ Liquidity level colors (Weekly/Daily/4H/Swept)
✅ Structure line colors
✅ Premium/Equilibrium/Discount zone colorsDisplay Controls
✅ Toggle each feature on/off independently
✅ Adjustable sensitivities (Structure: 5-30, Internal: 3-15)
✅ Label size controls (Tiny/Small/Normal)
✅ Line width adjustments (1-5 pixels)
✅ Transparency controls (0-100%)
✅ Extension lengths (20-100 bars)
✅ Lookback periods (50-500 bars)Volume Settings
✅ PVSRA symbol override (trade one asset, analyze another)
✅ Climax threshold (2.0-5.0x)
✅ Rising volume bar count (2-5 bars)
✅ Divergence filters (Strict/Lenient)
✅ Divergence minimum bars (10-30)
✅ Volume threshold multiplier (1.0-2.0x)Dashboard Settings
✅ Position (4 corners)
✅ Size (Small/Normal/Large)
✅ Compact/Full mode
✅ Show/Hide advanced metrics
✅ Show/Hide EMA status💡 BEST PRACTICES & USAGE TIPS⏰ Optimal Timeframes
Scalping - 1m, 5m (Use Kill Zones, Volume Climax, FVG)
Day Trading - 5m, 15m, 1H (Use Structure, Liquidity, Bias)
Swing Trading - 4H, Daily (Use MTF, Premium/Discount, Structure)
Position Trading - Daily, Weekly (Use major structure, liquidity)
🎯 Asset Classes
✅ Forex - All pairs (especially majors during Kill Zones)
✅ Crypto - BTC, ETH, altcoins (24/7 liquidity)
✅ Stocks - All stocks and indices (use session times)
✅ Commodities - Gold, Silver, Oil (high volume periods)
✅ Indices - S&P 500, NASDAQ, DAX, etc.🔥 High-Probability Setups
The Perfect Storm
MSS in direction of daily trend
Kill Zone active
Volume climax
Confidence >75%
Price in discount (long) or premium (short)
Volume Divergence Play
Enhanced volume divergence signal
CHoCH confirms direction change
Price near liquidity level
FVG forms for entry
Liquidity Sweep
Price sweeps weekly/daily high/low
Immediate rejection (selling/buying exhaustion)
Structure shift (MSS)
Volume confirmation
Structure Retest
BOS breaks structure
Price returns to POI/FVG
Volume confirms (>1.2x)
Kill Zone active
📊 Multi-Timeframe Analysis
Higher Timeframe - Identify trend & structure (Daily/4H)
Trading Timeframe - Find entries (15m/1H)
Lower Timeframe - Precise entries (1m/5m)
Look for MTF alignment - Dashboard shows ✅ FULL or ⚠️ PARTIAL
⚠️ Risk Management
Always use stop-loss (below/above recent structure)
Position size: 1-2% risk per trade
Target liquidity levels for take profit
Use supply/demand zones for SL placement
Watch for exhaustion signals near targets

Volume Pulse [ziksfx]Volume Pulse is a clean volume indicator designed to make it easier to read meaningful changes in activity without cluttering your chart. It enhances the standard volume view by supporting both classic volume and dollar volume , highlighting spikes and extreme bars and adding a compact label on the latest bar so you always see the current volume value at a glance. The script is intended to be used in a separate volume pane.
How it works
– Supports two modes: standard volume or dollar volume (close × volume).
– Colors volume bars by candle direction (up/down). Optionally, it can:
• highlight volume spikes above a moving average;
• mark the highest-volume bar over a user-defined lookback period.
– Plots a simple moving average of volume so you can quickly see when activity is above or below typical levels.
– On the latest bar, shows a small label with the current volume value, automatically abbreviated (K / M / B) and optionally prefixed with “$” in dollar-volume mode.
Inputs & customization
– Volume type: choose between standard volume and dollar volume.
– Volume MA length: controls how sensitive the moving average is to recent changes in activity.
– Spike highlighting: optional, turns on/off coloring for bars where volume exceeds the moving average.
– Highest-volume bar lookback: sets the period for detecting the highest-volume bar.
– Label position: choose whether the last-bar label appears on the left or right side of the bar, and optionally shift it slightly above the bar for better readability.
Use cases
Use Volume Pulse to:
– Spot sudden spikes in volume and compare them to the recent average.
– Identify sessions or candles with unusually high activity relative to a chosen TF.
– Visually study how volume behaves around price moves, breakouts or potential fakeouts to better understand their strength or weakness.
– Keep track of the latest bar’s volume instantly, without having to read the raw scale values.
This indicator works on any symbol that has volume data (stocks, futures, crypto and more), but volume quality may vary between markets and instruments. It is intended as an analytical and educational tool only: it does not constitute financial advice and does not provide or guarantee any trading results. Always combine volume context with your own analysis and risk management.

Malama's Heat MapOverview
Malama's Heat Map is an overlay indicator that visualizes historical liquidity as a dynamic heatmap aligned with the price chart, using volume as a proxy to map activity across time (X-axis) and price levels (Y-axis). It constructs a grid of up to 5000 cells via a matrix, distributing bar volume into discrete price bins to highlight concentration zones, creating a color-graded visualization from cool (low activity) to hot (high liquidity). This aids in identifying "Type II" fair value areas, support/resistance from past volume clusters, or potential imbalances without order book access. Built for v6 compatibility with efficiency in mind—computations run solely on the last bar, includes object limit enforcement, and offers two intra-bar volume distribution methods for flexible approximation.
Core Mechanics
The indicator generates a trailing heatmap through binning, accumulation, and box-based rendering:
Grid Setup: Configurable lookback (bars back, default 100) sets horizontal time span; bins (price divisions, default 50) define vertical resolution, limited to 5000 total cells to prevent errors. Bin height dynamically = max(mintick, (lookback high - low) / bins).
Y-Axis Stabilization: Anchors boundaries to the prior bar's high/low (if available) for a flicker-free view during live bar updates. All historical bar data (high/low/close/volume) is clipped to these bounds.
Volume Distribution Proxy:
Even: Divides bar volume equally across spanned bins (straightforward uniform spread).
POC Weighted (Inverse): Treats bar close as POC proxy; applies inverse distance weighting (1/(|bin - POC bin| + 1), normalized) to emphasize volume near the estimated control point, simulating clustered intra-bar trading.
Matrix Building: On last bar only, loops backward over lookback bars (newest right-aligned). For each, computes low/high bin indices, distributes volume per selected method into the matrix (columns=time, rows=price bins from low to high).
Scaling & Palette: Extracts max matrix value for relative normalization (0-1); maps to a 5-tier stepped color scheme (user-customizable: blue 90% transp. low → red 50% transp. high) for non-linear intensity.
Rendering: Clears old boxes, then iterates matrix to draw only non-zero cells as thin boxes: X spans one bar width (left=historical index from bar_index, right=next bar), Y fills bin height. Borderless for seamless heatmap effect.
The result is a right-leaning, chart-scrolling visualization emphasizing recent liquidity buildup.
Why This Adds Value & Originality
While session-based volume profiles exist, this heatmap captures ongoing multi-bar liquidity evolution ("Type II" style), revealing horizontal value areas or gaps dynamically. Originality shines in the custom inverse-weighting for POC realism (no ta.* dependencies), matrix-driven persistence for quick redraws, and stabilization to eliminate repaints—issues plaguing similar scripts. v6 adaptations (e.g., custom clamp, matrix recreation on input change) ensure broad compatibility without bloat. It condenses complex liquidity scanning into one tool: spot red "hot" bands as magnets, blue voids as FVGs. Unlike generic heatmaps, the proxy options and limit-aware design scale across timeframes/assets (e.g., forex vs. crypto), reducing the need for layered indicators.
How to Use
Setup: Apply as overlay. Defaults suit ~4-day 1H view; tune lookback/bins (e.g., 50x100 for intraday fine-detail, but watch 5000 cap—errors auto-flag excesses). Select "POC Weighted" for nuanced clustering, "Even" for simplicity. Customize palette (e.g., desaturate for dark themes).
Reading the Heatmap:
X-Axis (Time): Left=older (fainter context), right=recent focus; tracks evolving liquidity trails.
Y-Axis (Price): Bottom=range low, top=high; vertical density shows price-level attraction.
Colors: Faint blue (sparse volume, possible inefficiencies) → vivid red (dense activity, likely SR). Horizontal streaks = sustained value zones.
Trading Insights: Price wicking into red? Anticipate fills/reversals. Blue gaps post-break? Targets for retraces. Ideal on 5M–Daily; layer with candlesticks off for purity.
Example: In BTCUSD 4H, a yellow-red band at $60K from prior consolidation → treat as dynamic support for longs on dips.
Tips
Balance settings: High bins = sharper verticals but cap lookback (e.g., 80x60=4800 cells). Test on volatile pairs first.
"POC Weighted" excels in ranging markets; switch to "Even" for trending (avoids close-bias skew).
For deeper analysis, screenshot/export or pair with divergence tools; add manual alerts via box counts if extended.
Efficiency: Last-bar only keeps it snappy; refresh on input tweaks.
Limitations & Disclaimer
Visualization is historical/proxy-based—lagging by one bar, no forward projection or tick-level precision (close-as-POC is estimate). Clipping may trim outlier wicks; low-volume bars dilute globally. Stepped colors are relative (max scales per redraw), potentially compressing extremes. Exceeds 5000 cells? Runtime error halts—no fallback resize. Not real liquidity (volume ≠ depth); best as visual aid, not quantitative. Updates post-close only. Backtest zones on specific symbols—correlation ≠ causation. Not advice; trade responsibly. Ideas in comments!

Ghost Candles [BruzX]█ OVERVIEW
This indicator provides a visual representation of volume intensity by adjusting bar transparency based on statistical volume analysis. Unlike traditional volume indicators that only show volume bars below the chart, Ghost Candles can integrates volume information directly into the price bars themselves.
█ FEATURES
Visual Volume Integration: Volume information is embedded directly in price bar appearance, reducing the need to constantly reference volume bars
Statistical Significance: Uses z-score calculations rather than simple comparisons to identify truly unusual volume
Customizable Colours: Separate colour inputs for bullish and bearish candles to match your chart theme
Volume Bar Colouring: Optional synchronized colouring of volume bars to match candle transparency
Moving Average Display: Shows the volume moving average line for reference
Alert System: Built-in alerts for different volume intensity levels (Extra High, High) for both bullish and bearish movements
█ HOW TO USE
The indicator creates a new volume pane. This replaces the need for the based volume plot which can be removed. It also affects the transparency of the price bars based on volume. Both these features can be toggled on and off independently from each other in the setting.
All candles remain coloured according to their direction (green/red by default), with only the transparency changing based on volume intensity. Please note the the price bars will be coloured by the colours set in this indicator even if the price bar ghosting option is switched off.
This indicator is particularly useful for traders who prioritize volume analysis in their decision-making process but prefer a cleaner chart without multiple overlapping indicators.
Breakout Confirmation: Fully opaque candles during breakouts indicate strong volume support
Trend Strength: Series of transparent candles may indicate weakening trend momentum
Support/Resistance Validation: High volume at key levels appears as prominent candles
Volume Divergence: Easy identification when price moves occur on declining volume( increasingly transparent candles)
█ CONCEPTS
The indicator performs statistical analysis on volume data using a dual-period approach:
A default 7-period (adjustable) lookback for calculating the volume moving average
A default 20-period (adjustable) lookback for calculating standard deviation
It then computes a z-score (standard deviations from the mean) for each price bar's volume to determine its statistical significance. Based on configurable thresholds, price bar bodies are rendered with varying levels of transparency:
Extra High Volume (z-score > 2 by default)): Fully opaque candles (0% transparency) (default)
High Volume (z-score > 1.25 by default): 70% opacity (default)
Normal Volume (z-score > 0.5 by default): 40% opacity (default)
Below Normal Volume: 5% opacity(default)
█ ACKNOWLEDGMENT
This indicator is based on previous, no longer publicly available work by user "callstacked". It has been modified and improved. It is published as a public invite-only indicator with his permission.
█ DISCLAIMER
This indicator is provided for information only and should not be used in isolation without considering other factors. You should not take trades using real money based solely on what this indicator says. Any trades you take are entirely at your own risk.

Volume Percentile Supertrend [BackQuant]Volume Percentile Supertrend
A volatility and participation aware Supertrend that automatically widens or tightens its bands based on where current volume sits inside its recent distribution. The goal is simple: fewer whipsaws when activity surges, faster reaction when the tape is quiet.
What it does
Calculates a standard Supertrend framework from an ATR on a volume weighted price source.
Measures current volume against its recent percentile and converts that context into a dynamic ATR multiplier.
Widens bands when volume is unusually high to reduce chop. Tightens bands when volume is unusually low to catch turns earlier.
Paints candles, draws the active Supertrend line and optional bands, and prints clear Long and Short signal markers.
Why volume percentile
Fixed ATR multipliers assume all bars are equal. They are not. When participation spikes, price swings expand and a static band gets sliced.
Percentiles place the current bar inside a recent distribution. If volume is in the top slice, the Supertrend allows more room. If volume is in the bottom slice, it expects smaller noise and tightens.
This keeps the same playbook usable across busy sessions and sleepy ones without constant manual retuning.
How it works
Volume distribution - A rolling window computes the Pth percentile of volume. Above that is flagged as high volume. A lower reference percentile marks quiet bars.
Dynamic multiplier - Start from a Base Multiplier. If bar is high volume, scale it up by a function of volume-to-average and a Sensitivity knob. If bar is low volume, scale it down. Smooth the result with an EMA to avoid jitter.
VWMA source - The price input for bands is a short volume weighted moving average of close. Heavy prints matter more.
ATR envelope - Compute ATR on your length. UpperBasic = VWMA + Multiplier x ATR. LowerBasic = VWMA - Multiplier x ATR.
Trailing logic - The final lines trail price so they only move in a direction that preserves Supertrend behavior. This prevents sudden flips from transient pokes.
Direction and signals - Direction flips when price crosses through the relevant trailing line. SupertrendLong and SupertrendShort mark those flips. The plotted Supertrend is the active trailing side.
Inputs and what they change
Volume Lookback - Window for percentile and average. Larger window = stabler percentile, smaller = snappier.
Volume Percentile Level - Threshold that defines high volume. Example 70 means top 30 percent of recent bars are treated as high activity.
Volume Sensitivity - Gain from volume ratio to the dynamic multiplier. Higher = bands expand more when volume spikes.
VWMA Source Length - Smoothing of the volume weighted price source for the bands.
ATR Length - Standard ATR window. Larger = slower, smaller = quicker.
Base Multiplier - Core band width before volume adjustment. Think of this as your neutral volatility setting.
Multiplier Smoothing - EMA on the dynamic multiplier. Reduces back and forth changes when volume oscillates around the threshold.
Show Supertrend on chart - Toggles the active line.
Show Upper Lower Bands - Draws both sides even when inactive. Good for context.
Paint candles according to Trend - Colors bars by trend direction.
Show Long and Short Signals - Prints 𝕃 and 𝕊 markers at flips.
Colors - Choose your long and short palette.
Reading the plot
Supertrend line - Thick line that hugs price from above in downtrends and from below in uptrends. Its distance breathes with volume.
Bands - Optional upper and lower rails. Useful to see the inactive side and judge how wide the envelope is right now.
Signals - 𝕃 prints when the trend flips long. 𝕊 prints when the trend flips short.
Candle colors - Quick bias read at a glance when painting is enabled.
Typical workflows
Trend following - Use 𝕃 flips to initiate longs and ride while bars remain colored long and price respects the lower trailing line. Mirror for shorts with 𝕊 and the upper trailing line. During high volume phases the line will give more room, which helps stay in the move.
Pullback adds - In an established trend, shallow tags toward the active line after a high volume expansion can be add points. The dynamic envelope adjusts to the session so your add distance is not fixed to a stale volatility regime.
Mean reversion filter - In quiet tape the multiplier contracts and flips come earlier. If you prefer fading, watch for quick toggles around the bands when volume percentile remains low. In high volume, avoid fading into the widened line unless you have other strong reasons.
Notes on behavior
High volume bar: the percentile gate opens, volRatio > 1 powers up the multiplier through the Sensitivity lever, bands widen, fewer false flips.
Low volume bar: multiplier contracts, bands tighten, flips can happen earlier which is useful when you want to catch regime changes in quiet conditions.
Smoothing matters: both the price source (VWMA) and the multiplier are smoothed to keep structure readable while still adapting.
Quick checklist
If you see frequent chop and today feels busy: check that volume is above your percentile. Wider bands are expected. Consider letting the trend prove itself against the expanded line before acting.
If everything feels slow and you want earlier entries: percentile likely marks low volume, so bands tighten and 𝕃 or 𝕊 can appear sooner.
If you want more or fewer flips overall: adjust Base Multiplier first. If you want more reaction specifically tied to volume surges: raise Volume Sensitivity. If the envelope breathes too fast: raise Multiplier Smoothing.
What the signals mean
SupertrendLong - Direction changed from non-long to long. 𝕃 marker prints. The active line switches to support below price.
SupertrendShort - Direction changed from non-short to short. 𝕊 marker prints. The active line switches to resistance above price.
Trend color - Bars painted long or short help validate context for entries and management.
Summary
Volume Percentile Supertrend adapts the classic Supertrend to the day you are trading. Volume percentile sets the mood, sensitivity translates it into dynamic band width, and smoothing keeps it clean. The result is a single plot that aims to stay conservative when the tape is loud and act decisively when it is quiet, without you having to constantly retune settings.

BOCS AdaptiveBOCS Adaptive Strategy - Automated Volatility Breakout System
WHAT THIS STRATEGY DOES:
This is an automated trading strategy that detects consolidation patterns through volatility analysis and executes trades when price breaks out of these channels. Take-profit and stop-loss levels are calculated dynamically using Average True Range (ATR) to adapt to current market volatility. The strategy closes positions partially at the first profit target and exits the remainder at the second target or stop loss.
TECHNICAL METHODOLOGY:
Price Normalization Process:
The strategy begins by normalizing price to create a consistent measurement scale. It calculates the highest high and lowest low over a user-defined lookback period (default 100 bars). The current close price is then normalized using the formula: (close - lowest_low) / (highest_high - lowest_low). This produces values between 0 and 1, allowing volatility analysis to work consistently across different instruments and price levels.
Volatility Detection:
A 14-period standard deviation is applied to the normalized price series. Standard deviation measures how much prices deviate from their average - higher values indicate volatility expansion, lower values indicate consolidation. The strategy uses ta.highestbars() and ta.lowestbars() functions to track when volatility reaches peaks and troughs over the detection length period (default 14 bars).
Channel Formation Logic:
When volatility crosses from a high level to a low level, this signals the beginning of a consolidation phase. The strategy records this moment using ta.crossover(upper, lower) and begins tracking the highest and lowest prices during the consolidation. These become the channel boundaries. The duration between the crossover and current bar must exceed 10 bars minimum to avoid false channels from brief volatility spikes. Channels are drawn using box objects with the recorded high/low boundaries.
Breakout Signal Generation:
Two detection modes are available:
Strong Closes Mode (default): Breakout occurs when the candle body midpoint math.avg(close, open) exceeds the channel boundary. This filters out wick-only breaks.
Any Touch Mode: Breakout occurs when the close price exceeds the boundary.
When price closes above the upper channel boundary, a bullish breakout signal generates. When price closes below the lower boundary, a bearish breakout signal generates. The channel is then removed from the chart.
ATR-Based Risk Management:
The strategy uses request.security() to fetch ATR values from a specified timeframe, which can differ from the chart timeframe. For example, on a 5-minute chart, you can use 1-minute ATR for more responsive calculations. The ATR is calculated using ta.atr(length) with a user-defined period (default 14).
Exit levels are calculated at the moment of breakout:
Long Entry Price = Upper channel boundary
Long TP1 = Entry + (ATR × TP1 Multiplier)
Long TP2 = Entry + (ATR × TP2 Multiplier)
Long SL = Entry - (ATR × SL Multiplier)
For short trades, the calculation inverts:
Short Entry Price = Lower channel boundary
Short TP1 = Entry - (ATR × TP1 Multiplier)
Short TP2 = Entry - (ATR × TP2 Multiplier)
Short SL = Entry + (ATR × SL Multiplier)
Trade Execution Logic:
When a breakout occurs, the strategy checks if trading hours filter is satisfied (if enabled) and if position size equals zero (no existing position). If volume confirmation is enabled, it also verifies that current volume exceeds 1.2 times the 20-period simple moving average.
If all conditions are met:
strategy.entry() opens a position using the user-defined number of contracts
strategy.exit() immediately places a stop loss order
The code monitors price against TP1 and TP2 levels on each bar
When price reaches TP1, strategy.close() closes the specified number of contracts (e.g., if you enter with 3 contracts and set TP1 close to 1, it closes 1 contract). When price reaches TP2, it closes all remaining contracts. If stop loss is hit first, the entire position exits via the strategy.exit() order.
Volume Analysis System:
The strategy uses ta.requestUpAndDownVolume(timeframe) to fetch up volume, down volume, and volume delta from a specified timeframe. Three display modes are available:
Volume Mode: Shows total volume as bars scaled relative to the 20-period average
Comparison Mode: Shows up volume and down volume as separate bars above/below the channel midline
Delta Mode: Shows net volume delta (up volume - down volume) as bars, positive values above midline, negative below
The volume confirmation logic compares breakout bar volume to the 20-period SMA. If volume ÷ average > 1.2, the breakout is classified as "confirmed." When volume confirmation is enabled in settings, only confirmed breakouts generate trades.
INPUT PARAMETERS:
Strategy Settings:
Number of Contracts: Fixed quantity to trade per signal (1-1000)
Require Volume Confirmation: Toggle to only trade signals with volume >120% of average
TP1 Close Contracts: Exact number of contracts to close at first target (1-1000)
Use Trading Hours Filter: Toggle to restrict trading to specified session
Trading Hours: Session input in HHMM-HHMM format (e.g., "0930-1600")
Main Settings:
Normalization Length: Lookback bars for high/low calculation (1-500, default 100)
Box Detection Length: Period for volatility peak/trough detection (1-100, default 14)
Strong Closes Only: Toggle between body midpoint vs close price for breakout detection
Nested Channels: Allow multiple overlapping channels vs single channel at a time
ATR TP/SL Settings:
ATR Timeframe: Source timeframe for ATR calculation (1, 5, 15, 60, etc.)
ATR Length: Smoothing period for ATR (1-100, default 14)
Take Profit 1 Multiplier: Distance from entry as multiple of ATR (0.1-10.0, default 2.0)
Take Profit 2 Multiplier: Distance from entry as multiple of ATR (0.1-10.0, default 3.0)
Stop Loss Multiplier: Distance from entry as multiple of ATR (0.1-10.0, default 1.0)
Enable Take Profit 2: Toggle second profit target on/off
VISUAL INDICATORS:
Channel boxes with semi-transparent fill showing consolidation zones
Green/red colored zones at channel boundaries indicating breakout areas
Volume bars displayed within channels using selected mode
TP/SL lines with labels showing both price level and distance in points
Entry signals marked with up/down triangles at breakout price
Strategy status table showing position, contracts, P&L, ATR values, and volume confirmation status
HOW TO USE:
For 2-Minute Scalping:
Set ATR Timeframe to "1" (1-minute), ATR Length to 12, TP1 Multiplier to 2.0, TP2 Multiplier to 3.0, SL Multiplier to 1.5. Enable volume confirmation and strong closes only. Use trading hours filter to avoid low-volume periods.
For 5-15 Minute Day Trading:
Set ATR Timeframe to match chart or use 5-minute, ATR Length to 14, TP1 Multiplier to 2.0, TP2 Multiplier to 3.5, SL Multiplier to 1.2. Volume confirmation recommended but optional.
For Hourly+ Swing Trading:
Set ATR Timeframe to 15-30 minute, ATR Length to 14-21, TP1 Multiplier to 2.5, TP2 Multiplier to 4.0, SL Multiplier to 1.5. Volume confirmation optional, nested channels can be enabled for multiple setups.
BACKTEST CONSIDERATIONS:
Strategy performs best during trending or volatility expansion phases
Consolidation-heavy or choppy markets produce more false signals
Shorter timeframes require wider stop loss multipliers due to noise
Commission and slippage significantly impact performance on sub-5-minute charts
Volume confirmation generally improves win rate but reduces trade frequency
ATR multipliers should be optimized for specific instrument characteristics
COMPATIBLE MARKETS:
Works on any instrument with price and volume data including forex pairs, stock indices, individual stocks, cryptocurrency, commodities, and futures contracts. Requires TradingView data feed that includes volume for volume confirmation features to function.
KNOWN LIMITATIONS:
Stop losses execute via strategy.exit() and may not fill at exact levels during gaps or extreme volatility
request.security() on lower timeframes requires higher-tier TradingView subscription
False breakouts inherent to breakout strategies cannot be completely eliminated
Performance varies significantly based on market regime (trending vs ranging)
Partial closing logic requires sufficient position size relative to TP1 close contracts setting
RISK DISCLOSURE:
Trading involves substantial risk of loss. Past performance of this or any strategy does not guarantee future results. This strategy is provided for educational purposes and automated backtesting. Thoroughly test on historical data and paper trade before risking real capital. Market conditions change and strategies that worked historically may fail in the future. Use appropriate position sizing and never risk more than you can afford to lose. Consider consulting a licensed financial advisor before making trading decisions.
ACKNOWLEDGMENT & CREDITS:
This strategy is built upon the channel detection methodology created by AlgoAlpha in the "Smart Money Breakout Channels" indicator. Full credit and appreciation to AlgoAlpha for pioneering the normalized volatility approach to identifying consolidation patterns and sharing this innovative technique with the TradingView community. The enhancements added to the original concept include automated trade execution, multi-timeframe ATR-based risk management, partial position closing by contract count, volume confirmation filtering, and real-time position monitoring.

Volume-RSI Colored Bars
The Volume Indicator, used in conjunction with the embedded Relative Strength Index (RSI), is a powerful tool for making informed trading decisions. Let’s break down how this indicator works and how it can assist you in your trading strategy.
Volume Indicator:
The Volume Indicator tracks the volume of trades occurring in a specific timeframe. Volume shows the number of shares or contracts traded, which can reveal the strength of a price move. If price is moving higher with increasing volume, it generally confirms that the move has more strength, indicating the potential for continuation. Conversely, if the price is moving lower with increasing volume, it indicates strong bearish momentum.
Volume Clusters:
In the chart, we can see various volume clusters highlighted in green, red, and grey. The green bars represent high volume, which can signal strong buying pressure. The red bars represent low volume, signaling that selling pressure is low. Grey bars indicate average volume.
High Volume (Green Bars): High buying pressure, indicating that there may be a strong move in the direction of the price.
Low Volume (Red Bars): Potential signal for a weak move, indicating a lack of participation in the current trend.
RSI (Relative Strength Index):
RSI is a momentum oscillator that indicates whether a market is overbought or oversold. The RSI ranges from 0 to 100, with readings above 70 suggesting an overbought market and readings below 30 suggesting an oversold market.
The RSI is also embedded in the indicator to give a better context when combined with volume. It adds an extra layer of analysis to interpret the price action.
How to Use Volume Indicator with RSI:
Confirming Breakouts:
If you see a breakout in price (an upward movement or downward movement) and the volume indicator shows high volume, this confirms the strength of the breakout.
If the RSI also supports the breakout (for example, it is crossing above 50 or above 70 for an uptrend), it further validates the trade.
Identifying Reversals:
When the price is reaching overbought or oversold levels (RSI above 70 or below 30) and there is low volume (red bars), this may indicate a potential reversal.
If the price is oversold and RSI shows values below 30 with increasing volume (green bars), this could signal a potential buying opportunity as a reversal might occur.
Volume Divergence:
If the price is making new highs, but the volume is declining (red bars), it may signal weakness in the trend, despite the RSI indicating strength. This divergence can help traders anticipate a potential reversal or breakout.
Example from the Chart:
Strong Buy Signal: The price is making an upward movement, the volume bars are turning green (indicating strong buying pressure), and RSI is rising above 50.
Bearish Divergence: You may see RSI moving higher, but volume bars are turning red (indicating weak momentum). This could signal that the upward movement lacks strength, suggesting a potential reversal.
By combining these two indicators, the Volume Indicator and the RSI, traders can make more informed decisions on whether the current trend is sustainable, or if a reversal or breakout is likely.
In conclusion, using the Volume Indicator and RSI together allows for:
Identifying high-volume breakouts and reversals
Filtering out weak price movements
Confirming trends with volume and momentum
This combination enhances trading strategies by providing clear signals of market strength or weakness, helping traders optimize their entry and exit points effectively.

Pro Volume By TradeINskiOverview
The Pro Volume By TradeINski indicator is a comprehensive trading tool designed to enhance volume analysis, position sizing, and trend identification. It integrates multiple trading metrics into a single dashboard, helping traders make informed decisions based on volume dynamics, momentum bursts, trend intensity, and risk management.
Key Features
1. Position Size Calculator
Helps traders determine optimal position sizes based on risk parameters:
Capital & Risk Amount: Set account size and risk per trade.
Lot Size Adjustments: Automatically calculates nearest lot size for futures trading.
Stop Loss-Based Quantity: Computes position size based on distance from stop-loss levels (LOD or mid-price).
Standard Stop Losses: Predefined stop-loss levels (1%, 1.25%, 1.5%, 1.75%) for quick risk assessment.
Reverse Pyramiding: Enhances position sizing with adjustable risk multipliers (25%, 50%).
Closing Range & Range Expansion: Measures price strength and volatility expansion.
2. Volume Analysis & Bar Coloring
Default Bar Colors: Green for bullish bars, red for bearish bars.
Dry Volume Detection: Highlights low-volume bars (below 20-period SMA) in gray.
3. Momentum Burst (MB)
Identifies high-momentum moves:
Bullish Momentum: Volume surge + price rise ≥ user-defined threshold (default: 4%).
Bearish Momentum: Volume surge + price drop ≥ user-defined threshold (default: -4%).
4. Trend Intensity (TI)
Measures trend strength using moving averages:
Fast MA (7) vs. Slow MA (65): Highlights strong bullish/bearish trends when deviation exceeds sensitivity threshold (default: 5%).
5. Anticipation (ANTS)
Detects consolidation before potential breakouts:
Price Change Range: Filters minor price fluctuations (default: -0.4% to +0.4%).
Trend Confirmation: Requires TI_65 sensitivity (default: 5%) for validation.
6. Episodic Pivot (EP)
Flags unusually high-volume bars (default: 9M+ volume) as potential trend reversal or continuation signals.
7. Data Metrics Table
Displays key trading metrics:
Trend Intensity (TI): 21-period SMA comparison.
Industry & Sector: Stock classification.
Market Cap & Free Float: Fundamental liquidity metrics.
Volume × Price (VP): Monetary value of traded volume.
Relative Volume (RV): Today’s volume vs. previous day.
Persistent Intensity (PI): Count of consecutive up closes (default: 21-period).
Use Cases for Traders
✅ Day Traders: Identify momentum bursts and high-volume breakouts.
✅ Swing Traders: Use trend intensity and episodic pivots to confirm trends.
✅ Position Traders: Optimize risk with dynamic position sizing.
✅ Risk Managers: Set stop-loss levels and reverse pyramiding for controlled exposure.
Settings & Customization Overview
The Pro Volume By TradeINski indicator is a comprehensive trading tool designed to enhance volume analysis, position sizing, and trend identification. It integrates multiple trading metrics into a single dashboard, helping traders make informed decisions based on volume dynamics, momentum bursts, trend intensity, and risk management.
Key Features
1. Position Size Calculator
Helps traders determine optimal position sizes based on risk parameters:
Capital & Risk Amount: Set account size and risk per trade.
Lot Size Adjustments: Automatically calculates nearest lot size for futures trading.
Stop Loss-Based Quantity: Computes position size based on distance from stop-loss levels (LOD or mid-price).
Standard Stop Losses: Predefined stop-loss levels (1%, 1.25%, 1.5%, 1.75%) for quick risk assessment.
Reverse Pyramiding: Enhances position sizing with adjustable risk multipliers (25%, 50%).
Closing Range & Range Expansion: Measures price strength and volatility expansion.
2. Volume Analysis & Bar Coloring
Default Bar Colors: Green for bullish bars, red for bearish bars.
Dry Volume Detection: Highlights low-volume bars (below 20-period SMA) in gray.
3. Momentum Burst (MB)
Identifies high-momentum moves:
Bullish Momentum: Volume surge + price rise ≥ user-defined threshold (default: 4%).
Bearish Momentum: Volume surge + price drop ≥ user-defined threshold (default: -4%).
4. Trend Intensity (TI)
Measures trend strength using moving averages:
Fast MA (7) vs. Slow MA (65): Highlights strong bullish/bearish trends when deviation exceeds sensitivity threshold (default: 5%).
5. Anticipation (ANTS)
Detects consolidation before potential breakouts:
Price Change Range: Filters minor price fluctuations (default: -0.4% to +0.4%).
Trend Confirmation: Requires TI_65 sensitivity (default: 5%) for validation.
6. Episodic Pivot (EP)
Flags unusually high-volume bars (default: 9M+ volume) as potential trend reversal or continuation signals.
7. Data Metrics Table
Displays key trading metrics:
Trend Intensity (TI): 21-period SMA comparison.
Industry & Sector: Stock classification.
Market Cap & Free Float: Fundamental liquidity metrics.
Volume × Price (VP): Monetary value of traded volume.
Relative Volume (RV): Today’s volume vs. previous day.
Persistent Intensity (PI): Count of consecutive up closes (default: 21-period).
Use Cases for Traders
✅ Day Traders: Identify momentum bursts and high-volume breakouts.
✅ Swing Traders: Use trend intensity and episodic pivots to confirm trends.
✅ Position Traders: Optimize risk with dynamic position sizing.
✅ Risk Managers: Set stop-loss levels and reverse pyramiding for controlled exposure.
Settings & Customization
Trade Direction: Long, Short, or Both (auto-detects based on % change).
Table Positioning: Adjust location (Top/Middle/Bottom, Left/Center/Right).
Color Customization: Modify bar colors, table lines, and background.
Trade Direction: Long, Short, or Both (auto-detects based on % change).
Table Positioning: Adjust location (Top/Middle/Bottom, Left/Center/Right).
Color Customization: Modify bar colors, table lines, and background.

Custom Volume for scalping### **Indicator Summary: Custom Volume with Arrow Highlight**
#### **Purpose:**
This indicator visualizes volume bars in a chart, highlighting specific conditions based on volume trends. It displays arrows above the volume bars to indicate potential bullish or bearish market conditions.
#### **Key Features:**
1. **Volume Bars**:
- The indicator plots volume as columns on the chart.
- Volume bars are colored:
- **White** for bullish volume (when the closing price is higher than the opening price).
- **Blue** for bearish volume (when the closing price is lower than the opening price).
2. **Highlight Conditions**:
- The indicator identifies a sequence of three consecutive volume bars:
- The first two bars must be of the same direction (either both bullish or both bearish).
- The third bar must be of the opposite direction.
- Additionally, the third bar's volume must be greater than the previous bar's volume.
3. **Arrow Indicators**:
- When the highlight conditions are met:
- An **upward arrow** ("▲") is placed above the third volume bar for bullish conditions (when the third bar is bullish).
- A **downward arrow** ("▼") is placed above the third volume bar for bearish conditions (when the third bar is bearish).
- The arrows are colored to match the respective volume bar: white for bullish and blue for bearish.
4. **Adjustable Size**:
- The arrows are sized appropriately to ensure visibility without cluttering the chart.
#### **Use Cases:**
- This indicator can help traders identify potential reversals or continuation patterns based on volume behavior.
- It is particularly useful for traders focusing on volume analysis to confirm market trends and make informed trading decisions.
#### **Customization:**
- Users can modify the conditions and visual attributes according to their preferences, such as changing colors, sizes, and label positions.
### **Conclusion:**
The "Custom Volume with Arrow Highlight" indicator provides a straightforward and effective way to visualize volume trends and identify key market conditions, aiding traders in their decision-making processes. It combines the power of volume analysis with clear visual cues, making it a valuable tool for technical analysis in trading.
If you need any further modifications or details, let me know!

Fractal WavesSummary of the "Fractal Waves" Indicator
The "Fractal Waves" indicator is a multifaceted trading tool designed for TradingView that combines various technical analysis methods to help traders identify potential market trends and trading opportunities. It overlays multiple analyses directly onto price charts, providing a comprehensive visual representation of market dynamics.
Key Features:
Fractal Wave Detection and Visualization:
Purpose: Identifies fractal highs and lows to signal potential trend reversals or continuations.
Functionality: Calculates fractal highs, lows, and midpoints on both the current and an additional user-selected timeframe. Plots lines at these fractal points with color coding to distinguish between bullish and bearish trends. Fills areas between fractal highs and lows with background colors to enhance visual cues. Updates fractal lines dynamically as new fractals are identified. Multiple Time Frame Moving Averages (MTF MA):
Purpose: Provides insight into trend directions across different timeframes.
Functionality: Allows plotting of up to three customizable moving averages from different timeframes on the current chart. Users can select the type of MA (SMA, EMA, DEMA, VWMA, RMA, WMA), length, resolution, and color. Optionally displays labels showing MA details like type, length, and resolution for clarity. Bar Pattern Identification (Inside and Outside Bars):
Purpose: Highlights specific bar patterns that may indicate market indecision or breakout potential.
Functionality: Detects inside bars (where the current bar's range is within the previous bar) and outside bars (where the current bar's range exceeds the previous bar). Colors bars based on whether they are bullish or bearish inside/outside bars using user-defined colors. Utilizes "The Strat" methodology to assign numbers (1 for inside bars, 2 for directional bars, 3 for outside bars) and plots them above the bars. Wicked Wicks Visualization:
Purpose: Highlights significant wicks that may indicate rejection at certain price levels.
Functionality: Identifies long upper wicks (top wicks) and lower wicks (bottom wicks) relative to previous bars. Plots custom candles to emphasize these wicks with specific background and border colors. Aids in recognizing potential reversals or strong buying/selling pressure. Volume Weighted Average Price (VWAP):
Purpose: Helps identify the average trading price weighted by volume, acting as dynamic support or resistance.
Functionality: Calculates and plots the daily VWAP, updating at the start of each session. Changes VWAP line color at session start for visual differentiation. Applicable primarily to intraday charts (60-minute timeframe or lower). Volume and Extreme Volume Reversal (EVR) Analysis:
Purpose: Detects areas of unusually high volume that may precede price reversals.
Functionality: Tracks the highest volume bars of the current and previous day. Plots boxes and lines to highlight extreme volume areas. Changes candle colors for high-volume bars to draw attention. Calculates and plots potential reversal levels based on extreme volume. Rate of Change (ROC) and Average True Range (ATR) Ratio Analysis:
Purpose: Assesses price momentum relative to volatility to predict trend changes.
Functionality: Calculates the ROC and ATR over specified lengths. Computes the ratio of ROC to ATR to gauge momentum. Plots bullish or bearish dots on the chart when ROC-ATR ratio aligns with the fractal trend, indicating potential trend shifts. Provides alerts when a new bullish or bearish trend is detected. Average Volume Weighted Average Price (AVWAP) with Dynamic Lookback Periods:
Purpose: Identifies key price levels based on volume-weighted averages over specific lookback periods.
Functionality: Calculates AVWAPs from the highest and lowest points over dynamic or manual lookback periods. Adjusts lookback periods automatically based on the current chart timeframe or uses user-defined periods. Plots AVWAP lines and fills the area between them, highlighting overlaps which may signify significant support/resistance levels. Fractal Wave Table Across Multiple Timeframes:
Purpose: Provides a quick overview of fractal trends and inside bar patterns across various timeframes.
Functionality: Displays a table at the bottom of the chart showing fractal wave values and inside bar statuses for timeframes from 5 minutes to monthly. Uses color coding to indicate bullish or bearish trends and whether the price is above or below the fractal wave. Indicates inside bars with symbols and colors to quickly identify consolidation periods. Alert Conditions:
Purpose: Keeps traders informed of significant market events without constant monitoring.
Functionality: Triggers alerts for: Bullish or bearish trend changes when the ROC-ATR ratio aligns with the fractal trend. Price crossing above a fractal high or below a fractal low. Formation of new bullish or bearish fractals. EVR-based potential long or short opportunities.
Usage Notes:
Customization: The indicator offers extensive customization options, allowing users to adjust colors, timeframes, calculation periods, and display preferences to suit their trading style. Timeframe Considerations: Some features, like EVR analysis and intraday VWAP, are optimized for intraday timeframes (up to 60 minutes). The indicator adjusts calculations and visualizations based on the current chart's timeframe. Comprehensive Analysis: By combining multiple technical analysis tools—such as fractals, moving averages, volume analysis, and bar patterns—the indicator provides a holistic view of market conditions. Visual Clarity: The use of color coding, labels, and symbols enhances visual interpretation, making it easier for traders to identify patterns and trends at a glance. Alerts and Notifications: Built-in alert conditions help traders stay informed of key market developments, enabling timely decision-making without the need for constant chart monitoring.
Conclusion:
The "Fractal Waves" indicator serves as an advanced analytical tool that synthesizes various technical indicators to support traders in market analysis. By overlaying fractal patterns, moving averages from multiple timeframes, volume analysis, and bar patterns onto price charts, it aids in identifying potential trading opportunities and understanding market dynamics across different timeframes. The combination of visual cues and alert notifications makes it a valuable asset for traders seeking deeper insight into market behavior.