Chebyshev-Gauss RSIThe Chebyshev-Gauss RSI is a variant of the standard Relative Strength Index (RSI) that uses the Chebyshev-Gauss Moving Average (CG-MA) for smoothing gains and losses instead of a traditional Simple or Exponential Moving Average. This results in a more responsive and potentially smoother RSI line.
This version is enhanced with features from the built-in TradingView RSI indicator, including:
A selectable smoothing moving average of the RSI line.
Bollinger Bands based on the smoothing MA.
Automatic divergence detection.
How it works:
It calculates the upward and downward price changes (gains and losses).
It applies the Chebyshev-Gauss Moving Average to smooth these gains and losses over a specified lookback period.
The smoothed values are used to calculate the Relative Strength (RS) and then the final RSI value.
Wyszukaj w skryptach "Relative Strength Index (RSI)"

Uptrick: Z-Trend BandsOverview
Uptrick: Z-Trend Bands is a Pine Script overlay crafted to capture high-probability mean-reversion opportunities. It dynamically plots upper and lower statistical bands around an EMA baseline by converting price deviations into z-scores. Once price moves outside these bands and then reenters, the indicator verifies that momentum is genuinely reversing via an EMA-smoothed RSI slope. Signal memory ensures only one entry per momentum swing, and traders receive clear, real-time feedback through customizable bar-coloring modes, a semi-transparent fill highlighting the statistical zone, concise “Up”/“Down” labels, and a live five-metric scoring table.
Introduction
Markets often oscillate between trending and reverting, and simple thresholds or static envelopes frequently misfire when volatility shifts. Standard deviation quantifies how “wide” recent price moves have been, and a z-score transforms each deviation into a measure of how rare it is relative to its own history. By anchoring these bands to an exponential moving average, the script maintains a fluid statistical envelope that adapts instantly to both calm and turbulent regimes. Meanwhile, the Relative Strength Index (RSI) tracks momentum; smoothing RSI with an EMA and observing its slope filters out erratic spikes, ensuring that only genuine momentum flips—upward for longs and downward for shorts—qualify.
Purpose
This indicator is purpose-built for short-term mean-reversion traders operating on lower–timeframe charts. It reveals when price has strayed into the outer 5 percent of its recent range, signaling an increased likelihood of a bounce back toward fair value. Rather than firing on price alone, it demands that momentum follow suit: the smoothed RSI slope must flip in the opposite direction before any trade marker appears. This dual-filter approach dramatically reduces noise-driven, false setups. Traders then see immediate visual confirmation—bar colors that reflect the latest signal and age over time, clear entry labels, and an always-visible table of metric scores—so they can gauge both the validity and freshness of each signal at a glance.
Originality and Uniqueness
Uptrick: Z-Trend Bands stands apart from typical envelope or oscillator tools in four key ways. First, it employs fully normalized z-score bands, meaning ±2 always captures roughly the top and bottom 5 percent of moves, regardless of volatility regime. Second, it insists on two simultaneous conditions—price reentry into the bands and a confirming RSI slope flip—dramatically reducing whipsaw signals. Third, it uses slope-phase memory to lock out duplicate signals until momentum truly reverses again, enforcing disciplined entries. Finally, it offers four distinct bar-coloring schemes (solid reversal, fading reversal, exceeding bands, and classic heatmap) plus a dynamic scoring table, rather than a single, opaque alert, giving traders deep insight into every layer of analysis.
Why Each Component Was Picked
The EMA baseline was chosen for its blend of responsiveness—weighting recent price heavily—and smoothness, which filters market noise. Z-score deviation bands standardize price extremes relative to their own history, adapting automatically to shifting volatility so that “extreme” always means statistically rare. The RSI, smoothed with an EMA before slope calculation, captures true momentum shifts without the false spikes that raw RSI often produces. Slope-phase memory flags prevent repeated alerts within a single swing, curbing over-trading in choppy conditions. Bar-coloring modes provide flexible visual contexts—whether you prefer to track the latest reversal, see signal age, highlight every breakout, or view a continuous gradient—and the scoring table breaks down all five core checks for complete transparency.
Features
This indicator offers a suite of configurable visual and logical tools designed to make reversal signals both robust and transparent:
Dynamic z-score bands that expand or contract in real time to reflect current volatility regimes, ensuring the outer ±zThreshold levels always represent statistically rare extremes.
A smooth EMA baseline that weights recent price more heavily, serving as a fair-value anchor around which deviations are measured.
EMA-smoothed RSI slope confirmation, which filters out erratic momentum spikes by first smoothing raw RSI and then requiring its bar-to-bar slope to flip before any signal is allowed.
Slope-phase memory logic that locks out duplicate buy or sell markers until the RSI slope crosses back through zero, preventing over-trading during choppy swings.
Four distinct bar-coloring modes—Reversal Solid, Reversal Fade, Exceeding Bands, Classic Heat—plus a “None” option, so traders can choose whether to highlight the latest signal, show signal age, emphasize breakout bars, or view a continuous heat gradient within the bands.
A semi-transparent fill between the EMA and the upper/lower bands that visually frames the statistical zone and makes extremes immediately obvious.
Concise “Up” and “Down” labels that plot exactly when price re-enters a band with confirming momentum, keeping chart clutter to a minimum.
A real-time, five-metric scoring table (z-score, RSI slope, price vs. EMA, trend state, re-entry) that updates every two bars, displaying individual +1/–1/0 scores and an averaged Buy/Sell/Neutral verdict for complete transparency.
Calculations
Compute the fair-value EMA over fairLen bars.
Subtract that EMA from current price each bar to derive the raw deviation.
Over zLen bars, calculate the rolling mean and standard deviation of those deviations.
Convert each deviation into a z-score by subtracting the mean and dividing by the standard deviation.
Plot the upper and lower bands at ±zThreshold × standard deviation around the EMA.
Calculate raw RSI over rsiLen bars, then smooth it with an EMA of length rsiEmaLen.
Derive the RSI slope by taking the difference between the current and previous smoothed RSI.
Detect a potential reentry when price exits one of the bands on the prior bar and re-enters on the current bar.
Require that reentry coincide with an RSI slope flip (positive for a lower-band reentry, negative for an upper-band reentry).
On first valid reentry per momentum swing, fire a buy or sell signal and set a memory flag; reset that flag only when the RSI slope crosses back through zero.
For each bar, assign scores of +1, –1, or 0 for the z-score direction, RSI slope, price vs. EMA, trend-state, and reentry status.
Average those five scores; if the result exceeds +0.1, label “Buy,” if below –0.1, label “Sell,” otherwise “Neutral.”
Update bar colors, the semi-transparent fill, reversal labels, and the scoring table every two bars to reflect the latest calculations.
How It Actually Works
On each new candle, the EMA baseline and band widths update to reflect current volatility. The RSI is smoothed and its slope recalculated. The script then looks back one bar to see if price exited either band and forward to see if it reentered. If that reentry coincides with an appropriate RSI slope flip—and no signal has yet been generated in that swing—a concise label appears. Bar colors refresh according to your selected mode, and the scoring table updates to show which of the five conditions passed or failed, along with the overall verdict. This process repeats seamlessly at each bar, giving traders a continuous feed of disciplined, statistically filtered reversal cues.
Inputs
All parameters are fully user-configurable, allowing you to tailor sensitivity, lookbacks, and visuals to your trading style:
EMA length (fairLen): number of bars for the fair-value EMA; higher values smooth more but lag further behind price.
Z-Score lookback (zLen): window for calculating the mean and standard deviation of price deviations; longer lookbacks reduce noise but respond more slowly to new volatility.
Z-Score threshold (zThreshold): number of standard deviations defining the upper and lower bands; common default is 2.0 for roughly the outer 5 percent of moves.
Source (src): choice of price series (close, hl2, etc.) used for EMA, deviation, and RSI calculations.
RSI length (rsiLen): period for raw RSI calculation; shorter values react faster to momentum changes but can be choppier.
RSI EMA length (rsiEmaLen): period for smoothing raw RSI before taking its slope; higher values filter more noise.
Bar coloring mode (colorMode): select from None, Reversal Solid, Reversal Fade, Exceeding Bands, or Classic Heat to control how bars are shaded in relation to signals and band positions.
Show signals (showSignals): toggle on-chart “Up” and “Down” labels for reversal entries.
Show scoring table (enableTable): toggle the display of the five-metric breakdown table.
Table position (tablePos): choose which corner (Top Left, Top Right, Bottom Left, Bottom Right) hosts the scoring table.
Conclusion
By merging a normalized z-score framework, momentum slope confirmation, disciplined signal memory, flexible visuals, and transparent scoring into one Pine Script overlay, Uptrick: Z-Trend Bands offers a powerful yet intuitive tool for intraday mean-reversion trading. Its adaptability to real-time volatility and multi-layered filter logic deliver clear, high-confidence reversal cues without the clutter or confusion of simpler indicators.
Disclaimer
This indicator is provided solely for educational and informational purposes. It does not constitute financial advice. Trading involves substantial risk and may not be suitable for all investors. Past performance is not indicative of future results. Always conduct your own testing and apply careful risk management before trading live.

Combined EMA Technical AnalysisThis script is written in Pine Script (version 5) for TradingView and creates a comprehensive technical analysis indicator called "Combined EMA Technical Analysis." It overlays multiple technical indicators on a price chart, including Exponential Moving Averages (EMAs), VWAP, MACD, PSAR, RSI, Bollinger Bands, ADX, and external data from the S&P 500 (SPX) and VIX indices. The script also provides visual cues through colors, shapes, and a customizable table to help traders interpret market conditions.
Here’s a breakdown of the script:
---
### **1. Purpose**
- The script combines several popular technical indicators to analyze price trends, momentum, volatility, and market sentiment.
- It uses color coding (green for bullish, red for bearish, gray/white for neutral) and a table to display key information.
---
### **2. Custom Colors**
- Defines custom RGB colors for bullish (`customGreen`), bearish (`customRed`), and neutral (`neutralGray`) signals to enhance visual clarity.
---
### **3. User Inputs**
- **EMA Colors**: Users can customize the colors of five EMAs (8, 20, 9, 21, 50 periods).
- **MACD Settings**: Adjustable short length (12), long length (26), and signal length (9).
- **RSI Settings**: Adjustable length (14).
- **Bollinger Bands Settings**: Length (20), multiplier (2), and proximity threshold (0.1% of band width).
- **ADX Settings**: Adjustable length (14).
- **Table Settings**: Position (e.g., "Bottom Right") and text size (e.g., "Small").
---
### **4. Indicator Calculations**
#### **Exponential Moving Averages (EMAs)**
- Calculates five EMAs: 8, 20, 9, 21, and 50 periods based on the closing price.
- Used to identify short-term and long-term trends.
#### **Volume Weighted Average Price (VWAP)**
- Resets daily and calculates the average price weighted by volume.
- Color-coded: green if price > VWAP (bullish), red if price < VWAP (bearish), white if neutral.
#### **MACD (Moving Average Convergence Divergence)**
- Uses short (12) and long (26) EMAs to compute the MACD line, with a 9-period signal line.
- Displays "Bullish" (green) if MACD > signal, "Bearish" (red) if MACD < signal.
#### **Parabolic SAR (PSAR)**
- Calculated with acceleration factors (start: 0.02, increment: 0.02, max: 0.2).
- Indicates trend direction: green if price > PSAR (bullish), red if price < PSAR (bearish).
#### **Relative Strength Index (RSI)**
- Measures momentum over 14 periods.
- Highlighted in green if > 70 (overbought), red if < 30 (oversold), white otherwise.
#### **Bollinger Bands (BB)**
- Uses a 20-period SMA with a 2-standard-deviation multiplier.
- Color-coded based on price position:
- Green: Above upper band or close to it.
- Red: Below lower band or close to it.
- Gray: Neutral (within bands).
#### **Average Directional Index (ADX)**
- Manually calculates ADX to measure trend strength:
- Strong trend: ADX > 25.
- Very strong trend: ADX > 50.
- Direction: Bullish if +DI > -DI, bearish if -DI > +DI.
#### **EMA Crosses**
- Detects bullish (crossover) and bearish (crossunder) events for:
- EMA 9 vs. EMA 21.
- EMA 8 vs. EMA 20.
- Visualized with green (bullish) or red (bearish) circles.
#### **SPX and VIX Data**
- Fetches daily closing prices for the S&P 500 (SPX) and VIX (volatility index).
- SPX trend: Bullish if EMA 9 > EMA 21, bearish if EMA 9 < EMA 21.
- VIX levels: High (> 25, fear), Low (< 15, stability).
- VIX color: Green if SPX bullish and VIX low, red if SPX bearish and VIX high, white otherwise.
---
### **5. Visual Outputs**
#### **Plots**
- EMAs, VWAP, and PSAR are plotted on the chart with their respective colors.
- EMA crosses are marked with circles (green for bullish, red for bearish).
#### **Table**
- Displays a summary of indicators in a customizable position and size.
- Indicators shown (if enabled):
- EMA 8/20, 9/21, 50: Green dot if bullish, red if bearish.
- VWAP: Green if price > VWAP, red if price < VWAP.
- MACD: Green if bullish, red if bearish.
- MACD Zero: Green if MACD > 0, red if MACD < 0.
- PSAR: Green if price > PSAR, red if price < PSAR.
- ADX: Arrows for very strong trends (↑/↓), dots for weaker trends, colored by direction.
- Bollinger Bands: Arrows (↑/↓) or dots based on price position.
- RSI: Numeric value, colored by overbought/oversold levels.
- VIX: Numeric value, colored based on SPX trend and VIX level.
---
### **6. Alerts**
- Triggers alerts for EMA 8/20 crosses:
- Bullish: "EMA 8/20 Bullish Cross on Candle Close!"
- Bearish: "EMA 8/20 Bearish Cross on Candle Close!"
---
### **7. Key Features**
- **Flexibility**: Users can toggle indicators on/off in the table and adjust parameters.
- **Visual Clarity**: Consistent use of green (bullish), red (bearish), and neutral colors.
- **Comprehensive**: Combines trend, momentum, volatility, and market sentiment indicators.
---
### **How to Use**
1. Add the script to TradingView.
2. Customize inputs (colors, lengths, table position) as needed.
3. Interpret the chart and table:
- Green signals suggest bullish conditions.
- Red signals suggest bearish conditions.
- Neutral signals indicate indecision or consolidation.
4. Set up alerts for EMA crosses to catch trend changes.
This script is ideal for traders who want a multi-indicator dashboard to monitor price action and market conditions efficiently.

LibraryDivergenceV6LibraryDivergenceV6
Enhance your trading strategies with LibraryDivergenceV6, a comprehensive Pine Script library designed to simplify and optimize the detection of bullish and bearish divergences across multiple technical indicators. Whether you're developing your own indicators or seeking to incorporate robust divergence analysis into your trading systems, this library provides the essential tools and functions to accurately identify potential market reversals and continuations.
Overview
LibraryDivergenceV6 offers a suite of functions that detect divergences between price movements and key technical indicators such as the Relative Strength Index (RSI) and On-Balance Volume (OBV). By automating the complex calculations involved in divergence detection, this library enables traders and developers to implement reliable and customizable divergence strategies with ease.
Key Features
Comprehensive Divergence Detection
Bullish Divergence: Identifies instances where the indicator forms higher lows while the price forms lower lows, signaling potential upward reversals.
Bearish Divergence: Detects situations where the indicator creates lower highs while the price forms higher highs, indicating possible downward reversals.
Overbought and Oversold Conditions: Differentiates between standard and strong divergences by considering overbought and oversold levels, enhancing signal reliability.
Multi-Indicator Support
RSI (Relative Strength Index): Analyze momentum-based divergences to spot potential trend reversals.
OBV (On-Balance Volume): Incorporate volume flow into divergence analysis for a more comprehensive market perspective.
Customizable Parameters
Pivot Points Configuration: Adjust the number of bars to the left and right for pivot detection, allowing fine-tuning based on different timeframes and trading styles.
Range Settings: Define minimum and maximum bar ranges to control the sensitivity of divergence detection, reducing false signals.
Noise Cancellation: Enable or disable noise filtering to focus on significant divergences and minimize minor fluctuations.
Flexible Usage
Exported Functions: Easily integrate divergence detection into your custom indicators or trading strategies with exported functions such as DivergenceBull, DivergenceBear, DivergenceBullOversold, and DivergenceBearOverbought.
Occurrence Handling: Specify which occurrence of a divergence to consider (e.g., most recent, previous) for precise analysis.
Optimized Performance
Efficient Calculations: Designed to handle multiple occurrences and pivot points without compromising script performance.
Line Management: Automatically creates and deletes trend lines based on divergence conditions, ensuring a clean and uncluttered chart display.

Gaussian RSI For Loop [TrendX_]The Gaussian RSI For Loop indicator is a sophisticated tool designed for trend-following traders seeking to identify strong uptrends in the market. By integrating a Gaussian and Weighted-MA (GWMA) with the Relative Strength Index (RSI), this indicator employs a loop-based scoring system to provide clear signals for potential trading opportunities. The combination of Gaussian smoothing techniques and overbought/oversold filtering enhances the indicator's ability to capture significant price movements while reducing noise, making it an optimal choice for traders aiming to capitalize on robust upward trends.
💎 KEY FEATURES
Gaussian Weighted Moving Average (GWMA): Smooths price data to reduce noise and enhance responsiveness to significant price changes.
Filtered RSI: Applies the RSI to Gaussian-filtered data, allowing for more accurate momentum readings.
Wavetrend Analysis: Calculates the difference between the Filtered RSI and its short-term moving average, providing additional insights into momentum shifts.
Loop-Based Scoring System: Evaluates the strength and direction of uptrends through a systematic analysis of the Filtered RSI against defined thresholds.
⚙️ USAGES
Identifying Strong Uptrends: Traders can use this indicator to pinpoint periods of strong upward momentum, helping them make informed decisions about entering long positions and its exits.
Trend and Signal Confirmation: The Score confirms Long and Exit signals which traders can see through the Dots on the Gaussian RSI.
🔎 BREAKDOWN
Gaussian-Filtered Data:
The first component of the Gaussian RSI For Loop is the application of a GWMA to the sourced price data. This smoothing technique uses weighted averages based on a Gaussian distribution, which emphasizes more recent prices while diminishing the impact of older prices. This GWMA effectively reduces market noise, allowing traders to focus on significant price movements. By adjusting weights using sigma parameters, traders can fine-tune the sensitivity of the indicator, making it more responsive to genuine market trends while filtering out minor fluctuations that could lead to misleading signals.
Filtered RSI:
Next, the RSI is applied to the Gaussian-filtered data. The RSI measures the speed and change of price movements, providing insights into overbought or oversold conditions. By applying the RSI to smoothed price data, traders obtain a clearer view of momentum without the distortion caused by sudden price spikes or drops. This results in more reliable readings that help identify potential trend reversals or continuations.
Wavetrend Analysis:
The Wavetrend component calculates the difference between the Filtered RSI and its short-term moving average (MA). This difference serves as an additional momentum indicator. When the Filtered RSI is above its short-term MA, it suggests that upward momentum is strengthening; conversely, when it falls below, it indicates weakening momentum. This analysis helps traders confirm whether an uptrend is gaining strength or losing traction.
Loop-Based Scoring System:
Range Analysis: The system evaluates the Filtered RSI by comparing its current value against overbought (OB) and oversold (OS) thresholds over a defined range. This systematic approach ensures that each value within this range contributes to understanding overall trend strength.
Score Calculation: As the loop iterates through values within the defined range, it adjusts a score based on whether the current Filtered RSI and its previous values are higher or lower than established OB and OS levels. This scoring mechanism quantifies trend strength and direction.
Strong Uptrend Trigger: A strong uptrend signal is generated when the score exceeds a predefined Score Threshold (Long). This indicates that bullish momentum is robust enough to warrant entry into long positions.
None Trend: Conversely, if the score falls below the Score Threshold (Short), it suggests that upward momentum has weakened significantly, signaling potential exit points and it can be consolidated or downtrend.
DISCLAIMER
This indicator is not financial advice, it can only help traders make better decisions. There are many factors and uncertainties that can affect the outcome of any endeavor, and no one can guarantee or predict with certainty what will occur. Therefore, one should always exercise caution and judgment when making decisions based on past performance.

RCYC Bullish Bearish Indicator
Summary: The RCYC Bullish Bearish Indicator is a custom trading tool designed to help traders identify potential bullish and bearish conditions in the market using a combination of KDJ and RSI indicators. This indicator uses color-coded candles to visually represent bullish and bearish signals, making it easy to identify trend changes on the chart. The script is particularly useful for traders who prefer visual signals and want to incorporate both trend momentum (KDJ) and relative strength (RSI) in their analysis.
Description:
The RCYC Bullish Bearish Indicator is a unique mashup of the KDJ and RSI indicators, optimized to provide a clear visual representation of market conditions through color-coded candles. This indicator not only identifies the potential trend shifts but also provides alerts for significant crossover points, enhancing a trader's ability to make informed decisions.
How It Works:
KDJ Calculation:
The KDJ is a variation of the Stochastic Oscillator that includes the %J line, which can go beyond the typical 0-100 range of %K and %D.
The KDJ component of this indicator calculates the highest high and lowest low over a specified period (KDJ Length), using these values to derive the %K line.
The %D line is a smoothed version of %K, and the %J line is derived from %K and %D using the formula: J = 3 * %K - 2 * %D.
This indicator focuses on the behavior of the %J line in relation to a mid-point level (50), identifying crossovers and crossunders that signal potential shifts in market sentiment.
RSI Calculation:
The Relative Strength Index (RSI) is a momentum oscillator that measures the speed and change of price movements. It is widely used to identify overbought or oversold conditions.
In this indicator, RSI values are adjusted and plotted to align visually with the KDJ values, providing a complementary momentum analysis.
Crossover Logic and Candle Coloring:
The indicator tracks two main events:
CrossOver50: When the %J line crosses above the 50 level, indicating potential bullish momentum.
CrossUnder50: When the %J line crosses below the 50 level, indicating potential bearish momentum.
Depending on the crossover events, the script changes the color of the candles on the chart:
Red candles on the initial crossover above 50, followed by dark blue candles to maintain bullish sentiment.
Yellow candles on the initial crossover below 50, followed by light blue candles to maintain bearish sentiment.
Alerts:
The indicator includes alert conditions for both bullish and bearish signals:
Red Candle Alert: Notifies the trader when the %J line crosses above 50.
Yellow Candle Alert: Notifies the trader when the %J line crosses below 50.
These alerts allow traders to react promptly to key market signals without continuously monitoring the chart.
Usage and Benefits:
This indicator is designed for traders looking to combine momentum and trend analysis into a single visual tool. It is particularly useful for those trading in trending markets or looking for entry/exit signals based on momentum shifts.
The color-coded candles provide an intuitive way to assess market conditions at a glance, reducing the complexity associated with analyzing multiple indicators separately.
By integrating both KDJ and RSI, the RCYC Bullish Bearish Indicator offers a balanced approach to trend detection and momentum confirmation, making it versatile for various trading styles, including scalping, swing trading, and position trading.
Originality and Usefulness:
While the indicator builds upon the familiar concepts of KDJ and RSI, it uniquely merges them into a cohesive visual tool with distinct crossover-based alerts and candle coloring.
This approach makes the indicator original, as it simplifies the interpretation of complex signals into straightforward visual cues, enhancing the decision-making process for traders who prefer chart-based analysis.

Enhanced Alligator Trend Indicator By Er. Parvez HaleemPurpose: The Enhanced Alligator Trend Indicator aims to identify strong and reliable buy and sell signals on the price chart by combining the Alligator Indicator with trend strength and volume filters. It is specifically designed for use on a 1-minute chart to enhance precision in short-term trading decisions.
Components:
Alligator Indicator:
Jaw Line (Blue): Calculated as a simple moving average (SMA) of the closing price over a specified period (default: 13 bars). Represents the long-term trend.
Teeth Line (Red): Calculated as a simple moving average (SMA) of the closing price over a shorter period (default: 8 bars). Represents the medium-term trend.
Lips Line (Green): Calculated as a simple moving average (SMA) of the closing price over an even shorter period (default: 5 bars). Represents the short-term trend.
Trend Strength Indicator:
Relative Strength Index (RSI): Measures the strength of the current trend, using a default period of 14 bars. RSI values above 50 suggest a bullish trend, while values below 50 suggest a bearish trend.
Volume Filter:
Volume Threshold: Filters signals based on trading volume to ensure they only appear when volume exceeds a specified threshold (default: 100,000). This helps to avoid low-volume noise and enhance signal reliability.
Additional Trend Filters:
Short-Term SMA: A simple moving average with a default period of 20 bars, used to assess short-term trend direction.
Long-Term SMA: A simple moving average with a default period of 50 bars, used to assess long-term trend direction.
SMA Crossover: A bullish crossover occurs when the short-term SMA is above the long-term SMA, and a bearish crossover occurs when the short-term SMA is below the long-term SMA.
Signal Generation:
Buy Signal: Generated when:
The Lips line is above the Teeth line, and the Teeth line is above the Jaw line (indicating a bullish alignment in the Alligator Indicator).
The RSI is above 50 (indicating strong bullish trend strength).
The trading volume exceeds the specified volume threshold (indicating sufficient trading activity).
The short-term SMA is above the long-term SMA (confirming a bullish trend).
Sell Signal: Generated when:
The Lips line is below the Teeth line, and the Teeth line is below the Jaw line (indicating a bearish alignment in the Alligator Indicator).
The RSI is below 50 (indicating strong bearish trend strength).
The trading volume exceeds the specified volume threshold (indicating sufficient trading activity).
The short-term SMA is below the long-term SMA (confirming a bearish trend).
Plotting on Chart:
Alligator Lines: The Jaw, Teeth, and Lips lines are plotted directly on the price chart in blue, red, and green, respectively, to indicate the long-term, medium-term, and short-term trends.
Buy/Sell Signals: Buy signals are plotted below the price bars in green, and sell signals are plotted above the price bars in red. These signals are marked with labels ("BUY" and "SELL") to clearly indicate trading opportunities.
Debugging: RSI and SMA lines are plotted but hidden by default. They can be revealed for verification purposes to ensure the correctness of the indicator’s calculations.
Alerts:
Buy Alert: Triggers when a buy signal condition is met, sending a notification that a buy opportunity has been identified.
Sell Alert: Triggers when a sell signal condition is met, sending a notification that a sell opportunity has been identified.

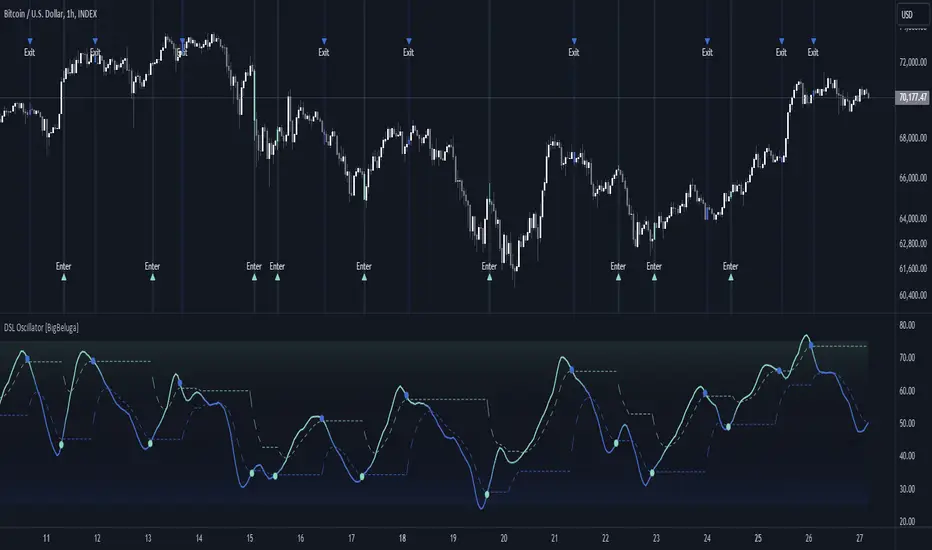
DSL Oscillator [BigBeluga]DSL Oscillator BigBeluga
The DSL (Discontinued Signal Lines) Oscillator is an advanced technical analysis tool that combines elements of the Relative Strength Index (RSI), Discontinued Signal Lines, and Zero-Lag Exponential Moving Average (ZLEMA). This versatile indicator is designed to help traders identify trend direction, momentum, and potential reversal points in the market.
What are Discontinued Signal Lines (DSL)?
Discontinued Signal Lines are an extension of the traditional signal line concept used in many indicators. While a standard signal line compares an indicator's value to its smoothed (slightly lagging) state, DSL takes this idea further by using multiple adaptive lines that respond to the indicator's current value. This approach provides a more nuanced view of the indicator's state and momentum, making it easier to determine trends and desired states of the indicator.
🔵 KEY FEATURES
● Discontinued Signal Lines (DSL)
Uses multiple adaptive lines that respond to the indicator's value
Provides a more nuanced view of the indicator's state and momentum
Helps determine trends and desired states of the indicator more effectively
Available in "Fast" and "Slow" modes for different responsiveness
Acts as dynamic support and resistance levels for the oscillator
● DSL Oscillator
Based on a combination of RSI and Discontinued Signal Lines
// Discontinued Signal Lines
dsl_lines(src, length)=>
UP = 0.
DN = 0.
UP := (src > ta.sma(src, length)) ? nz(UP ) + dsl_mode / length * (src - nz(UP )) : nz(UP )
DN := (src < ta.sma(src, length)) ? nz(DN ) + dsl_mode / length * (src - nz(DN )) : nz(DN )
Smoothed using Zero-Lag Exponential Moving Average for reduced lag
// Zero-Lag Exponential Moving Average function
zlema(src, length) =>
lag = math.floor((length - 1) / 2)
ema_data = 2 * src - src
ema2 = ta.ema(ema_data, length)
ema2
Oscillates between 0 and 100
Color-coded for easy interpretation of market conditions
● Signal Generation
Generates buy signals when the oscillator crosses above the lower DSL line below 50
Generates sell signals when the oscillator crosses below the upper DSL line above 50
Signals are visualized on both the oscillator and the main chart
● Visual Cues
Background color changes on signal occurrences for easy identification
Candles on the main chart are colored based on the latest signal
Oscillator line color changes based on its position relative to the DSL lines
🔵 HOW TO USE
● Trend Identification
Use the color and position of the DSL Oscillator relative to its Discontinued Signal Lines to determine the overall market trend
● Entry Signals
Look for buy signals (green circles) when the oscillator crosses above the lower DSL line
Look for sell signals (blue circles) when the oscillator crosses below the upper DSL line
Confirm signals with the triangles on the main chart and background color changes
● Exit Signals
Consider exiting long positions on exit signals and short positions on Entery signals
Watch for the oscillator crossing back between the DSL lines as a potential early exit signal
● Momentum Analysis
Strong momentum is indicated when the oscillator moves rapidly towards extremes and away from the DSL lines
Weakening momentum can be spotted when the oscillator struggles to reach new highs or lows, or starts converging with the DSL lines
The space between the DSL lines can indicate potential momentum strength - wider gaps suggest stronger trends
● Confirmation
Use the DSL lines as dynamic support/resistance levels for the oscillator
Look for convergence between oscillator signals and price action on the main chart
Combine signals with other technical indicators or chart patterns for stronger confirmation
🔵 CUSTOMIZATION
The DSL Oscillator offers several customization options:
Adjust the main calculation length for the DSL lines
Choose between "Fast" and "Slow" modes for the DSL lines calculation
By fine-tuning these settings, traders can adapt the DSL Oscillator to various market conditions and personal trading strategies.
The DSL Oscillator provides a multi-faceted approach to market analysis, combining trend identification, momentum assessment, and signal generation in one comprehensive tool. Its dynamic nature and visual cues make it suitable for both novice and experienced traders across various timeframes and markets. The integration of RSI, Discontinued Signal Lines, and ZLEMA offers traders a sophisticated yet intuitive tool to inform their trading decisions.
The use of Discontinued Signal Lines sets this oscillator apart from traditional indicators by providing a more adaptive and nuanced view of market conditions. This can potentially lead to more accurate trend identification and signal generation, especially in markets with varying volatility.
Traders can use the DSL Oscillator to identify trends, spot potential reversals, and gauge market momentum. The combination of the oscillator, dynamic signal lines, and clear visual signals provides a holistic view of market conditions. As with all technical indicators, it's recommended to use the DSL Oscillator in conjunction with other forms of analysis and within the context of a well-defined trading strategy.
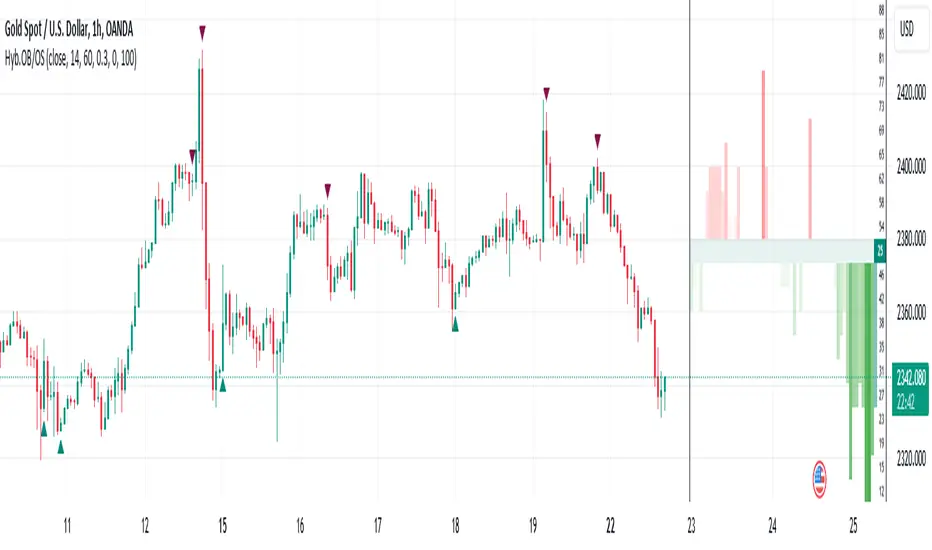
Hybrid Overbought/Oversold OverlayIntroduction
This is a new representation of my well-known oscillator Hybrid Overbought/Oversold Detector overlaid on the chart. The script utilizes the following 12 different oscillators to bring forth a new indicator which I call it Hybrid OB/OS .
Utilized Oscillators
The utilized oscillators here are:
Bollinger Bands %B
Chaikin Money Flow (CMF)
Chande Momentum Oscillator (CMO)
Commodity Channel Index (CCI)
Disparity Index (DIX)
Keltner Channel %K
Money Flow Index (MFI)
Rate Of Change (ROC)
Relative Strength Index (RSI)
Relative Vigor Index (RVI/RVGI)
Stochastic
Twiggs Money Flow (TMF)
The challenging part of utilizing mentioned oscillators was that some of their formulas range are not similar and some of them does not have a mathematical range at all. So I used a normalization function to normalize all their output values to (0, 100) interval.
Overbought/Oversold Levels Calculation
I noticed that the levels which considered as OB/OS level by various traders for each of the utilized oscillators are so different, e.g., many traders consider 30 as OS level and 70 as OB level for RSI and some others take 20 and 80 as the levels, or some traders consider 20 and 80 as OS/OB levels for Stochastic oscillator. Also these levels could be different on different assets, e.g., OB/OS levels for CCI on EURUSD chart might be 80 and 20 while the levels on BTCUSDT chart might be 75 and 25, and so on.
So I decided to make a routine to automate the calculation of these levels using historical data. By this feature, my indicator would calculate the corresponding levels for the oscillators on current chart and then decide about the overbought/oversold situation of each one, which leads to a more accurate Hybrid OB/OS indication.
As the result, if all 12 individual oscillators say it's overbought/oversold, the Hybrid OB/OS shows 100% overbought/oversold, vice versa, if none of them say it's overbought/oversold, the Hybrid OB/OS shows 0, and so on.
The Overlaying Oscillator Problem!
A programming-related challenge here was that Pine Script assigns two separate spaces to the oscillators and the overlaid indicators, and the programmers are limited to use just one of them in each of their codes.
Knowing this, I was forced to simulate the oscillator space on the chart and display my oscillator as a diagram somehow. Of course it won't be as nice as the oscillator itself, because the relation between the main chart bars and the oscillator bars could not be obtained, but it's better than nothing!
Settings and Usage
The indicator settings contain some options about the calculations, the diagram display and the signals appearance. By default they are fine, but you could change them as you prefer.
This indicator is better to be used alongside other indicators as a confirmation (specially in counter-trend strategies I believe). Also it generates an external signal which you could use it in your own designed indicators as well.
Feel free to test it and also the former form of the Hybrid OB/OS . Good Luck!
CAPACE MARKETThis custom indicator combines the Moving Average Convergence Divergence (MACD) and the Relative Strength Index (RSI) into a single trading tool. It calculates the MACD and RSI values, then averages these two indicators to create a composite line. This average line is intended to capture the momentum and relative strength of the market simultaneously, potentially offering a more nuanced view of market conditions.
Key features of the indicator include:
Visualization of MACD and RSI Lines: It plots the MACD and RSI values as separate lines on the chart, allowing traders to see the behavior of each indicator clearly.
Average Line: A line representing the average of the MACD and RSI indicators is plotted, providing a synthesized view of both momentum and strength.
Entry Points Indication: The indicator uses red dots to mark the points where the average line crosses over or under the MACD or RSI lines. These intersections are meant to signal potential entry points for traders.
Market Condition Highlighting: The background color changes based on whether the average line is above or below zero. A green background suggests a positive market condition (bullish), while a red background indicates a negative market condition (bearish).
This tool aims to offer traders an integrated perspective by combining the insights of both MACD and RSI, potentially aiding in the identification of entry and exit points as well as the overall market sentiment.

Kashif_MFI+RSI+BBMerging Money Flow Index (MFI), Relative Strength Index (RSI), and Bollinger Bands in TradingView can offer traders a comprehensive view of market conditions, providing insights into potential price reversals, overbought or oversold conditions, and potential trend changes. Here are some benefits of combining these indicators:
Confirmation of Overbought and Oversold Conditions:
MFI and RSI are both oscillators that measure overbought and oversold conditions. When MFI and RSI readings are high (above their respective overbought levels), and the price is near or above the upper Bollinger Band, it may suggest that the asset is overextended and a reversal could be imminent. Conversely, when MFI and RSI readings are low (below their respective oversold levels) and the price is near or below the lower Bollinger Band, it may indicate potential buying opportunities.
Divergence Analysis:
Traders often look for divergences between price action and MFI/RSI. If the price is making new highs, but MFI/RSI is not confirming these highs (bearish divergence), it could signal weakening momentum and a possible reversal. Combining this analysis with Bollinger Bands can add another layer of confirmation, especially if the price is touching or exceeding the upper Bollinger Band during this divergence.
Volatility Confirmation:
Bollinger Bands provide a measure of volatility by expanding and contracting based on price volatility. If the bands are widening, it indicates increased volatility. Combining this information with MFI and RSI readings can help traders assess the strength of a trend. For example, during a strong uptrend, if MFI and RSI are high and Bollinger Bands are expanding, it may suggest a sustained bullish trend.
Identifying Trend Reversals:
The combination of MFI, RSI, and Bollinger Bands can be useful in identifying potential trend reversals. For instance, if MFI and RSI are in overbought conditions and the price is significantly above the upper Bollinger Band, it may signal that the trend is reaching an extreme and could reverse. Conversely, if MFI and RSI are in oversold conditions and the price is near or below the lower Bollinger Band, it may suggest that selling pressure is exhausted, and a reversal might be in play.
Comprehensive Market Assessment:
By merging these indicators, traders get a more comprehensive view of market conditions. They can assess both momentum (MFI and RSI) and volatility (Bollinger Bands) simultaneously, helping them make more informed trading decisions.
It's important to note that no single indicator or combination of indicators guarantees accurate predictions in trading. Traders should use these tools as part of a broader analysis and consider other factors such as fundamental analysis, market trends, and risk management.

Oscillator Volume Profile [Trendoscope®]The Oscillator Volume Profile indicator is designed to construct a volume profile based on predefined oscillator levels. It integrates volume data with oscillator readings to offer a unique perspective on market dynamics.
🎲 Selectable Oscillators:
Users can select from an array of oscillator options for the basis of the volume profile, including:
Relative Strength Index (RSI)
Chande Momentum Oscillator (CMO)
Center of Gravity (COG)
Money Flow Index (MFI)
Rate of Change (ROC)
Commodity Channel Index (CCI)
Stochastic Oscillator (Stoch)
True Strength Index (TSI)
Williams %R (WPR)
The length parameters - Length, Fast Length, Slow Length allows users to define the period over which the chosen oscillator is calculated, tailoring the sensitivity of the indicator to their trading strategy.
🎲 Dynamic Overbought/Oversold Ranges:
This indicator enhances traditional concepts by introducing dynamic overbought and oversold levels. These adaptable thresholds are calculated using various methods, including:
🎯 Highest/Lowest Range Method : This method establishes the range based on the highest and lowest values of the oscillator within the last N bars.
🎯 Moving Average Range Method : The range is derived from a moving average of the oscillator, providing a smoothed threshold that reflects more recent market conditions.
In addition to these methods, the indicator incorporates a unique 'Sticky Border' feature:
🎯 Sticky Border: With this option enabled, the dynamic ranges maintain their levels until the oscillator breaks out of the range. Once a breakout occurs, the levels are recalculated and updated. This mechanism ensures that the borders remain consistent and relevant, only adjusting to significant market movements that warrant a recalculation.
Users can select their preferred method for determining dynamic ranges, allowing for a customized approach that aligns with their analysis and trading strategy. The sticky border feature further refines this functionality, offering continuity until a decisive market move occurs.
🎲 Volume Profile Calculation Parameters:
🎯 Trend Filter: The indicator provides a versatile trend filter with four selectable options:
Uptrend: The volume profile is calculated when the oscillator indicates an uptrend.
Downtrend: The volume profile is calculated when the oscillator indicates a downtrend.
Any: The volume profile is calculated regardless of the trend.
External: Users can input values from an external indicator. The volume profile is then calculated only when the external indicator's value is non-zero, integrating external analysis into the volume profile construction.
🎯 Precision: Users have the option to define the precision for calculating the volume profile, which is crucial due to the varying scales of different oscillators (e.g., some oscillators range from 0 to 100, while others from -1 to 1). Selecting an appropriate precision ensures that the volume profile is accurately aligned with the minimal price range significant to the chosen oscillator. This setting requires user intervention for optimal configuration, as automatic calculation is not feasible due to the diverse nature of oscillator ranges.
🎯 Number of Bars: Users can select a specific number of bars for volume profile calculation, or opt to include all available historical bars for a comprehensive profile.
🎲 Selecting the right precision:
Users must select the right precision based on their choice of indicator. For example, RSI values range from 0-100. Hence, the default precision of 1 work fine on RSI as the volume profiles are plotted from 0 to 100 at the interval of 0.1
But, the default precision of 1 will not be ok on TSI because TSI values range from -1 to 1. Hence, using 1 as precision will result in very less volume profile lines as shown below.
Due to this, it is necessary to increase the precision for oscillators such as TSI where the range between highest and lowest value is far less. Once we set the precision to 2, we can see more appropriate volume profile division.
🎲 Note of thanks:
This publication uses polyline feature for drawing volume profiles. The advantage of using polyline is that we can overcome max 500 lines issue that we face by using the regular line objects. More details of polyline can be found in the tradingview blog post
Further, using polyline for display of volume profiles is inspired by the publications of fikira and KioseffTrading

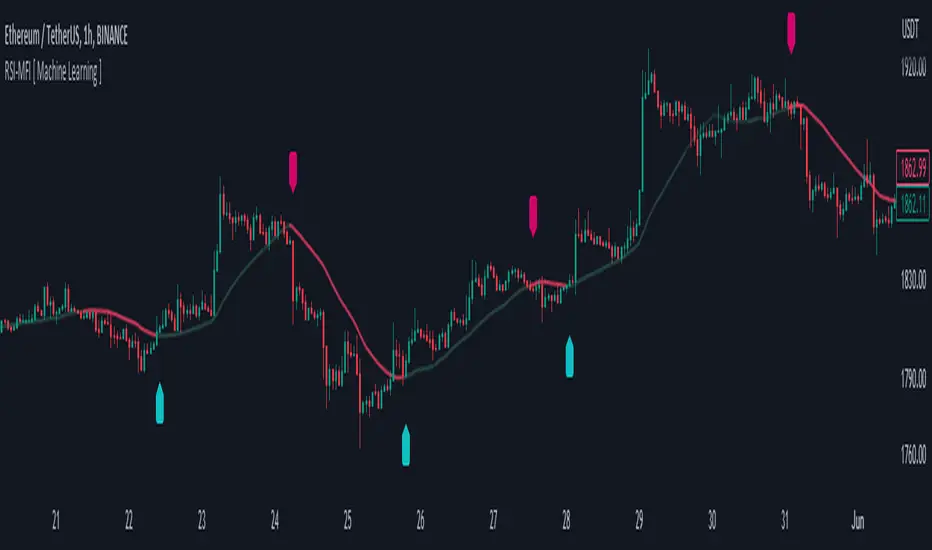
RSI-MFI Machine Learning [ Manhattan distance ]The RSI-MFI Machine Learning Indicator is a technical analysis tool that combines the Relative Strength Index (RSI) and Money Flow Index (MFI) indicators with the Manhattan distance metric.
It aims to provide insights into potential trade setups by leveraging machine learning principles and calculating distances between current and historical data points.
The indicator starts by calculating the RSI and MFI values based on the specified periods for each indicator.
The RSI measures the strength and speed of price movements, while the MFI evaluates the inflow and outflow of money in the market.
By combining these two indicators, the indicator captures both price momentum and money flow dynamics.
To apply machine learning principles , the indicator utilizes the Manhattan distance metric to quantify the similarity or dissimilarity between different data points.
The Manhattan distance is calculated by taking the absolute differences between corresponding RSI and MFI values of the current point and historical points.
Next, the indicator determines the nearest neighbors based on the calculated Manhattan distances.
The number of nearest neighbors is determined by the square root of the specified count of neighbors.
By identifying similar patterns and behaviors in the historical data, the indicator aims to uncover potential trade opportunities.
Trade signals are generated based on the calculated distances. The indicator compares each distance with the maximum distance encountered so far.
If a new maximum distance is found, it updates the value and considers the corresponding direction as a potential trade signal. The trade signals are stored in an array for further analysis.
Furthermore, the indicator considers the price action and a calculated regression line to differentiate between long and short trade signals.
Long trade signals are identified when the closing price is above the regression line, indicating a potentially bullish setup.
Short trade signals are identified when the closing price is below the regression line, indicating a potentially bearish setup.
The RSI-MFI Machine Learning Indicator visualizes the regression line on the price chart and labels the bars accordingly. It highlights the regression line with different colors based on the trade signals, making it easier for traders to identify potential entry or exit points.
Traders can use the RSI-MFI Machine Learning Indicator as a tool to analyze price movements, evaluate market conditions based on RSI and MFI, leverage machine learning concepts to find similar patterns, and make informed trading decisions.
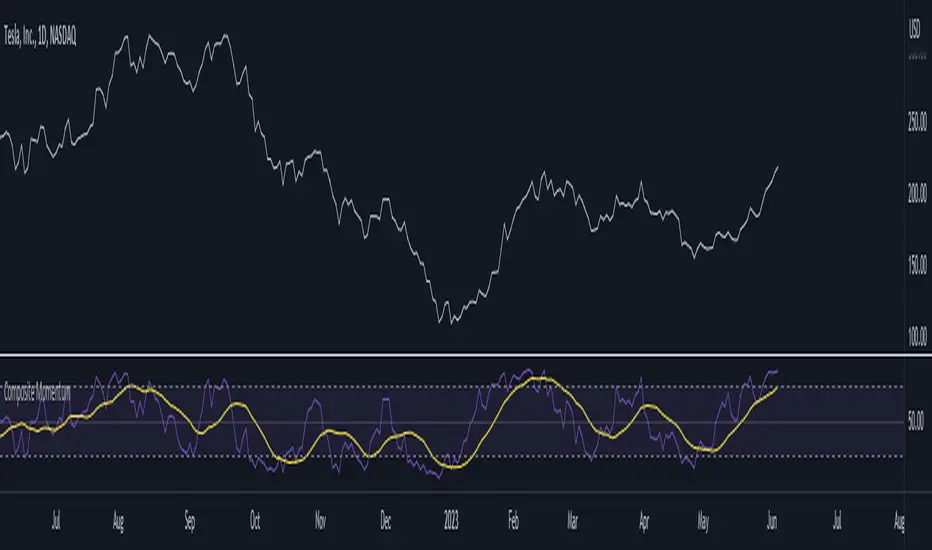
Composite MomentumComposite Momentum Indicator - Enhancing Trading Insights with RSI & Williams %R
The Composite Momentum Indicator is a powerful technical tool that combines the Relative Strength Index (RSI) and Williams %R indicators from TradingView. This unique composite indicator offers enhanced insights into market momentum and provides traders with a comprehensive perspective on price movements. By leveraging the strengths of both RSI and Williams %R, the Composite Momentum Indicator offers distinct advantages over a simple RSI calculation.
1. Comprehensive Momentum Analysis:
The Composite Momentum Indicator integrates the RSI and Williams %R indicators to provide a comprehensive analysis of market momentum. It takes into account both the strength of recent price gains and losses (RSI) and the relationship between the current closing price and the highest-high and lowest-low price range (Williams %R). By combining these two momentum indicators, traders gain a more holistic view of market conditions.
2. Increased Accuracy:
While the RSI is widely used for measuring overbought and oversold conditions, it can sometimes generate false signals in certain market environments. The Composite Momentum Indicator addresses this limitation by incorporating the Williams %R, which focuses on the price range and can offer more accurate signals in volatile market conditions. This combination enhances the accuracy of momentum analysis, allowing traders to make more informed trading decisions.
3. Improved Timing of Reversals:
One of the key advantages of the Composite Momentum Indicator is its ability to provide improved timing for trend reversals. By incorporating both RSI and Williams %R, traders can identify potential turning points more effectively. The Composite Momentum Indicator offers an early warning system for identifying overbought and oversold conditions and potential trend shifts, helping traders seize opportunities with better timing.
4. Enhanced Divergence Analysis:
Divergence analysis is a popular technique among traders, and the Composite Momentum Indicator strengthens this analysis further. By comparing the RSI and Williams %R within the composite calculation, traders can identify divergences between the two indicators more easily. Divergence between the RSI and Williams %R can signal potential trend reversals or the weakening of an existing trend, providing valuable insights for traders.
5. Customizable Moving Average:
The Composite Momentum Indicator also features a customizable moving average (MA), allowing traders to further fine-tune their analysis. By incorporating the MA, traders can smooth out the composite momentum line and identify longer-term trends. This additional layer of customization enhances the versatility of the indicator, catering to various trading styles and timeframes.
The Composite Momentum Indicator, developed using the popular TradingView indicators RSI and Williams %R, offers a powerful tool for comprehensive momentum analysis. By combining the strengths of both indicators, traders can gain deeper insights into market conditions, improve accuracy, enhance timing for reversals, and leverage divergence analysis. With the added customization of the moving average, the Composite Momentum Indicator provides traders with a versatile and effective tool to make more informed trading decisions.
Bollinger Band Alert with RSI Filter IndicatorThis code is for a technical analysis indicator called Bollinger Band Alert with RSI Filter. It uses two tools: Bollinger Bands and Relative Strength Index (RSI) to identify potential trading signals in the market.
Bollinger Bands are lines plotted two standard deviations away from a simple moving average of the price of a stock or asset. They help traders determine whether prices are high or low on a relative basis.
The RSI is a momentum indicator that measures the strength of recent price changes to evaluate whether an asset is overbought or oversold.
The code has some input parameters that a user can change, such as length and multiplier, which are used to calculate the Bollinger Bands, and upper and lower RSI levels to define the overbought and oversold zones.
The code then uses if statements to generate alerts if certain conditions are met. The alert condition is triggered if the close price of an asset crosses above or below the upper or lower Bollinger Bands, and if the RSI is either above or below the overbought or oversold threshold levels.
Finally, the code generates plots to visualize the Bollinger Bands and displays triangles above or below the bars indicating when to enter a long or short position based on the strategy's criteria.

RSIOMA with Volume Index ConfirmationThis indicator is called "RSIOMA with Volume Index Confirmation". It is a technical analysis tool that plots buy and sell signals on a chart based on the Relative Strength Index (RSI) and the Negative Volume Index (NVI) and Positive Volume Index (PVI) indicators.
The indicator has the following input parameters:
- RSI Length: determines the number of periods used to calculate the RSI. Default value is 14.
- Overbought Level: determines the RSI level at which a security is considered overbought. Default value is 70.
- Oversold Level: determines the RSI level at which a security is considered oversold. Default value is 30.
- NVI Length: determines the number of periods used to calculate the Negative Volume Index. Default value is 255.
- PVI Length: determines the number of periods used to calculate the Positive Volume Index. Default value is 255.
The indicator calculates the RSI using the RSI Length input parameter and the close price of the security. It also calculates the NVI and PVI by looping through the volume data and the close price data of the security over the specified periods.
The indicator then uses the RSI, NVI, and PVI to determine buy and sell signals. A bearish divergence signal is generated when the RSI from one period ago is greater than the Overbought Level, the current RSI is less than the Overbought Level, and the close price from one period ago is greater than the current close price. A bullish divergence signal is generated when the RSI from one period ago is less than the Oversold Level, the current RSI is greater than the Oversold Level, and the close price from one period ago is less than the current close price. A sell signal is generated when a bearish divergence signal occurs and the current NVI is less than the previous NVI value. A buy signal is generated when a bullish divergence signal occurs and the current PVI is greater than the previous PVI value.
The indicator plots the buy and sell signals on the chart as green and red triangles, respectively. The "overlay=true" parameter in the indicator function indicates that the signals are plotted on top of the security's price chart.

Cutlers RSICutlers' RSI is a variation of the original RSI Developed by Welles Wilder.
This variation uses a simple moving average instead of an exponetial.
Since a simple moving average is used by this variation, a longer length tends to give better results compared to a shorter length.
CALCULATION
Step1: Calculating the Gains and Losses within the chosen period.
Step2: Calculating the simple moving averages of gains and losses.
Step3: Calculating Cutler’s Relative Strength (RS). Calculated using the following:
-> Cutler’s RS = SMA(gains,length) / SMA(losses,length)
Step 4: Calculating the Cutler’s Relative Strength Index (RSI). Calculated used the following:
-> RSI = 100 —
I have added some signals and filtering options with moving averages:
Trend OB/OS: Uptrend after above Overbought Level. Downtrend after below Oversold Level.
OB/OS: When above Overbought, or below oversold
50-Cross: Above 50 line is uptrend, below is downtrend
Direction: Moving up or down
RSI vs MA: RSI above MA is an uptrend, RSI below MA is a downtrend
The signals I added are just some potential ideas, always backtest your own strategies.

MFI + Realtime DivergencesMoney Flow Index (MFI) + Realtime Divergences + Alerts
This version of the MFI indicator adds the following 5 additional features to the stock MFI:
- Optional divergence lines drawn directly onto the oscillator in realtime.
- Configurable alerts to notify you when divergences occur.
- Configurable lookback periods to fine tune the divergences drawn in order to suit different trading styles and timeframes, including the ability to enable automatic adjustment of pivot period per chart timeframe.
- Background colouring option to indicate when the MFI oscillator has crossed above or below its centerline, or optionally when both the MFI has crossed its centerline and an external oscillator, which can be linked via the settings, has also crossed its centerline.
- Alternate timeframe feature allows you to configure the oscillator to use data from a different timeframe than the chart it is loaded on.
This indicator adds additional features onto the standard MFI , whose core calculations remain unchanged. Namely the configurable option to automatically, quickly and clearly draw divergence lines onto the oscillator for you as they occur in realtime. It also has the addition of unique alerts, so you can be notified when divergences occur without spending all day watching the charts. Furthermore, this version of the TSI comes with configurable lookback periods, which can be configured in order to adjust the sensitivity of the divergences, in order to suit shorter or higher timeframe trading approaches.
What is the Money Flow Index ( MFI )?
Investopedia describes the True Strength Indicator as follows:
“The Money Flow Index ( MFI ) is a technical oscillator that uses price and volume data for identifying overbought or oversold signals in an asset. It can also be used to spot divergences which warn of a trend change in price. The oscillator moves between 0 and 100.
Unlike conventional oscillators such as the Relative Strength Index ( RSI ), the Money Flow Index incorporates both price and volume data, as opposed to just price. For this reason, some analysts call MFI the volume-weighted RSI .”
What are divergences?
Divergence is when the price of an asset is moving in the opposite direction of a technical indicator, such as an oscillator, or is moving contrary to other data. Divergence warns that the current price trend may be weakening, and in some cases may lead to the price changing direction.
There are 4 main types of divergence, which are split into 2 categories;
regular divergences and hidden divergences. Regular divergences indicate possible trend reversals, and hidden divergences indicate possible trend continuation.
Regular bullish divergence: An indication of a potential trend reversal, from the current downtrend, to an uptrend.
Regular bearish divergence: An indication of a potential trend reversal, from the current uptrend, to a downtrend.
Hidden bullish divergence: An indication of a potential uptrend continuation.
Hidden bearish divergence: An indication of a potential downtrend continuation.
Setting alerts.
With this indicator you can set alerts to notify you when any/all of the above types of divergences occur, on any chart timeframe you choose.
Configurable pivot periods.
You can adjust the default pivot periods to suit your prefered trading style and timeframe. If you like to trade a shorter time frame, lowering the default lookback values will make the divergences drawn more sensitive to short term price action.
How do traders use divergences in their trading?
A divergence is considered a leading indicator in technical analysis , meaning it has the ability to indicate a potential price move in the short term future.
Hidden bullish and hidden bearish divergences, which indicate a potential continuation of the current trend are sometimes considered a good place for traders to begin, since trend continuation occurs more frequently than reversals, or trend changes.
When trading regular bullish divergences and regular bearish divergences, which are indications of a trend reversal, the probability of it doing so may increase when these occur at a strong support or resistance level . A common mistake new traders make is to get into a regular divergence trade too early, assuming it will immediately reverse, but these can continue to form for some time before the trend eventually changes, by using forms of support or resistance as an added confluence, such as when price reaches a moving average, the success rate when trading these patterns may increase.
Typically, traders will manually draw lines across the swing highs and swing lows of both the price chart and the oscillator to see whether they appear to present a divergence, this indicator will draw them for you, quickly and clearly, and can notify you when they occur.
Disclaimer: This script includes code from the stock MFI by Tradingview as well as the Divergence for Many Indicators v4 by LonesomeTheBlue.

STD Aadaptive, floating RSX Dynamic Momentum Index [Loxx]STD Aadaptive, floating RSX Dynamic Momentum Index is an attempt to improve Chande's original work on Dynamic Momentum Index. The full name of this indicator is "Standard-Deviation-Adaptive, floating-level, Dynamic Momentum Index on Jurik's RSX".
What Is Dynamic Momentum Index?
The dynamic momentum index is used in technical analysis to determine if a security is overbought or oversold. This indicator, developed by Tushar Chande and Stanley Kroll, is very similar to the relative strength index (RSI). The main difference between the two is that the RSI uses a fixed number of time periods (usually 14), while the dynamic momentum index uses different time periods as volatility changes, typically between five and 30.
What is RSX?
RSI is a very popular technical indicator, because it takes into consideration market speed, direction and trend uniformity. However, the its widely criticized drawback is its noisy (jittery) appearance. The Jurk RSX retains all the useful features of RSI, but with one important exception: the noise is gone with no added lag.
Differences
RSX is used instead of RSI for the calculation, producing a much smoother result
Standard deviation is used to adapt the RSX calculation
Floating levels are used instead of fixed levels for OB/OS
Included
-Change bar colors

[jav] HeikinAshized OscillatorsThis script allows to HeikinAshize different commonly used centered oscillators.
It plots them like Heikin Ashi candles. In this way, we can eliminate some of the noise and uncertainty that is inherent to applying only one calculation period to the oscillators.
Applying Heikin Ashi to an oscillator might be advantageous compared to applying it directly to the chart, because you are not altering price readings. The obvious advantage is the clear visualization of the trend directions without noise.
INPUTS
The oscillators included are:
Relative Strength Index (RSI)
Stochastic
Stochastic RSI
Fisher transform
Inverse Fisher Transform of RSI (IFTRSI)
Commodity Channel Index (CCI)
Money Flow Index (MFI)
Chande Momentum Oscillator (CMO)
Momentum (MOM)
True Strength Index (TSI)
Williams' Percent Range (WPR).
Apart from the choice of one of these indicators, only two more inputs are required:
the main (median) period and
the % of variability of this period.
RESULTS
The script calculates 4 evenly spaced periods from that data (period and variability), e.g. for a period of 50 and a variability of 30%, the script calculates oscillator values for 4 different periods evenly spaced around 50, (35, 45, 55, 65) and uses these 4 values to draw the Heikin Ashi candle.
The script also plots the usual upper/lower (overbought/oversold) values, as well as the central line.
CREDITS
The interesting concept of applying Heikin Ashi to an oscillator was recently introduced in Tradingview by @JayRogers . Many thanks for the idea.
For Heikin Ashi calculations, the useful script by @allanster was taken as a reference.
Any improvements, modifications or suggestions are welcome.

Table: Relative Strength Index (Multiple Timeframes) DESCRIPTION
It is the most popular and dependent Indicator, Relative Strength Index (RSI) . Now, I put inside a table to view chart momentum from Multiple timeframes.
This indicator tells different Timeframe (30 minutes, 1 hour, 4 hour, 1 day, 1 week, 1 month) of RSI value within table form.
HOW TO USE
Can consider a Long position when all timeframes go oversold while Short position when all timeframes go overbought. Alarm function is available. It sounds as all timeframes are overbought or oversold.
Modified The source of indicator from ©BeeHolder named "Performance"

Traders Dynamic Index Indicator Alert v0.1 by JustUncleLThis is a trend trading indicator+alert utilising the Traders Dynamic Index (TDI), Price Action Channel (PAC) and Heikin Ashi candles.
About 6months ago I came across the use of TDI in "E.A.S.Y. Method" that I found in forexfactory forums: www.forexfactory.com
and I was able to set up a chart based on the specifications by using Kurbelklaus scripts. However, I found that the alerts were being generated one or two bars too late, so at that time I was not successful using it with Binary Options. A few months later I found a variation of the method in the forecfactory forums which is able to generate the alerts a bit earlier, so this indicator is a modification of that early detection version.
The indicator can optionally use Heikin Ashi candles only for all it's calculation. I would recommend viewing the chart with Heikin Ashi candles, these smooth out the trends and makes trends very clear.
I found that this method it works good with most currency pairs or commodities and with 5min+ timeframe charts. I would suggest expiry of 2 to 6 candles.
ALERT GENERATION:
=================
The TDI (Traders Dynamic Index)
---------------------------------------------
Volatility Band VB(34), color: Blue, buffer: UpZone, DnZone
Relative Strength Index RSI(13)
RSI PRICE LINE (2), color: Green, buffer: mab
RSI TRADE SIGNAL LINE (7), color: Red, buffer: mbb
MARKET BASE LINE MID VB(34), color: Orange, buffer: mid
Indicator SignalLevels:
-------------------------------
RSI_OversoldLevel : 22 (normally: 32)
RSI_OverboughtLevel : 78 (normally: 68)
Alert Conditions:
-----------------------
Strong Buy : yellow
Medium Buy : aqua
Weak Buy : blue
Strong Sell : fuchsia
Medium Sell : purple
Weak Sell : black
Hints on How to use:
----------------------------
- When a Medium or Strong alert is generated and MACD histogram colour matches the direction
of the alert (optional auto filter), then place trade in direction of alert candle and MACD.
- I use the multi-Hull MA's for overall trend direction confirmation.
- Best positions normally occur near the MACD(5,15,1) Histogram crossing the zero line.
- The optional coloured Dots along the bottom of the indicator represent the first alert
of this type that was generated in this sequence.
- It is advisable to trade in the direction of the main trend as indicated the HULL MA red cloud:
if red cloud underneath PAC then BULLISH trend, if red cloud above PAC then BEARISH trend.
- Selecting the HeiKin Ashi candles does affect the MACD and MA caculations, so if you select
normal candles the result chart will change. You can still Optionally select to use Heikin Ashi
for calculations.
- When using the Heikin Ashi candles, a good buy entry is indicated by long top wick and no bottom wick
for bull (green) candles and good sell entry is indicated by long bottom wick and no top wick for
bear (red) candles.
- When the MACD histogram is flat and close to zero line,
this indicates a ranging market, do NOT trade when this occurs.
- When the PAC channel on the main chart is spread apart widely, this is an indication
of extreme volatility and choppy chart, do NOT try to trade during these periods.
A choppy chart is also indicated by Heikin Ashi candles with long wicks on both sides
of the candles.
- You can specify what strength level Alerts are generated (default 2):
Level (1) means only generate Strong Alerts only.
Level (2) means generate Strong and Medium Alerts.
Level (3) means generate Strong, Medium and Weak Alerts.

Relative Volatility Index The RVI is a modified form of the relative strength index (RSI).
The original RSI calculation separates one-day net changes into
positive closes and negative closes, then smoothes the data and
normalizes the ratio on a scale of zero to 100 as the basis for the
formula. The RVI uses the same basic formula but substitutes the
10-day standard deviation of the closing prices for either the up
close or the down close. The goal is to create an indicator that
measures the general direction of volatility. The volatility is
being measured by the 10-days standard deviation of the closing prices.
