Average Directional Index + ΔDI± (Delta)Average Directional Index (ADX) and Difference between DI+ and DI- (ΔDI±), I call it Delta for short.
The idea explained:
ADX is a common indicator for analysing trend strength. Values over 25 usually indicate the symbol is in "trend mode", meaning there is a lot of momentum, upwards or downwards, - while values under 25 suggest it is in "range mode", the price moves sideways, lacking energy. Note that this indicator is not volume-based.
I moved the graph (red) down 25 points; this version shows positive values in "trend mode" (>25), and negative values in "range mode" (<25). The line sits at 0. The underlying code for the ADX is basically identical to the official TradingView built-in version.
Now the exciting part: DI+ and DI- are used to calculate the ADX. They are sometimes included in the ADX indicator chart, I included a version that shows them in the graphic, at the bottom. Traditionally, DI+ (green) crossing DI- (dark red) from below shows the beginning of an upward trend, and therefore a good LONG entry position. However, I noticed that this is usually not the case: this method responds very slowly to the actual price movement. At the point the indicator tells you to enter, the trend is usually already exhausted.
I found a better way to use this data; instead of waiting for both graphs to cross, meaning the difference in their respective values is 0, we look for the greatest possible difference. That is what the purple graph of my indicator shows (ΔDI±). It utilizes the zero-line we already created for the ADX. High positive values declare that the DI+ is much greater than the DI-, and vice versa. Delta is the greek letter used in mathematics for difference, so that is what I call this indicator.
How to use it:
When you look at the graph, low Delta values seem to be good entry points for LONG positions, high Delta values good exits. This is similar to how RSI and CCI work, which is why included them in the chart above (). However, this is only reliable, when the ADX is above 25, or 0 in this version, indicating the symbol is in "trend mode". This is important .
When you look at the examples in the chart, you can confirm that. The marked candles show good entry and exit points, with Delta being notably low/high (±25 seems to be a good threshold, the dashed lines sit at +30/-30), and the ADX above 0 (25). Now, you might have noticed that around mid-december the Delta actually registers the highest value for this symbol in the given time frame, indicating a strong SHORT after a steep climb. But, importantly , the ADX is not in "trend mode" as required for a clear signal, it is in "range mode": the price discovers this new level and takes a few days to get used to it. It does not fall. This shows why only the combination of both Delta and ADX gives desirable results.
I noticed that this seems to work best for 1D and 1H candles; if you find any other time frames or scenarios, let me know!
PLEASE NOTE THAT THIS IS BASED ON PERSONAL, EMPIRICAL OBSERVATIONS. PAST RESULTS DO NOT GUARANTEE SUCCESS IN THE FUTURE. DO NOT TAKE THIS AS INVESTMENT ADVICE!
Thanks to TradingView and robertkowalski for providing the basis on which the code is built. Credit goes to the appropriate developers/owners.
()
Let me know if you make any other observations, or find other ways to use the data!
Wyszukaj w skryptach "N+credit最新动态"

(Custom)Bollingers Bands Fibonacci ratiosThis is a modified Bollinger bands that uses EMA,with ATH to get a main average and then takes Standard Deviations by Fib ratios outwards. It is very useful for Entries and exits. I Typically use it to exit longs or shorts, entries are a bit harder. Generally the price will wick just barely or briefly into the end of one of the bands and then leave, it PINGs it and that is your exit. It is a little hard to predict in real time and set a Take profit at any exact point because it is always moving, but because it constantly adjust it is pretty damn accurate at nailing it. They sorta work at any timeframe, so its up to you, though for Crypto it doesnt do so well above 4hr because it can pump really hard or dump hard and super stretch the bands. Best numbers for the Average are Fib numbers. Stick to using 13, 21, and 34. 34 is my favorite and works best for me, But its up to you. Sometimes its benificial to use 34 on lower timeframes and maybe a smaller number on larger ones IE 21 or 2 or 4hr charts.
Once again it is up to you how to use it. I dont have credit for the original version of it. It is someone else's who I think modified another person's version lol. Ill try and find their name and post a comment though for who I took the original code from.

The Bayesian Q OscillatorFirst of all the biggest thanks to @tista and @KivancOzbilgic for publishing their open source public indicators Bayesian BBSMA + nQQE Oscillator. And a mighty round of applause for @MarkBench for once again being my superhero pinescript guy that puts these awesome combination Ideas and ES stradegies in my head together. Now let me go ahead and explain what we have here.
I am gonna call it the Bayesian Q Oscillator I suppose. The goal of the script is to solve an issue both indicators on their own suffer from. QQE signals are not new and often the problem has always been false signals for them. They are good for scalping but the difference between a quality move and a small to nearly nonexistent move following a signal is not so clear. Kivanc made his normalized version to help reduce this problem by adding colors to his histogram type verision that would essentially represent if price was a trending move or in a ranging structure. As you can see I have kept this Idea but instead opted for lines as the oscillator. two yellow line (default color) is a ranging sideways area and when there is red or green it is trending up or down. I wanted to take this to the next level with combining the Bayesian probability oscillator that tista put together.
The Bayesian indicator is the opposite for its issue as it is a probability indicator that shows which candle or price movement is more likely to come next. Red rising means possibly down move soon and green means up soon. I will not go into the complex details of this indicator but will suggest others take a look at his and others to understand the idea behind them. The point I am driving at is that it show probabilities or likelyhood without the most effecient signal device to match it. This original was line form and now it is background filled colors.
The idea. is that you can potentially get some stronger and more accurate reversal signals with these two paired together. when you see a sell signal or cross with the towering or rising red... maybe it is a good jump potentially. The same for green. At the same time it is a double added filter effect from just having yellow represent it is ranging... but now if you get a buy signal (example) and have yellow lines (example) along wi5h a red rising or mountain color background... it not only is an indication of ranging, but also that there is potentially even a counter move coming based on the probabilities. Also if you get into a good trade and see dual yellow qqe crosses with no color represented by the bayesian background... it is possible it might only be noise.
I have found them to work decently in the 1 hour timframe. Let me know your experience.
I hope everyone takes a look at the originals to understand them. Full credit goes to those guys for this to be here. Let me know how it is working out for you.
Here are the original links.
bayesian
Normalized QQE

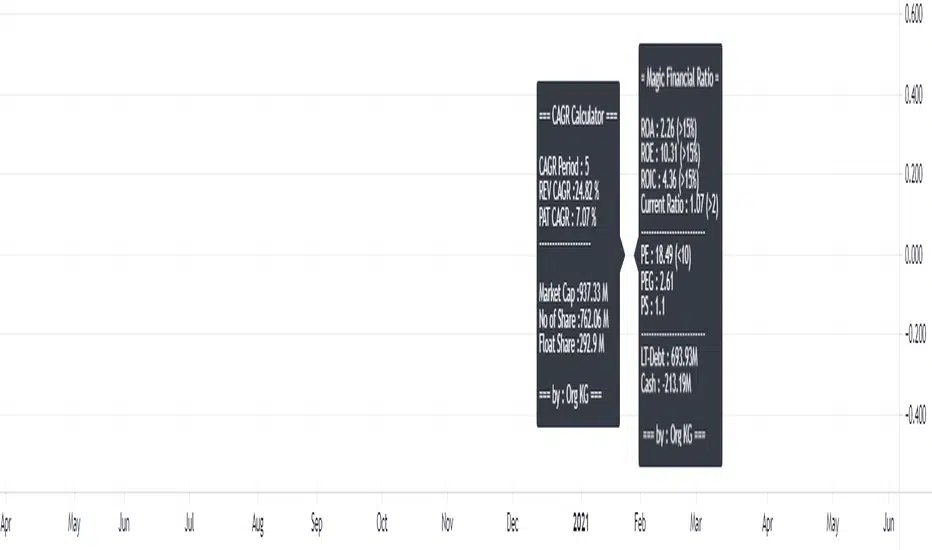
GMB FA ValuationInspired for GMB (Geng Maahad Bursa) for FA Ratio
1st Dashboard
- CAGR Calculator for Revenue and PAT (percentage to measure growth)
credit to fareidzulkifli for his guidance.
- Share issued and market cap highlight
2nd Dashboard to include simple magic financial ratio for invesment
- ROE,ROA, ROIC , Current Ratio
- PE, PEG, PS
- Cash & Long term Debt
Future : to add at least 2 more dashboard.
SNAP BACK 2.0 Strategy
This strategy is designed to allow you to catch the bounce or "SNAP Back" of an equity that has been in a trend.
1) Once the moving averages are in the order of 200SMA > 50 SMA > 34EMA > 20SMA > 8EMA (or reverse for and uptrend), the strategy is setup.
2) Next you wait for a trigger of the closing price crossing the 8EMA, while there is a desired gap size between the 8EMA and the 20SMA (2-10% of stock value preferred).
3) Exit position based on target profit reached (conservative sell half at 34EMA and engage a trailing stop loss for remainder or set static limit) or price crosses 8EMA or stop loss%
*)This code also allows you to determine your desired backtesting date compliments of alanaster
This code is the product of many hours of hard work on the part of the greater tradingview community. The credit goes to everyone in the community who has put code out there for the greater good.
The idea for the coding came from a video I watched on YouTube presented by TradeStation called Snap Back - thank you guys for the inspiration.
UPDATE: I have coded the other side of the strategy to allow you to take advantage of the same set-up in an uptrend for Short plays. You can turn the up or downsides on, off, or both.
The main intent is to catch the bounces of a falling stock. However, I have found that you can do the inverse and catch the drops in a rising stock (the latter is not as reliable). This also tends to work better on less volatile stocks. I have included a large volume of user defined conditions and display entry and exit conditions on the chart to see how your choices are impacting the script.

Analysis of trend and volume dispersion Volume trend and dispersion analysis is a data model; remember that the model is a map, not the earth. The best are the supports and resistances, this is an auxiliary, a thermometer.
The price is modeled with volume and a seasonal adjustment.
It is an effort to use simple and efficient RSI without much noise and with seasonally adjusted values; in addition, it is designed to be used with long-term investments.It is a very simple seasonal adjustment, the price is passed through a Gaussian filter with symmetrical impulse response and compared to its flow during the year.In the example shown with a moving average, the colors show the price versus the seasonal price, that is, if the trend is accelerating or slowing down versus the year.
Comments <- are always welcome
Finally, this "indicator" is subject to terms and conditions if that is not contrary to tradingview policy.
Original By david Ochoa at TradingView Site;
+ It can be distributed, modified or inspired for free including its variants and material for which it has served as inspiration ALWAYS mentioning tradingview and the author ...
+ Can be used without warranty for damages, injury or trauma
+ Can be used for -your personal business- with this exceptions:
+ CanNOT be sold
+ CanNOT be modified or inspired for variants and take credit

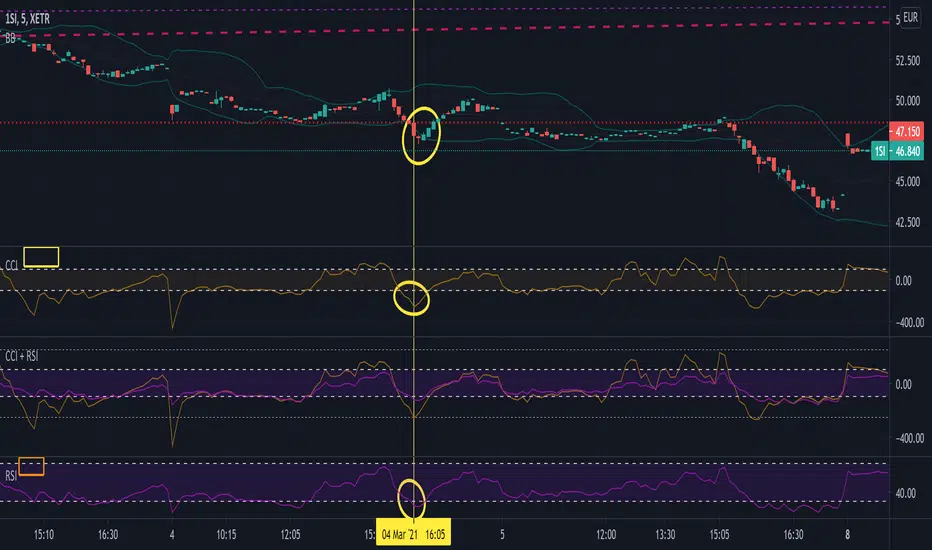
Commodity Channel Index + Relative Strength Index (Same Scale)Mashup, combining (adjusted) RSI and CCI.
These two indicators serve similar functions, but on different scales. I combined the two versions from the TradingView Built-In library into one chart, keeping the default setting for the CCI signal lines and fitting the RSI's default signal lines to them, so that they line up. I therefore adjusted the RSI to match the approximate range of the CCI and added additional lines to represent the maximum and minimum values of the RSI (0 - 100).
I did that by multiplying the RSI with 5, and subtracting 250.
Adjusted RSI = (RSI * 5) - 250
So the upper signal line (default: 70) now matches the line used for the CCI at 100. The lower signal line (default: 30) lines up with -100.
If you want to adjust them, you need to use the formula. I annotated the code if you want to dive deeper.
This indicator uses the original code and styling of the default Built-In RSI and CCI. Credit goes to the appropriate developers. My only intent is to mash up both of these indicators, making it easier to compare them.
Interpreting this indicator is the same as interpreting the underlying indicators. If you find any unexpected correlations, comment.
HR from Prev closeThis is my simple indicator to help identify whether an upside bar is unusual or not. I like to see a bar as particularly unusual like a 15% move in a long period where a typical move is under 5%. It usually signals a buying climax and the end of that short term rally.
I compares the previous bar's close to the current bar's high and is expressed as a percentage.
I am not much of an expert in pine so I did not program it to plot as a histogram but that is how I like to view it. If you know how, by all means, send me the edit and I will credit you.

LR from Prev closeThis is my simple indicator to help identify whether a downside bar is unusual or not. I like to see a bar as particularly unusual like a 15% move in a long period where a typical move is under 5%. It usually signals a selling climax and the end of that short term selloff.
I compares the previous bar's close to the current bar's low and is expressed as a percentage.
I am not much of an expert in pine so I did not program it to plot as a histogram but that is how I like to view it. If you know how, by all means, send me the edit and I will credit you.

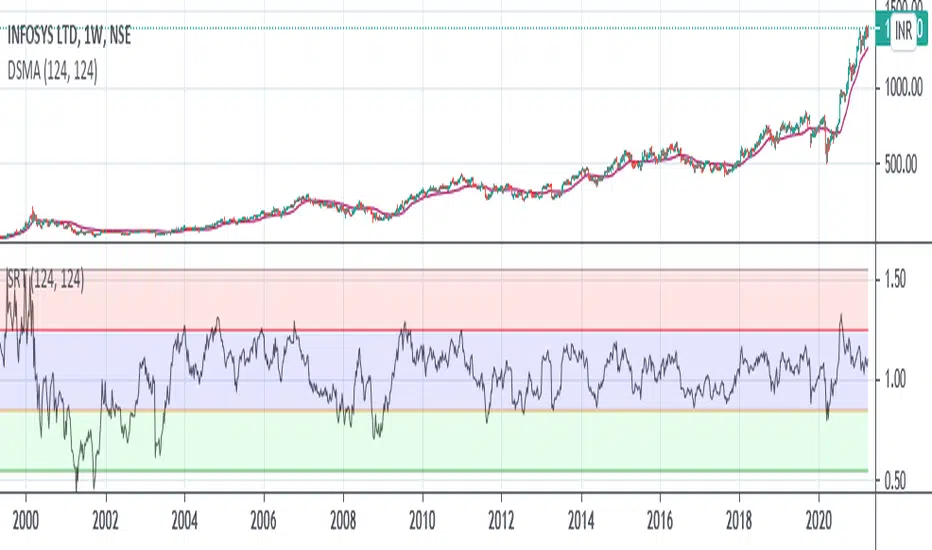
Speculation Ratio TerritorySpeculation Ratio Territory
It is used to find the Index Top or Bottom which will define the buying and selling zone.
It should be checked on a weekly chart.
Example : As Nifty Trades around 248 days in a year.
So, 248/2 = 124
Now Use 124 DSMA on weekly chart.
Suppose Nifty 124 DSMA is @16000 and Current Market Price is 16500, then
SRT = 16500/16000 = 1.031
Top SRT of Nifty = 1.55
Bottom SRT of Nifty = 0.55
One should start investing when SRT value is between 0.55 to 0.75
And exit when SRT value is between 1.30 to 1.55
0.55 to 0.75 --> ENTER (Green Zone)
0.75 to 1.30 --> HOLD (Blue Zone)
1.30 to 1.55 --> EXIT (Red Zone)
Credit for DSMA Script : //Deviation Scaled Moving Average by John Ehlers
BOSCILLATOR. A BOSS OSCILLATORI would like to first say I do not the indicator pieces. Would like to personally give thanks and credit to @MarkBench for coding this indicator and helping to get my vision for this system finally able to be published and used by anyone. I would also like the thank @lazy bear and @ChrisMoody for their bringing the Firefly oscillator and the SCHAFF TREND and the PPO price percentage oscillator to trading view. and @scilentor for his version of Godmode with LSMA . Thanks to @Shizaru for bringing Frama moving average (which we have adopted into the PPO as one of the base selections for the first time, as well as the ALMA ). Divergences have also been added. and components of the firefly have been removed such as the histogram. I have added two oscillators in the picture. The bottom is the standard settings. The above is how I prefer mine to look after tweaking the settings.
Before I get into explaining how its used. I want to say all the indicators are open and none privately owned or at least owned by indivduals who brought them to trading view. Any due permission is granted at my disclocsure. I also want to say this is not your typical mashup of indicators as the is a very clear way to view and use this specifically. Also I want to say original tools from their original scripts are also improved. For example the PPO being used we have added the FRAMA and ALMA moving average basis option which it did not have before. And now everything has clear divergences and some other minor changers. but here are the rules and examples.
THE BOSCILLATOR - A MULTI-LEVEL CONFLUENCE/CONFIRMATION FILTER VISUALIZATION
Some shorthand
(Main oscillator - firefly)
(background wave thing - PPO )
(the red vertical up and down line with red and green dots - STC )
(the blue, yellow and red dots - warning dots)
WHO IS THIS INDICATOR FOR? - This indicator itself is not meant to be a signal giver to buy or sell right now even though it could be and some of the original scripts are used as such. This indicator is actually meant to be a VISUAL CONFIRMATION & FILTER for trades taken in other methods outside of this indicator. What are some of those methods that may benefit from having this? Pivot point traders, FIB traders, Bollinger band traders, Moving average traders.. just to name a few. This indicator itself is meant to in a quick glance allow the trade to see the condition of many different elements outside of the main price and chart, and determine if that trade looks like it has too much risk, or if that trade looks suitable. It also provides a series of confirmations that could be used for adding to a position at different levels at the trade's discretion.
OPTIMAL CONDITIONS FOR CONSIDERING A SHORT = The PPO is orange/red + the STC is at the TOP + the Firefly is above the midline. The warning dots are being printed at the top. There is regular or hidden bearish divergence present.
OPTIMAL CONDITIONS FOR CONSIDERING A LONG = The PPO is light/dark green + the STC is at the BOTTOM + the Firefly is below the midline. The warning dots are being printed at the bottom. There is regular or hidden bullish divergence present.
Triggers for scaling/adding into your position = Keeping in mind that this oscillator on its own is not meant to be the sole reason for taking a trade, here are some triggers you will see for getting into position (preferably with the optimal conditions being met) The firefly flips from a green line into a red slide and vise versa. The firefly crosses the midline up or down. The STC begins going up/down and triggers a green or red dot while crossing one of the levels at 20 or 80. The warning dots being made begin to be printed lower/higher than the dot before last. The PPO shift from one color to the next in the favored direction of the trade you wish to make.
Signs for taking profit and protecting your trade = The Dots begin to print, the PPO changes colors at the top or bottom. the STC arrived are the top.
FILTER SITUATIONS TO AVOID TRADES = Wise to not take a trade if the PPO and the firefly do not agree. For example - if the PPO is showing green yet the firefly is still red may be an indication that it is getting a bit late for you to enter the trade. Same with opposing divergences and warning dots contradicting the trade you are looking at. The STC being already on the bottom or top may be a small indication that trade may already have been a little too ripe, but on its own is not always the case.
When selecting the PPO settings and moving average you are going to want it to be in favor of what you are trying to accomplish.IF you are one low time frames and trying to swing or scalp trade... chances are you want a reactive MA setting that iss responsive. Iwould recommend the HULL, ALMA, TEMA DEMA. For the Higher time frame the EMA or the T3 WDma can be wuite patient and helpful for a constant reminder of caution
Some notes - for the swing and scalp trading... in my experience the PPO moving average basis sees more responsive changes with the FRAMA , ALMA , HULL settings. for entering a trade, at least a couple of your triggers being present increases the success rate by a lot.
This chart illustrates the usefullness of having a Zero lag function for the firefly. The firefly should not be taken for signals or trades itself. However it is the most precise finder of divergences within the system. It is aways good to flip on and off zero lag just to take a quick look for divergences you might have mixed.
In this chart illustrates the general visual look and order of events to guide you along your way. Starts with the PPO turning green or red or orange which is potentially time to get out of your current trade. Then it switched colors when reversal begins and that is when you want to at the same time see the STC, the firefly, and lower caution dots coming in around the same area (highlighted in blue squares). Now near the end you see a red box. This is a filter aspect. The PPO is green, yet the others are saying down/short. This does not mean it must be a long, however it is great warning to maybe avoid getting to bearish for the downside in that time. You want the PPO and line up with the others and it should be visually apparent that they all want to go the same way.
Here is a list of some key elements (before changes this script made) of parts this oscillator includes. My original publication of my oscillation setup was blocked by the mods here.. this one however includes a large variety of items that have been altered from their original formats and a well-explained trading system to use it with.
// Firefly
Firefly Oscillator
// PPO
PPO PercentileRank Mkt Tops & Bottoms (@PuppyTherapy)
// Divergence
Divergence Indicator (any oscillator)
// Godmode
Godmode3.2+LSMA
// Schaff
Schaff Trend Cycle
// Frama
(FRAMA) Fractal Adaptive Moving Average

NSDT Daily Key LevelsSimple script to show key levels of current day and previous day. Labels can be turned on and off as needed. Line colors, thickness and style can be changed. Modified the "M/W/D Level" script from paaax. Credit for original code goes to him. Link to script and profile posted in code of this script.

Volume Spike RSIFollow up to Volume Spike Strategy.
This script calculates volume spikes (e.g. volume is 3 times greater than average volume) and signals them in overbought or oversold areas (RSI).
Credit to “Capitalize AI: Volume Spike Strategy" by Bitcoin Trading Challenge for the original idea.
Tested on XBTUSD 1 minute chart

Intraday Multi timeframe CPRDue to the request of some users and inspired by "Intraday CPR " I updated "CPR for Intraday Trading " and added extra functionality for your convenience.
Intraday CPR levels are changed according to timeframe instead of previous day high, low and close
This indicator you can change timeframe : Week ,Day, 240 min ,180in, 120 min, 60 min
code credit : ThePivotTrader

Range Box (Nephew_Sam_)Version 1
Creates a box around a specified time range with the ability to extend the lines to a later time.
Next update:
- Background in box
- Remove historical boxes
- Extend lines in future instead of only till current price
There's similar but complex indicators out there, I'll leave this code as open source and you have permission to reuse and not credit me.

Historical VolatilityNothing special here, just an open source Historical Volatility, for my own practice more than anything else.
Decided to make it public just because maybe somebody can edit it (as the TV standard one's source code is locked) and put in adaptive lengths or whatever else they want to do.
Just leave me a credit if you use it somehow.
Cheers.

TMO with TTM SqueezeApplication of the TTM squeeze and the short-term momentum TTM Wave A in action. This is an example where the short-term wave will react faster than the TTM to give you a signal to start building your positions.
This indicator needs to be combined with "TTM Wave A" (add to existing pane).
The TTM Squeeze works like a better MACD. There is a zeroline and histogram bars above / below represent positive and negative momo. As the height of the bar decreases when above the zeroline, that is called decreasingly positive momo and as the height of the bar decreases when below the zeroline, that is called decreasingly negative momo. The dots on the TTM Squeeze: Red dots represent consolidation where Bollingers are inside the Keltner Channels and green dots represent a move out of consolidation or "squeeze fire". As price action comes out of consolidation there is a bigger move up/down depending on where momo is heading and where prices are (key support/resistance levels, fib areas). You want to use the TTM Squeeze and A wave TOGETHER - TTM Squeeze is your main momo and your A wave is a short-term momo wave that reacts faster and works as a leading gauge. You need to use them TOGETHER to gauge where price action may be heading. When the TTM Squeeze and A wave move lockstep together, let's say both are decreasingly positive, there is a good probability it continues to move in that direction to the next support levels. TWO bars on the TTM Squeeze of different heights is confirmation that in most cases means it will move in the direction of those bars. So if decreasingly positive, you'll see two darker bars. By the time you get your 2nd bar on the TTM Squeeze, it is often too late or you're losing profit. Way to counter that is after you get one darker bar in the opposite direction of current trend, use A wave to "predict" the next wave, the more A wave histogram bars going towards the other direction, the higher the certainty it will hit. Lastly, using these waves together works best when you look at it on MULTIPLE TIME FRAMES. (Credit for this details goes to Brady from Atlas).

TTM Wave AApplication of the TTM squeeze and the short-term momentum TTM Wave A in action. This is an example where the short-term wave will react faster than the TTM to give you a signal to start building your positions.
This indicator needs to be combined with "TMO with TTM Squeeze" (add to existing pane).
The TTM Squeeze works like a better MACD. There is a zeroline and histogram bars above / below represent positive and negative momo. As the height of the bar decreases when above the zeroline, that is called decreasingly positive momo and as the height of the bar decreases when below the zeroline, that is called decreasingly negative momo. The dots on the TTM Squeeze: Red dots represent consolidation where Bollingers are inside the Keltner Channels and green dots represent a move out of consolidation or "squeeze fire". As price action comes out of consolidation there is a bigger move up/down depending on where momo is heading and where prices are (key support/resistance levels, fib areas). You want to use the TTM Squeeze and A wave TOGETHER - TTM Squeeze is your main momo and your A wave is a short-term momo wave that reacts faster and works as a leading gauge. You need to use them TOGETHER to gauge where price action may be heading. When the TTM Squeeze and A wave move lockstep together, let's say both are decreasingly positive, there is a good probability it continues to move in that direction to the next support levels. TWO bars on the TTM Squeeze of different heights is confirmation that in most cases means it will move in the direction of those bars. So if decreasingly positive, you'll see two darker bars. By the time you get your 2nd bar on the TTM Squeeze, it is often too late or you're losing profit. Way to counter that is after you get one darker bar in the opposite direction of current trend, use A wave to "predict" the next wave, the more A wave histogram bars going towards the other direction, the higher the certainty it will hit. Lastly, using these waves together works best when you look at it on MULTIPLE TIME FRAMES. (Credit for this details goes to Brady from Atlas).

Effective Divergence Indicator
What is EffDI?
Effective Divergence Indicator(EffDI) is a modified Momentum indicator designed to detect divergences in stocks, futures, forex, and crypto, just to name a few.
How does it work?
It uses the EMA of daily velocity.
Isn't this the same as Momentum
No. Momentum compares the price x days ago, while this takes the EMA of the daily velocity.
Why is it better than momentum in detecting divergence?
Because it uses an EMA, an EMA gives weight to the latest prices. I don't know how to explain the logic behind this, but it works :)
ok,ok, I get it, but how do I use it to buy, sell, and get a ton of profits?
Refer to the diagram below.
Steps:
Step 1: Locate the divergence(marked A,B,C and D): no divergence, no trade.
Step 2: Locate the last EffDI high. Mark that E.
Step 3(entry): Buy when price goes above E. For shorts, Short Sell when price goes below E.
Step 4(exit): Exit position when another divergence is detected,
OR
When A new Lower Low is formed.
As you can see, if you follow the steps, there is a good chance the profits will come to you. Cheers!
DO YOU WANT MORE GOOD INDICATORS LIKE THESE TO IMPROVE YOUR TRADING? Then, make sure to follow @Trader_ph (or i will eat all of your cookies)
Feel free to use my code below, BUT make sure to credit me if you make any modifications. :)

Squeeze Momentum StrategyJust turned LazyBears' Squeeze Momentum Indicator into a strategy. You can understand how it works and pay credit to LazyBear here: uk (dot) tradingview (dot) com/v/nqQ1DT5a/
Best results seem to be on the 4h chart. Added LazyBear's Volume Weighted Moving Average indicator, which can be used (select in strategy properties) to more selectively long or short if desired. Defaults to using 100% of your initial strategy equity (just my preference), and this cannot be changed without recoding the strategy, but should be easy to do if desired. Added leverage, trade risk, backdate time window and trade type selector inputs.
Happy trading!
Not financial advice.

Everything RSIThis indicator includes:
RSI Candles set to the default 14 length (un check Borders in the Style tab to see the candlesticks better)
I like using the wicks as an early warning for a possible trend change, which is generally in the opposite direction of the wicks.
It's also easier for me to draw trend lines using the RSI Candles vs the rsi plot line.
40 ema of the RSI Candles
2nd RSI set to the 20 length , which plots just inside the wicks of the RSI Candles. This RSI also highlights Oversold and Overbought levels.
I sometimes leave the RSI Candle Borders checked and use the 20 RSI plot with the wicks of the RSI Candles
Signals to look for Short or Long opportunities , which use the 5 sma of the RSI Candles crossing under the overbought and over the
oversold levels. If you'd like to plot the 5 sma, remove the // at the beginning of the code on line 72.
3nd RSI set to the default 14 length which can be set to a different timeframe as the current chart. Default setting is the 1h.
This RSI plots a + at the top of the indicator when it's above the 50 level and an x at the bottom of the indicator when it's below the 50 level.
For me, this is just a visual aid when I'm scalping on lower timeframes.
If the 1h RSI is above the 50 level, I focus on long scalps. If the 1h RSI is below the 50 level, I focus on short scalps.
RSI Cloud which is formed by filling in the area between the 14 ema of both the 7 RSI and 28 RSI.
I used part of @FnM_Capital 's Trend-Sniper script for my RSI Candles. Thank you! You're extremely talented and deserve all of the credit for your work.
I'd also like to thank @SeanNance for answering all of my random coding questions!!!
I've added the indicator to the example twice to show a couple of the ways I view the RSI's.
The top indicator shows the RSI Candle Borders "un checked" and without the 2nd RSI plot.
The bottom indicator shows RSI Candle Borders "checked", using 2nd RSI plot with the RSI Candle Wicks.

Standard deviation zones Support & Resistance [LM]Hi Guy,
I would like to introduce you Standard deviation zones Support & Resistance horizontals. It draws line horizontals on high and low st dev zone. The colors are dynamic depending whether price is below or above the line.
Credit is due to @Zeiierman for st dev zone calculation so shout out to him.
There are various sections in setting:
general setting where you can select source for zone calculation
tops setting
bottom setting
show and hide section of the first timeframe
show and hide section of the second timeframe
Be aware that when new zone starts and is not finished yet than the top will trail the high of unfinished zone that could be also at the high of current candle and next candle it can change
Any suggestions are welcomed

Mod and Round To Tick FunctionI have not found this function anywhere on Tradingview but it can be very useful in setting orders in a strategy and non-integer boundaries for certain indicator designs. Its a bit underwhelming, but in other languages you can call a mod() function and the output will be the remainder of the integer.
If you want to set an order at a specific tick value, particularly in futures, you can't set it at a specific tick when using calculated values like ATR or Standard Deviation without a function like this.
It can also be used to clean up certain band/envelope style indicators if you want to have a straight line, but don't want to simply round to an integer.
Credit for the round to tick aspect goes to the eternal fountain of resources, the Backtesting & Trading Engine script from @pinecoders
This is just another tool to throw in the box for when you might need it.