RDX ScoreModified TradingView script for @bankniftydoctor's RDX strategy. Original script idea credits to @TheProfessorDev
- I have modified the code to reflect core RDX strategy score, instead of the simplified one
- Every bar (including ones in RSI 45-55) will display its RDX score.
p.s .For the uninitiated, these number generated by this script are used for the RDX strategy devised by @bankniftydoctor. There's an anchored note at the upper right corner, which briefly summarises the RDX score & the positions to be taken accordingly.
Wyszukaj w skryptach "N+credit最新动态"

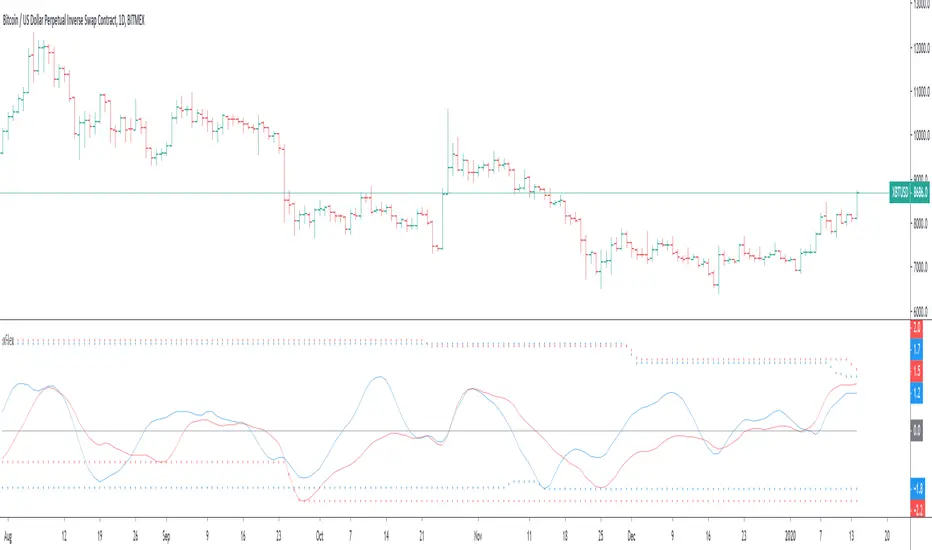
Range identifier by angleThis study tries to highlight ranges
as they are defined by
TradingLatino TradingView user.
A range according to its definition would consist of
periods when the price does not move a lot.
It's aimed at BTCUSDT pair and 4h timeframe.
HOW IT WORKS
Price source is the middle between open and close values.
For each of the bars a '5' periods regression line is calculated
The regression line has an angle with the 0-axis line
which might be between 0 and 90.
0 angle would mean price is always the same
90 angle would mean price going to infinity
When '2' of those periods in a row
have their angles between a maximum angle
and a minimum angle then you have the range
SETTINGS
Price range bar periods : How many previous periods are used to calculate the bar regression line
Price range range periods : How many periods in a row should be used to say that there is a range
Price range maximum angle ( < 90.0 !!! ): Maximum angle for range detection
Price range minimum angle ( > -90.0 !!! ): Mininum angle for range detection
Angles should be set from -89.99 for the minimum angle to +89.99 for the maximum angle
WARNING
Despite the name indicator does not identify the entire range.
It identifies when you realise you are inside a range.
E.g. If a range length is 8 periods length this range indicator
will highlight only the last 6 periods of the range.
USAGE
If your strategy signals you an upwards trend
then you might use this range detector
to know when to exit your long position
Why?
Because most of the times
the price is found to be
in a range it goes down
FEEDBACK 1
I'm quite sure this range approach by comparing angles is a novel one.
I have checked Range Identifier script from TradingView LazyBear user
and it uses another approach.
I'm interested on different approaches on how to detect ranges.
FEEDBACK 2
I have only used this identifier in BTCUSDT 4h timeframe.
I'm interested to know if applying it more traditional
stocks the degrees need to be adjusted to something
more smaller.
PINE SCRIPT TRICK
This script simulates looping an string char by char
in pine script.
CREDITS
I have reused and adapted some code from
'TF Segmented Linear Regression' script
which it's from TradingView alexgrover user.

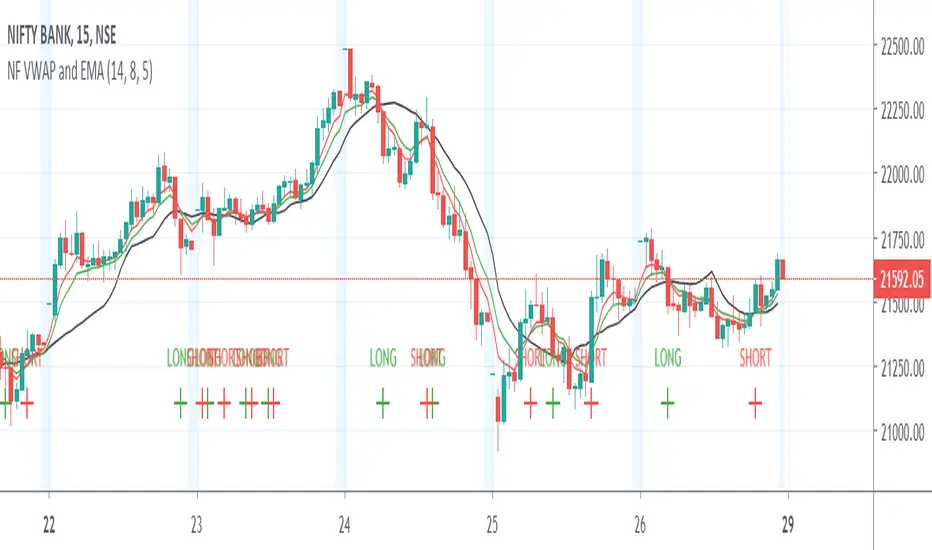
BNF VWAP & MAThe script picks up Bank nifty stocks with their current respective weights and plots a Volume Weighted Average Price ( VWAP ) line along with 2 EMAs of your choice and an alert when the EMAs cross over and also when price crosses VWAP .
You can customize the script for MA type and lengths and to remove alert. Basic utility of the script is to analyse volumes driving the Bank Nifty index.
Credits to @daytraderph and his script (Custom Volume ) who's code I used to build this script. Also thanks to my friend @Varun who helped me code it.

Funamental and financialsEarnings and Quarterly reporting and fundamental data at a glance.
A study of the financial data available by the "financial" functions in pinescript/tradingview
As far as I know, this script is unique. I found very few public examples of scripts using the fundamental data. and none that attempt to make the data available in a useful form
as an indicator / chart data. The only fitting category when publishing would be "trend analysis" We are going to look at the trend of the quarterly reports.
The intent is to create an indicator that instantly show the financial health of a company, and the trends in debt, cash and earnings
Normal settings displays all information on a per share basis, and should be viewed on a Daily chart
Percentage of market valuation can be used to compare fundamentals to current share price.
And actual to show the full numbers for verification with quarterly reporting and debuggging (actual is divided by 1.000.000 to keep numbers readable)
Credits to research study by Alex Orekhov (everget) for the Symbol Info Helper script
without it this would still be an unpublished mess, the use of textboxes allow me to remove many squiggly plot lines of fundamental data
Known problems and annoyances
1. Takes a long time to load. probably the amount of financial calls is the culprit. AFAIK not something i can to anything about in the script.
2. Textboxes crowd each other. dirty fix with hardcoded offsets. perhaps a few label offset options in the settings would do?
3. Only a faint idea of how to put text boxes on every quarter. Need time... (pun intended)
Have fun, and if you make significant improvements on this, please publish, or atleast leave a comment or message so I can consider adding it to this script.
© sjakk 2020-june-08

Nifty Volume profile + VWAP + EMA The script picks up nifty stocks with their current respective weights and plots a Volume Weighted Average Price line along with 2 EMAs and an alert when the EMAs cross over.
You can customize the script for EMA lengths and to remove alert. Basic utility of the script is to analyse volumes driving the Nifty 50 index.
Credits to @daytraderph and his script (Custom Volume) who's code I used to build this script. Also thanks to my friend @Varun who helped me code it.
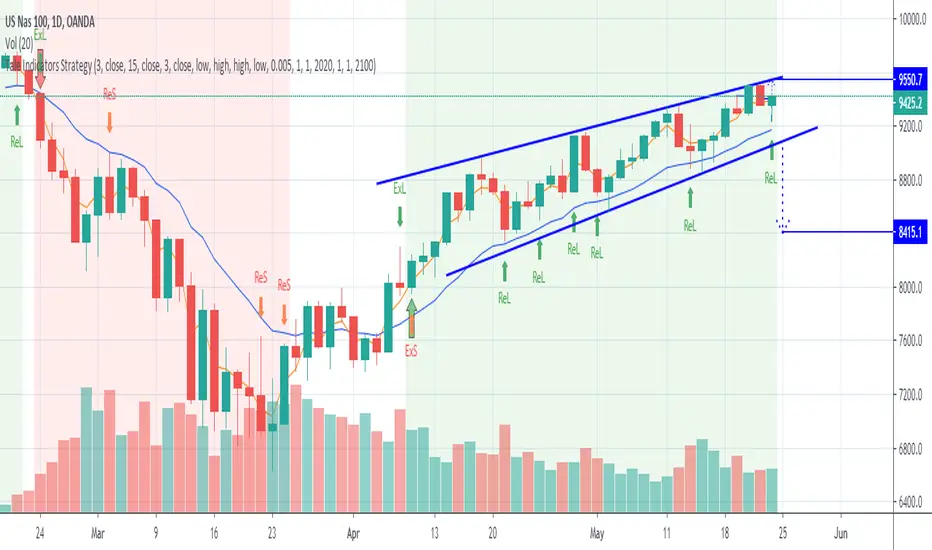
Tale Indicators StrategyThis script provides strategy from @JackBauer007 of the slowMA and fastMA crossovers to determine entry and exit conditions.
The default is set to 3EMA and 15EMA crossovers. With entry and exit for Long positions set to high and for Short positions set to low.
You can enable to run the strategy for a selected time-period to analyse the strategy on your instrument.
Credits to @ECHKAY and @JackBauer007 for their inputs and help
RSI CANDLESTICKSThis indicator display open, high, low, and close data in the form of a candlestick.
Credits to @allanster for the idea from

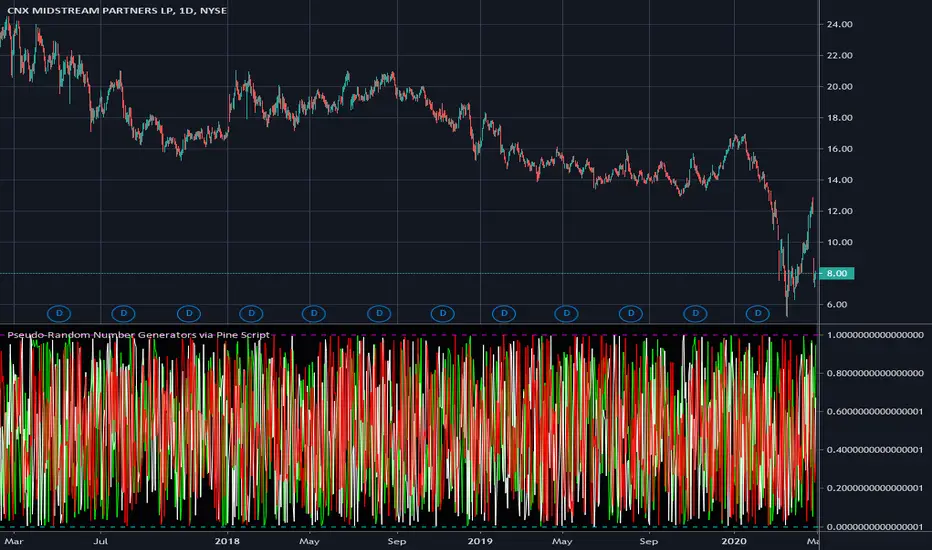
Pseudo-Random Number Generators via Pine ScriptThese are my "Pseudo-Random Number Generators via Pine Script", having uniform distribution between 0 and 1. In my quest for sequential pseudo-random numbers in Pine, tinkering with mathematical chaos, I have come up with these three simple yet handy generators. I believe these may be useful in the future by developers of the Tradingview community.
NOTICE: Use it as you please, this is free code to implement into your new Pine projects. You don't have to ask for my permission to reuse these functions in your published scripts, simply because I have better things to do than answer requests for the reuse of these simplistic PRNG functions. I don't require accreditation for members to reuse these functions either. I simply don't want any credit. I only require that you respectfully put it to "good and proper use" complimenting the elaborate script you have in mind. I would however like to see some great ideas utilizing these when I randomly and accidentally come across them in the public library. I didn't know where to put this script, so I just tossed it into the "Trend Analysis" category.
The comments section below is solely just for commenting and other remarks, ideas, compliments, etc... regarding only this indicator, not others. When available time provides itself, I will consider your inquiries, thoughts, and concepts presented below in the comments section, should you have any questions or comments regarding this indicator. When my indicators achieve more prevalent use by TV members, I may implement more ideas when they present themselves as worthy additions. As always, "Like" it if you simply just like it with a proper thumbs up, and also return to my scripts list occasionally for additional postings. Have a profitable future everyone!
Z Score Enhanced Time Segmented Volume (Multi MA)**THIS VERSION HAS BEEN STANDARDIZED WITH A Z SCORE CALCULATION AND ALLOWS THE USER TO SELECT WHICH MOVING AVERAGE THEY WOULD LIKE TO UTILIZE FOR THE SIGNAL LINE**
Chart shows the Non-Standardized Enhanced Time Segmented Volume (Multi MA) with default settings on top and the Standardized version with default settings on the bottom.
Time Segmented Volume was developed by Worden Brothers, Inc to be a leading indicator by comparing various time segments of both price and volume . Essentialy it is designed to measure the amount of money flowing in and out of an instrument.
Time Segmented Volume was originally ported to TradingView by user @liw0 and later corrected by user @vitelot. I never quite understood how to read Time Segmented Volume until I ran across a version by user @storma where they indicated when price would be long or short, but that code also utilized the incorrect calculation from user @liw0.
In an effort to make Time Segmented Volume more accessible and easier to read, I have re-coded it here. The calculations are based on the code from @vitelot and I have added direction indicators below the chart.
If the histogram (TSV) is greater than zero and greater than the moving average, price should be moving long and there will be a green box below the chart.
If TSV falls below the moving average while still being greater than zero, the trend may be exhausting and has been coded to read Price Action Long - FAILURE with a black x below the chart.
If the histogram (TSV) is less than zero and less than the moving average, price should be moving short and there will be a red box below the chart.
If TSV rises above the moving average while still being less than zero, the trend may be exhausting and has been coded to read Price Action Short - FAILURE with a black x below the chart.
At times, the moving average may be above zero while TSV is below zero or vice versa. In these situations the chart will indicate long or short based on whether or not TSV is greater or less than zero. It is possible a new trend may be forming as the moving average obviously lags, but also possible price is consolidating with little volume and causing TSV to oscillate close to zero.
**Z Score // Standardized Option **
Thist Standardized code implements all of the above but also allows the user to select a threshold level that should not need to be adjusted for each instrument (since the output is standardized).
If the TSV value meets the long and short signal requirements above and TSV is greater than the threshold values a green or red box will print ABOVE the oscillator. The histogram will also change color based on which threshold TSV has met.
This calculation allows us to compare current volatility to the mean (moving average) of the population (Z-Length). The closer the TSV Z-Score is to the mean, the closer it will be to the Zero Line and therefore price is likely consolidating and choppy. The farther TSV Z-Score is from the mean, the more likely price is trending.
The MA Mode determines the Moving Average used to calculate TSV itself. The Z-Score is ALWAYS calculated with a simple moving average (as that is the standard calculation for Z-Score).
The Threshold Levels are the levels at which TSV Z-Score will change from gray to yellow, orange, green ( bullish ), or red ( bearish ).
Statistically speaking, confidence levels in relation to Z-Score are noted below. The built in Threshold Levels are the positive and negative values for 90%, 95%, and 99%. This would indicate when volatility is greater than these values they are out of the ordinary from the standard range. You may wish to adjust these levels for TSV Z-Score to be more responsive to your trading needs
80% :: 1.28
85% :: 1.44
90% :: 1.64
95% :: 1.96
99% :: 2.58
The Z Length is the period for which the Z Score is calculated
More information regarding Time Segmented Volume can be found here: www.worden.com
Original code ported by @liw0
Corrected by @vitelot
Updated/Enhancements by @eylwithsteph with inspiration from @storma
Multiple MA Options Credits to @Fractured and @lejmer
Bits and Pieces from @AlexGrover, @Montyjus, and @Jiehonglim
As always, trade at your own risk.

Enhanced Time Segmented Volume (Multi MA)**THIS VERSION ALLOWS THE USER TO SELECT WHICH MOVING AVERAGE THEY WOULD LIKE TO UTILIZE FOR THE SIGNAL LINE**
Chart shows two different options of many. Top option is the default settings and bottom option is a different moving average with no other changes.
Time Segmented Volume was developed by Worden Brothers, Inc to be a leading indicator by comparing various time segments of both price and volume. Essentialy it is designed to measure the amount of money flowing in and out of an instrument.
Time Segmented Volume was originally ported to TradingView by user @liw0 and later corrected by user @vitelot. I never quite understood how to read Time Segmented Volume until I ran across a version by user @storma where they indicated when price would be long or short, but that code also utilized the incorrect calculation from user @liw0.
In an effort to make Time Segmented Volume more accessible and easier to read, I have re-coded it here. The calculations are based on the code from @vitelot and I have added direction indicators below the chart.
If the histogram (TSV) is greater than zero and greater than the moving average, price should be moving long and there will be a green box below the chart.
If TSV falls below the moving average while still being greater than zero, the trend may be exhausting and has been coded to read Price Action Long - FAILURE with a black x below the chart.
If the histogram (TSV) is less than zero and less than the moving average, price should be moving short and there will be a red box below the chart.
If TSV rises above the moving average while still being less than zero, the trend may be exhausting and has been coded to read Price Action Short - FAILURE with a black x below the chart.
At times, the moving average may be above zero while TSV is below zero or vice versa. In these situations the chart will indicate long or short based on whether or not TSV is greater or less than zero. It is possible a new trend may be forming as the moving average obviously lags, but also possible price is consolidating with little volume and causing TSV to oscillate close to zero.
More information regarding Time Segmented Volume can be found here: www.worden.com
Original code ported by @liw0
Corrected by @vitelot
Updated/Enhancements by @eylwithsteph with inspiration from @storma
Multiple MA Options Credits to @Fractured and @lejmer
Bits and Pieces from @AlexGrover, @Montyjus, and @Jiehonglim
As always, trade at your own risk.

Wolfs ADX + DII have created an alternative visualisation of the ADX + DI indicator created by MasaNakamura, credits to them for providing the source code! :-)
The histogram represents the distance between the DI+ and the DI-. The crossing of the histogram is equal to the crossing of the DI lines.
The ADX line is coloured based on the threshold.
This creates a clean representation of the ADX + DI.

Underworld Hunter + Base ZoneUnderworld Hunter + Base Zone is designed to keep traders out of ranging markets by establishing a "dead zone" between the bands where price may be choppy or trends may be short lived. The original Underworld Hunter from @greenmask9 adapted Bollinger Bands by changing the basis from SMA to the EMA of the EMA of the EMA. This version now allows the user to select which moving average they would like to utilize for the calculation.
If price is outside of the upper bands, price may be bullish. If price is outside the lower bands, price may be bearish.
If price is within the green or red areas of the bands, a trend may be forming.
The system also plots when RSI has become over extended above the thresholds selected (70/20 is the default).
MA Period is the length/period the moving average is calculated with
MA Mode is the type of moving average that will be utilized in the basis calculation
The "Standard MA Calculation" Option changes the basis to calculate the moving average selected in MA Mode only once, instead of 3 times
Deviation 1 and Deviation 2 determine how far the dead zone bands will be from the basis
RSI Period is the length/period the RSI function is calculated with
RSI Extended - High Cutoff is the level RSI must reach to be marked as over extended. Most traders refer to this zone as "Overbought"
RSI Extended - Low Cutoff is the level RSI must reach to be marked as over extended. Most traders refer to this zone as "Oversold"
As many NNFx traders know, overbought and oversold essentially do not exist, though the zones can still be utilized
The remaining options are utilized for specific moving average calculations and are set to what is typically considered as "standard" for their values.
There are many options available for this code. The code has not been optimized but merely compiled. Settings should be adjusted for the instrument(s) you are trading.
Adapted from user @greenmask9
Multiple MA Options Credits to @Fractured and @lejmer
Bits and Pieces from @AlexGrover, @Montyjus, and @Jiehonglim
As always, trade at your own risk.

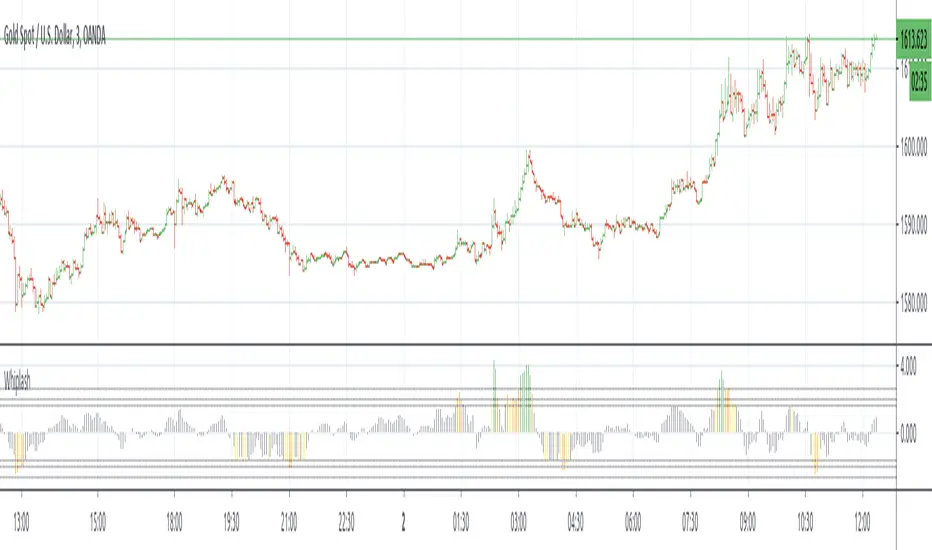
WhipLashThis is a study to determine if small candle bodies (little difference between open and close), regardless of overall candle length (high/low), can be used to filter choppy markets.
The indicator will calculate the selected average "MA Mode" of (close-open). To standardize this result and ensure any filters/thresholds do not need to be recalculated for each instrument the result will be used to calculate the Z Score.
The idea is that when candle bodies are small there is very little actual price movement, and therefore price is choppy. When considering the Z Score of that result, any outliers ie larger candle bodies, could show a potential trend forming. This indicator is similar to QStick but allows more customization by the user.
MA Mode determines which MA is used to smooth the results of (close-open)
Price Smoothing is the number of running periods the MA Mode is calculated for.
The three Thresholds are preset to the 90%, 95%, and 99% levels for Z Score. If these thresholds are altered you may wish to also alter the horizontal lines programmed for each level on the positive and negative sides.
The Z Length is the period for which the Z Score is calculated
Multiple MA Options Credits to @Fractured
Bits and Pieces from @AlexGrover, @Montyjus, and @Jiehonglim
As always, trade at your own risk.
[e2] EDS Key & AvwapThis indicator shows a Key Level Support & Resistance level and VWAP that resets on your choice of the stock's Earnings , Dividends or Splits release date.
A maximum of 8 bands calculated using a factor of the anchored VWAP's standard deviation can be displayed.
Note
The script is designed for stock-trading only.
Credits
Inspired by timwest , LazyBear 's Earnings S/R Levels and MichelT 's Earnings, Splits, Dividends scripts.

FRAMA - Supertrend strategyFRAMA Strategy
I found this strategy on internet, in a well-known forex forum.
I have translated the two indicators mentioned in that strategy (originally in mq4) in pine script.
Thanks to Fractured and Shizaru for the FRAMA snippets, to mejialucas for Supertrend snippet, to JayRogers for trade management snippet and to Trost for backtesting snippet.
I also added some code to have FRAME with a deiiferent timeframe
Indicators set-up:
FRAMA period 24 (it was originally 25 but it's better to use an even number)
FRAMA timefarme lower then chart timeframe (e.g. daily chart and weekly FRAMA)
Supertrend indicator as it is.
Of course, it is better to adapt above setting to traded instrument.
Long/Buy rules:
1 - Enter at crossover between FRAMA and its signal
2 - Option to filter entries based on supertrend signal
3 - Exit when Supertrend change direction;
4 - Exit long when short signal occurs;
Short/Sell rules:
1 - Enter at crossunder between FRAMA and its signal
2 - Option to filter entries based on supertrend signal
3 - Exit when Supertrend change direction;
4 - Exit short when long signal occurs;
VERY IMPORTANT NOTE: this is a trend following strategy, so the target is to stay in the trade as much as possible (drawdown my be high). If your trading style is more focused on scalping and/or pullbaks, this strategy is not for you.
Credits to who developed this startegy (google it).
Thanks to all pinescripters mentined in the code for their snippets.
I have also a study with alerts.
Please use comment section for any feedback or contact me if you need support.

VQZL Z-ScoreVolatility Qaulity Zero Line attempts to keep a trader out of ranging markets, but the original calculation on TradingView had to be adjusted for each instrument. To avoid this issue, I have applied a z-score calculation to the VQZL so the result is standardized for all instruments. A Z-Score is simply a value's relationship to the mean (average) of a group of values, measured in terms of standard deviations from the mean.
This calculation allows us to compare current volatility to the mean (moving average) of the population (Z-Length). The closer the VQZL Z-Score is to the mean, the closer it will be to the Zero Line and therefore price is likely consolidating and choppy. The farther VQZL Z-Score is from the mean, the more likely price is trending.
The MA Mode determines the Moving Average used to calculate VQZL itself. The Z-Score is ALWAYS calculated with a simple moving average (as that is the standard calculation for Z-Score).
The Threshold Levels are the levels at which VQZL Z-Score will change from gray to yellow, orange, green (bullish), or red (bearish). These levels can be adjusted but you should adjust the Threshold Lines as well (in the style section), so they line up with your adjusted values.
Statistically speaking, confidence levels in relation to Z-Score are noted below. The built in Threshold Levels are the positive and negative values for 90%, 95%, and 99%. This would indicate when volatility is greater than these values they are out of the ordinary from the standard range. You may wish to adjust these levels for VQZL Z-Score to be more responsive to your trading need
80% :: 1.28
85% :: 1.44
90% :: 1.64
95% :: 1.96
99% :: 2.58
As always, trade at your own risk.
VQZL Created by Investo And Adapted From @sarangab
Multiple MA Options Credits to @Fractured
Bits and Pieces from @AlexGrover and @Montyjus

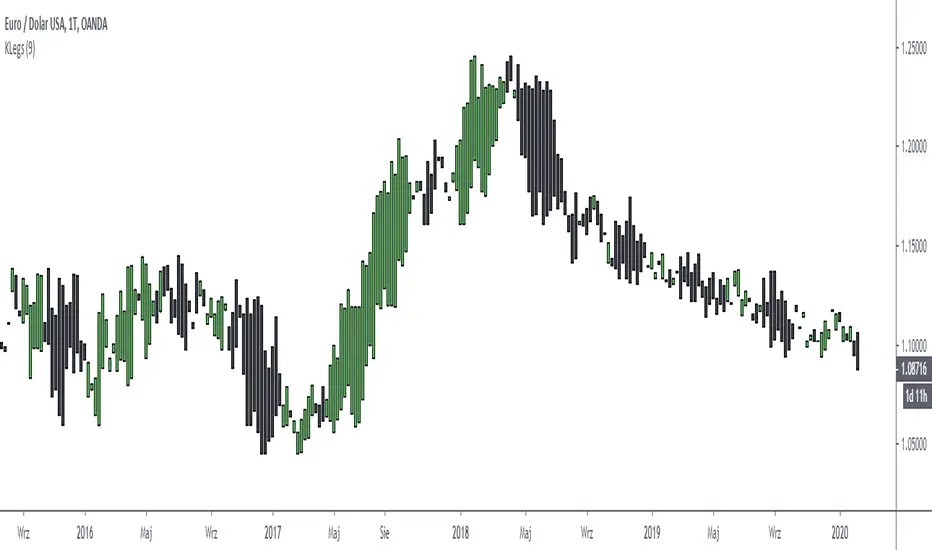
Kyushu LegsKyushu Legs
Ver 1.0 13.02.2020
Rewritten by Grzechu789
Credits to unknown autor!
BIG THANKS to majql for providing the code and an anonymous person who wrote it. I'm just republishing the code to have it in my library.
Enjoy!

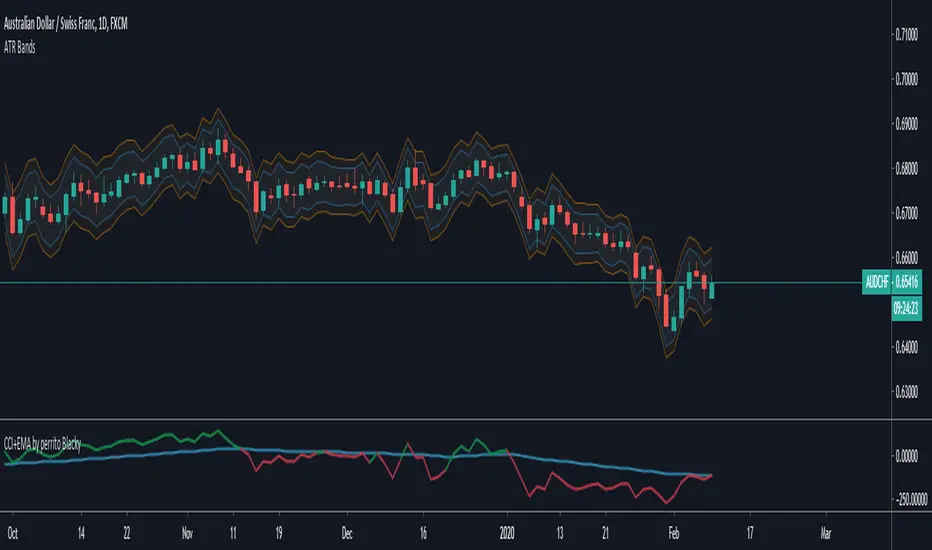
ATR BandsThe NNFX way
This indicator makes it easy to see the ATR values of the chart.
The red lines are at 1.5 ATR
The blue lines are at 1 ATR
Credits to www.tradingview.com for the code he published. I've extracted only the ATR to create this indicator. Many thanks ❤
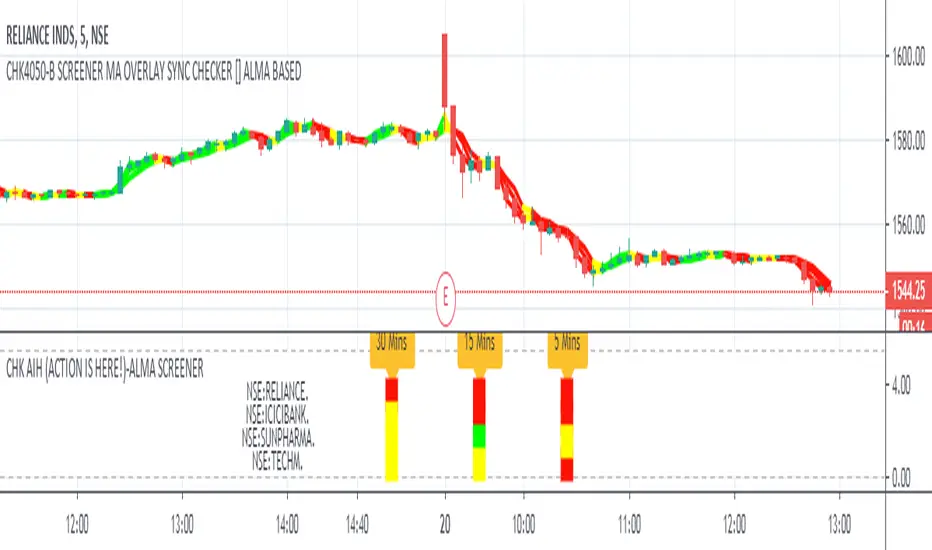
CHK AIH (ACTION IS HERE!)-ALMA SCREENERWe do not like to stare at the screen whole day, instead we like to jump where the
action is.... The Screener was written with this in mind
CHK AIH (ACTION IS HERE!)-ALMA BASED SCREENER
FEATURES
User can enter 3 Resolutions of his/her choice
User can select 3 Mov Avg Length of his her choice, which would be identical for all the three timeframes
User can enter stock basis his/her region's stock exchange
User can shift the screener left or right if not visible in a Multiscreen mode
Uses ALMA (Arnaud Legoux Mov Avg) as it smooth and reactive
Code is also provided below of MTF ALMA Moving Average OVERLAY on which this screener is based
LOGIC
For a particular timeframe If all the Moving Average are calibrated in one direction, it will show the requisite color.
For Example in an ideal scenario for a bull trend ALMA(5)> ALMA(13) > ALMA(21), once such a situation is identified, the screener will show green.
Yellow means lack of Calibration.
When 3 timeframes are calibrated, it becomes a high Probability Trade
BUGS
It is not allowing to enter the D/W/M timeframes, timeframe in numbers ...5/15/60 is working fine. If somebody can fix it
it would be great
LIMITATIONS
Because of TV's limitations only 4 scrips can be entered, however one add the indicator again with new scrips
//////////// CREDITS ////////////////////////////////////////////////////////////////////////////////////
//// hxxps://www.tradingview.com/script/rwdgyEZe/
/// Thank You Inno14 for graciously sharing your work. Your work has helped immensely !!!
////////////////////////////////////////////////////////////////////////////////////////////////////////
ICICIBANK
TECHMAHINDRA
YESBANK
[e2] Reflex & TrendflexNew Indicator from John F. Ehlers issued in the February 2020 Technical Analysis of Stocks and Commodities article "Reflex: A New Zero-Lag Indicator"
This indicator includes both studies described in the article and intend to significantly reduce the lag of the signal compared to other oscillators.
Reflex for the cycle component and is more sensitive to major reversals, Trendflex for the trend component.
Pivot Max range as the borders for top and bottom reading of the indicators (the script will plot separate borders for both components) and divergences were added.
Divergence function is the interpretation of built-in divergence script, optimized the code and added option to show real-time divs (without offset), all credits to ...)
daily*tip: I must say that very quickly I began to realize how fragmented and imperfectly modern economic knowledge is and how little can be taken from fundamental science in terms of practical recipes. (c) Andrey Movchan.
stay safe ;)
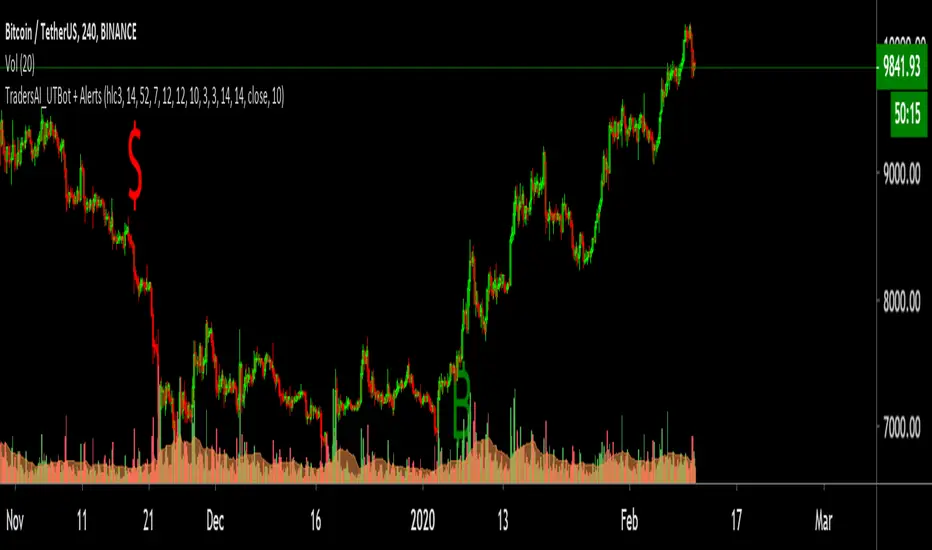
HighImpactBarsHighlights bars with open to close exceeding the ATR EMA.
Idea Credits (the boss): /u/ElanBension/
