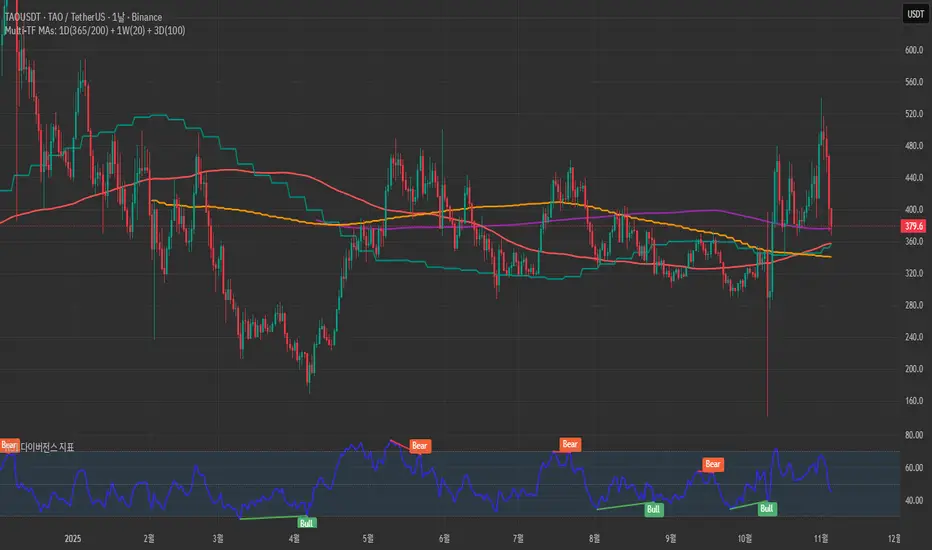
Golden Flow MapGolden Flow Map is a multi–timeframe moving–average system
designed to reveal the underlying direction of long–term market flow,
beyond daily volatility or short–term signals.
This script overlays four major trend lines — each representing a different layer of market rhythm:
Timeframe Length Meaning
🟣 1D – 365 MA Annual average — the true life line of the trend
🔴 1D – 200 MA Institutional benchmark — the long-term threshold
🟢 1W – 20 MA Mid-cycle momentum guide
🟠 3D – 100 MA Wave transition detector — captures trend shifts early
By combining these four perspectives on a single chart,
you can instantly distinguish between a short-term bounce and a major trend reversal.
🧭 How to Use
When all four lines align in one direction → that’s the main current of the market.
If price loses the 200D or 365D, ignore small rebounds — the structure has shifted.
The cross between Weekly 20 and 3D 100 often marks a wave transition.
Focus on alignment order rather than crossovers —
markets ultimately return to the direction of the higher timeframe.
⚙️ Features
SMA / EMA toggle
Individual MA on/off controls
Built-in alerts for 200D and 1W20 cross events
🧠 Concept
“Indicators are not signals — they are maps.”
This tool is not meant to predict, but to reveal the pulse of the market
and guide you through its long-term structure.
✍️ Creator’s Note
Developed from DDU’s personal long-term trend framework,
this indicator serves as a visual compass to expand a trader’s vision
from short-term reactions to macro-level flow.
Wyszukaj w skryptach "GOLD"
Gold $25 line + CDCGold Trading CDC + option line
trading with ema to see trendline + Option strike price

Indian Gold Festival Dates HistoricalIndian Gold Festival Dates (1975-2025)
Marks 8 major Indian festivals associated with gold buying over 50 years of historical data. Essential for analyzing seasonal patterns and cultural demand cycles in gold markets.
Festivals Included:
Dhanteras (Gold) - Most auspicious gold buying day
Diwali (Orange) - Festival of Lights
Akshaya Tritiya (Green) - "Never-ending" prosperity
Dussehra (Red) - Victory and success
Makar Sankranti (Cyan) - Solar new year
Gudi Padwa (Magenta) - Hindu New Year (Maharashtra)
Ugadi (Purple) - Hindu New Year (South India)
Navratri (Yellow) - 9-day festival
Features:
✓ 408 exact historical dates (1975-2025)
✓ Color-coded vertical lines for easy identification
✓ Toggle individual festivals on/off
✓ Adjustable line width and labels
✓ Works on all timeframes (best on daily/weekly)
Perfect for traders analyzing gold seasonality, Indian market sentiment, and cultural demand patterns. Use on XAUUSD, GC1!, or Indian gold futures.

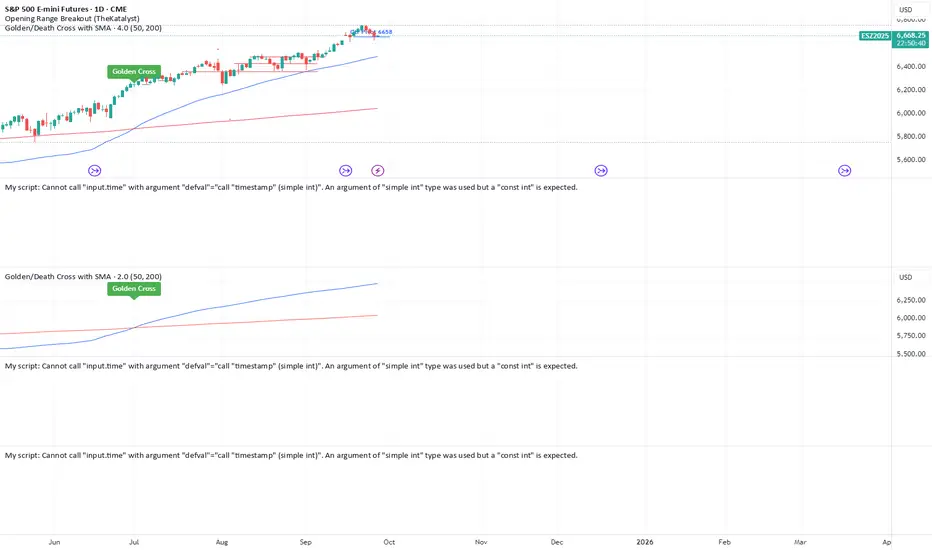
Golden/Death Cross with SMAGolden Cross: Triggered when the 50 SMA crosses above the 200 SMA.
Death Cross: Triggered when the 50 SMA crosses below the 200 SMA.

Gold 3min Trading Pro [XAU/USD]# Gold 3min Trading Pro - User Guide
## Overview
This is a professional scalping indicator specifically designed for Gold (XAU/USD) trading on 3-minute timeframes. It combines multiple technical analysis methods to provide high-probability entry signals for short-term trading.
## Key Features
### 1. Multi-Timeframe Trend Analysis
- **Major Trend**: Analyzes 15min, 1H, and 4H timeframes using moving averages
- **Short-term Trend**: Focuses on 3-minute price action and moving average alignment
- **Trend Strength**: Rated from 1-3 based on timeframe agreement
### 2. Core Indicators
- **RSI (9-period)**: Momentum oscillator for overbought/oversold conditions
- **Stochastic (9-period)**: %K and %D lines for entry timing
- **MACD**: Additional trend confirmation
- **Volume Analysis**: Detects volume spikes for signal validation
- **ATR-based Volatility Filter**: Ensures adequate market movement
### 3. Signal Types
- **Primary Signals**: Green triangles (LONG) and Red triangles (SHORT)
- **Enhanced Signals**: Stronger signals with multiple confirmations
- **Confirmation Signals**: Small circles for stochastic crossovers
## How to Use
### 1. Setup
- **Timeframe**: Use on 3-minute charts for Gold (XAU/USD)
- **Settings**: Default settings are optimized for Gold scalping
- **Session Filter**: Enable for London/New York sessions (recommended)
### 2. Entry Conditions
#### LONG Entry:
- Major trend is bullish (green background)
- Short-term trend is up or neutral
- RSI shows bullish momentum
- Stochastic indicates oversold recovery
- Volume spike confirmation
- Strong price action (bullish candle)
#### SHORT Entry:
- Major trend is bearish (red background)
- Short-term trend is down or neutral
- RSI shows bearish momentum
- Stochastic indicates overbought reversal
- Volume spike confirmation
- Strong price action (bearish candle)
### 3. Trade Management
- **Quick Target**: 50% of ATR-based calculation
- **Main Target**: Full ATR-based target
- **Stop Loss**: 60% of ATR below/above entry
- **Time Limit**: Exit if no progress within 20 bars (60 minutes)
### 4. Risk Management
- **Position Size**: Risk 1-2% of account per trade
- **Maximum Trades**: 3-5 trades per session
- **Avoid**: Low volatility periods and major news events
## Visual Elements
### Background Colors
- **Light Green**: Bullish major trend
- **Light Red**: Bearish major trend
- **Yellow**: Volume spike detected
- **Intense Colors**: Very strong trend alignment
### Chart Indicators
- **RSI Line (Blue)**: Main momentum indicator
- **Stochastic %K (Orange)**: Fast stochastic line
- **Stochastic %D (Yellow)**: Slow stochastic line
- **Horizontal Lines**: 70 (overbought), 30 (oversold), 50 (midline)
### Information Table (Top Right)
- Total signal count and performance statistics
- Current market conditions and trend strength
- RSI levels and volatility status
- Trading session information
- Last signal timing
## Alert System
### Standard Alerts
- **Scalp Long Signal**: Basic long entry signal
- **Scalp Short Signal**: Basic short entry signal
- **Premium Signals**: High-quality signals with strong confirmation
- **Trend Reversal**: Major trend change notifications
### Alert Setup
1. Right-click on chart → "Add Alert"
2. Select desired alert condition
3. Configure notification method (popup, email, webhook)
4. Set alert frequency to "Once Per Bar Close"
## Best Practices
### 1. Trading Sessions
- **Optimal**: London-NY overlap (3:00-5:00 PM EST)
- **Good**: London session (2:00-11:00 AM EST)
- **Avoid**: Asian session and major news releases
### 2. Market Conditions
- **Best**: Trending markets with normal to high volatility
- **Moderate**: Ranging markets during active sessions
- **Avoid**: Extremely low volatility or choppy conditions
### 3. Confirmation Rules
- Wait for signal triangle to appear
- Check that major trend aligns with signal direction
- Verify volume spike (yellow background)
- Ensure volatility is adequate (check info table)
### 4. Entry Timing
- Enter immediately after signal confirmation
- Use market orders for scalping speed
- Set stop loss and take profit levels immediately
## Settings Customization
### Essential Settings
- **MA Type**: EMA (recommended) or SMA
- **RSI Length**: 9 (default, can adjust 5-14)
- **Volume Threshold**: 1.8 (higher = fewer but stronger signals)
- **Volatility Filter**: Keep enabled for better signal quality
### Display Options
- **Show Scalping Signals**: Main entry signals
- **Show Performance Stats**: Information table
- **Show Trend Filter**: Background trend colors
- **Use Time Filter**: Session-based filtering
## Performance Optimization
### 1. Backtesting Tips
- Test on different market conditions
- Analyze win rate and average profit/loss
- Adjust settings based on historical performance
### 2. Signal Quality
- Higher trend strength (2-3) = better signals
- Volume confirmation improves success rate
- Enhanced signals have higher probability
### 3. Risk Control
- Never risk more than 2% per trade
- Use proper position sizing
- Stop trading after 3 consecutive losses
## Troubleshooting
### Common Issues
1. **No Signals**: Check volatility filter and session timing
2. **Too Many Signals**: Increase volume threshold or enable filters
3. **Poor Performance**: Verify timeframe (must be 3-minute) and symbol (XAU/USD)
### Support
- Ensure TradingView Pro+ subscription for multi-timeframe data
- Verify Gold symbol matches your broker's format
- Update to latest TradingView version
This indicator is designed for experienced traders familiar with scalping techniques and risk management. Always practice on demo accounts before live trading.

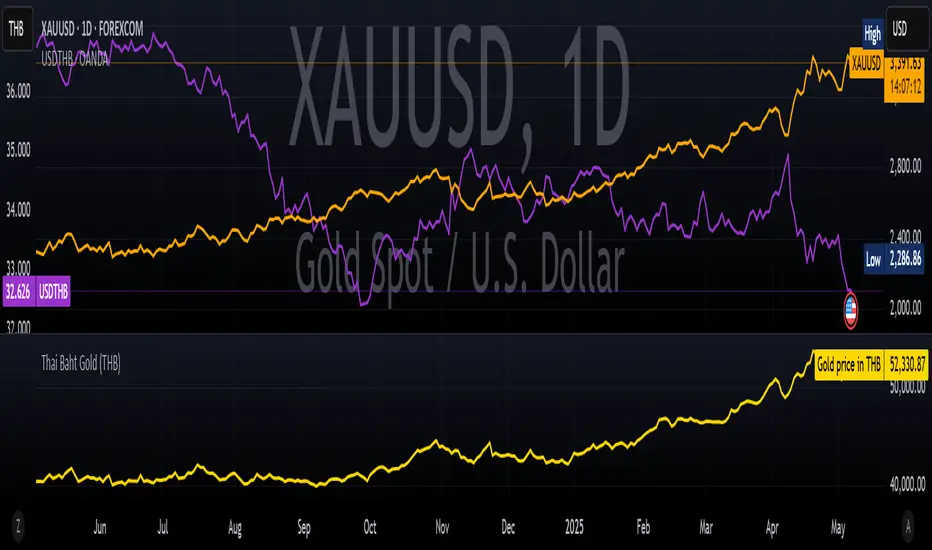
Thai Gold BahtIndicator Name: Thai Gold Baht
Short Title: Thai Gold Baht
Purpose
This indicator calculates and visualizes the real-time price of 1 Thai Gold Baht (15.244 grams) based on the global gold price ( XAU/USD ) and the USD/THB exchange rate .
Users can customize gold weight and purity to simulate the local Thai gold market price.
What it does
Retrieves live gold price per troy ounce in USD
Retrieves current USD to Thai Baht exchange rate
Converts the value using user-defined weight and purity
Displays result as a real-time chart
Shows calculation details in the Data Window
Ideal for
Traders tracking Thai gold based on international prices
Analysts comparing local and global bullion markets
Anyone needing a configurable, transparent gold price conversion
Pine Script Functionality
// Uses XAU/USD and USD/THB as inputs
// Calculates 1 Baht Gold (96.5% default purity)
// Outputs the value in THB as a chart line
ชื่ออินดิเคเตอร์: Thai Gold Baht
ชื่อย่อ: Thai Gold Baht
วัตถุประสงค์
อินดิเคเตอร์นี้ใช้คำนวณและแสดงราคาทองคำไทย 1 บาท (15.244 กรัม) แบบเรียลไทม์
โดยอ้างอิงจากราคาทองคำในตลาดโลก ( XAU/USD ) และอัตราแลกเปลี่ยน USD/THB
ผู้ใช้สามารถกำหนดน้ำหนักทองและความบริสุทธิ์เองได้ เพื่อจำลองราคาทองคำในประเทศไทยอย่างแม่นยำ
สิ่งที่อินดิเคเตอร์นี้ทำ
ดึงราคาทองคำแบบเรียลไทม์ต่อทรอยออนซ์ในสกุลเงิน USD
ดึงอัตราแลกเปลี่ยน USD → THB แบบเรียลไทม์
คำนวณราคาจากน้ำหนักและเปอร์เซ็นต์ความบริสุทธิ์ที่ผู้ใช้กำหนด
แสดงผลลัพธ์เป็นกราฟแบบเรียลไทม์ในหน่วยบาทไทย
แสดงรายละเอียดการคำนวณในหน้าต่าง Data Window ของ TradingView
เหมาะสำหรับ
นักเทรดที่ต้องการติดตามราคาทองคำไทยจากราคาทองคำตลาดโลก
นักวิเคราะห์ที่เปรียบเทียบราคาทองคำในประเทศและต่างประเทศ
ผู้ใช้งานที่ต้องการการแปลงราคาทองคำระหว่างประเทศให้โปร่งใสและปรับแต่งได้
การทำงานของ Pine Script
// ใช้ข้อมูล XAU/USD และ USD/THB เป็นอินพุต
// คำนวณราคาทองคำไทย 1 บาท (ความบริสุทธิ์เริ่มต้นที่ 96.5%)
// แสดงผลเป็นเส้นกราฟของราคาทองคำในหน่วยบาทไทย
RiskCalc FX & GoldRiskCalc FX & Gold is a multi-market position sizing tool designed to help you manage risk quickly and accurately. With this script, simply enter your account capital, the percentage of risk you wish to take, and your stop in ticks. Depending on the selected market—Forex or XAUUSD—the script automatically adjusts its calculations:
Forex: Assumes 1 lot equals 100,000 units.
XAUUSD: Assumes 1 lot equals 100 ounces.
The script calculates your risk in dollars and, using a fixed value of 1 USD per tick per lot, determines the ideal position size in both lots and total contracts. Results are displayed in a clear, centralized table at the top of the chart for real-time decision-making.
Perfect for traders operating across multiple markets who need an automated and consistent approach to risk management.

GOLDEN RSI by @thejamiulGOLDEN RSI thejamiul is a versatile Relative Strength Index (RSI)-based tool designed to provide enhanced visualization and additional insights into market trends and potential reversal points. This indicator improves upon the traditional RSI by integrating gradient fills for overbought/oversold zones and divergence detection features, making it an excellent choice for traders who seek precise and actionable signals.
Source of this indicator : This indicator is based on @TradingView original RSI indicator with a little bit of customisation to enhance overbought and oversold identification.
Key Features
1. Customizable RSI Settings:
RSI Length: Adjust the RSI calculation period to suit your trading style (default: 14).
Source Selection: Choose the price source (e.g., close, open, high, low) for RSI calculation.
2. Gradient-Filled RSI Zones:
Overbought Zone (80-100): Gradient fill with shades of green to indicate strong bullish conditions.
Oversold Zone (0-20): Gradient fill with shades of red to highlight strong bearish conditions.
3. Support and Resistance Levels:
Upper Band: 80
Middle Bands: 60 (bullish) and 40 (bearish)
Lower Band: 20
These levels help identify overbought, oversold, and neutral zones.
4. Divergence Detection:
Bullish Divergence: Detects lower lows in price with corresponding higher lows in RSI, signaling potential upward reversals.
Bearish Divergence: Detects higher highs in price with corresponding lower highs in RSI, indicating potential downward reversals.
Visual Indicators:
Bullish divergence is marked with green labels and line plots.
Bearish divergence is marked with red labels and line plots.
5. Alert Functionality:
Custom Alerts: Set up alerts for bullish or bearish divergences to stay notified of potential trading opportunities without constant chart monitoring.
6. Enhanced Chart Visualization:
RSI Plot: A smooth and visually appealing RSI curve.
Color Coding: Gradient and fills for better distinction of trading zones.
Pivot Labels: Clear identification of divergence points on the RSI plot.

Golden GateGolden Gate Indicator is a chart pattern analysis
every time 4 EMA line close to each other line
then show something big in Stock
rise otherwise down a sharp rally come soon
Sovereign Gold Hodlers Script for comparing nations and their gold, with options including:
Default Comparing the Price of Gold
Use Relative Valuations price / prior price
Measure Reserves/Price
GDP/Gold Price
GDP/Gold Reserves
Given the state of the world I thought it'd be good do see where countries stand, how much real money they hold. I think gold is going to play an increased role in trade between economies in the near future.

Gold Silver SpreadGold silver Spread
Different Between Gold & Silver Price
Find Spread Opportunity
Gold Vs Silver Strength Strategy

Full Swing Gold Vwap Macd SMO StrategyThis is a full strategy designed for gold market using 12h timeframe chart.
Its components are:
VWAP monthly
SMO oscillator
MACD histogram
Rules for entry:
For long: when enter when close of the candle is above vwap monthly, current histogram is higher than the previous one and SMO oscillator is above 0
For long: when enter when close of the candle is below vwap monthly, current histogram is lower than the previous one and SMO oscillator is below 0
Rules for exit:
We exit the trade if we get a reverse condition.
We also exit the trade based on a risk management system, both for SL and TP using % movements.
If you have any questions let me know !

{Gunzo} Stock to Flow (Gold, Silver, Dollar, Bitcoin)This indicator displays the Stock to Flow (S2F) ratio for popular commodities (Gold, Silver, Dollar, Euro, Bitcoin, Ethereum) in order to
compare them and determine which ones could be a good Store of Value (SoV).
OVERVIEW :
Stock to Flow is a popular indicator used to predict commodities scarcity. It evaluates the total stock of a commodity against the total amount that can be produced during a year. This model supposes that if scarcity is increasing, the price is going to increase.
This model has been used over the last years on Bitcoin to determine if the asset was undervalued or overvalued, and even make prediction models on the future price.
This script is going to focus on the Stock to Flow ratio (total stock/amount produced) to compare the following assets over time :
Mining resources (mined) for Gold and Silver
Cryptos assets (mined) for Bitcoin and Ethereum
FIAT currencies (banknotes printed) for Dollar and Euro
CALCULATION :
The calculation of the Stock to Flow ratio evaluates the total stock of a commodity produced against the production made for a specific year. The data is calculated on a yearly basis, then interpolated to get monthly or daily values.
DATA ORIGIN :
The main information needed to calculate the Stock to Flow ratio is the "yearly production" of a commodity. I tried to retrieve that information from the most reliable sources :
for Gold from research on www.gold.org
for Silver from research on www.silverinstitute.org
for Ethereum from research on etherscan.io
for Bitcoin from data source "QUANDL:BCHAIN/TOTBC" from www.quandl.com
for Dollar from research on www.federalreserve.gov
for Euro from research on www.ecb.europa.eu
SETTINGS :
Smoothing for interpolated data : Smoothing factor for assets that are calculated yearly and then interpolated (Gold, Silver, Dollar, Euro, and Ethereum)
Smoothing for non interpolated data : Smoothing factor for assets that are calculated daily and not interpolated (Bitcoin)
Display asset names : Display assets names in a colored rectangle on the right side of the chart
Display asset values : Display assets Stock to Flow ratio in a colored rectangle on the right side of the chart
Display key events for assets : Display important events for the assets at the bottom of the chart using the same color as the assets lines (for example Orange diamond is a Bitcoin halving). Please refer to the script code for the details of all events.
USAGE :
This script can be used on any asset available on TradingView as the data used is either static or external.
However I recommend using it the Gold asset from currency.com as the depth of the chart will be bigger (since 1980s).
It is recommended to used this script on the monthly timeframe as the chart data is calculated yearly and then interpolated.

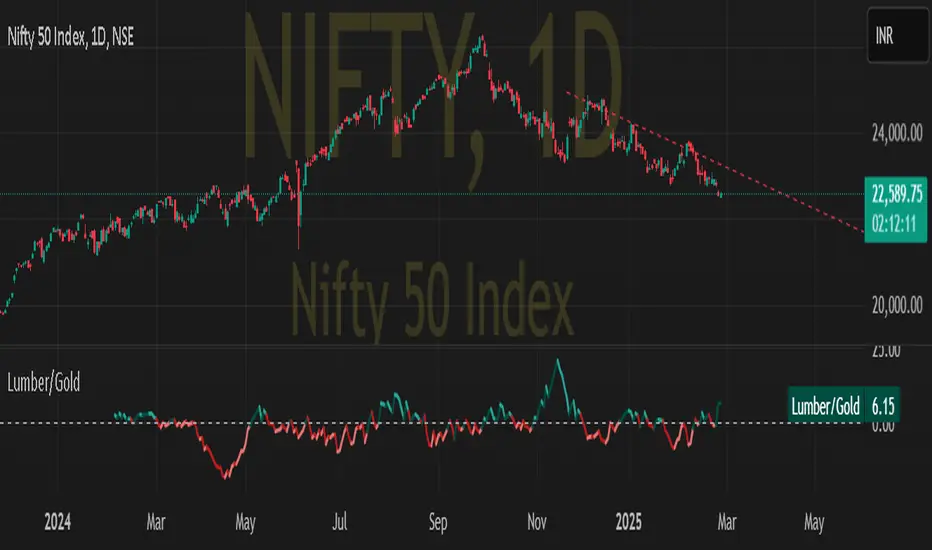
Lumber to Gold ratioDISCRIPTION:-
Lumber to gold ratio helps to predict up upcomming market correction as investors are flocking towards safe heaven.
USE CASE SCENARIO:-
If the ratio is above the zero horizontal line it is a risk of scenario
If the ratio plunge below zero it might show imminent market correction.
Swing or scalping GOLD [RickAtwood] Swing or scalping - automatically determine the currently active trends. Various moving averages are used. It is also designed for any type of trader from scalping to swing.
The key 3 moving averages are designed to identify support and resistance. If the price bounces off them, boldly open and place a stop of 10-20 pips(currency pairs)
Functional
buy ---> green candles
sell ----> red candles
There are alerts for buy and sell based on crossovers
If the price is above the cloud then buy. If the price is below the cloud then sell. The main thing is to open deals only at the very beginning when the price starts to leave the cloud. Also, your stops will be minimal.
When testing this system, we opened 750 trades manually. Success rate of 71% for currency pairs and for gold
P.s If you have any questions about how to open, how to close deals. Always write to me, I will help you) Success to all.

Golden & Death Cross SMA 50 Cross SMA 200 Alert by pakmanGolden & Death Cross SMA 50 Cross SMA 200 Alert by pakman

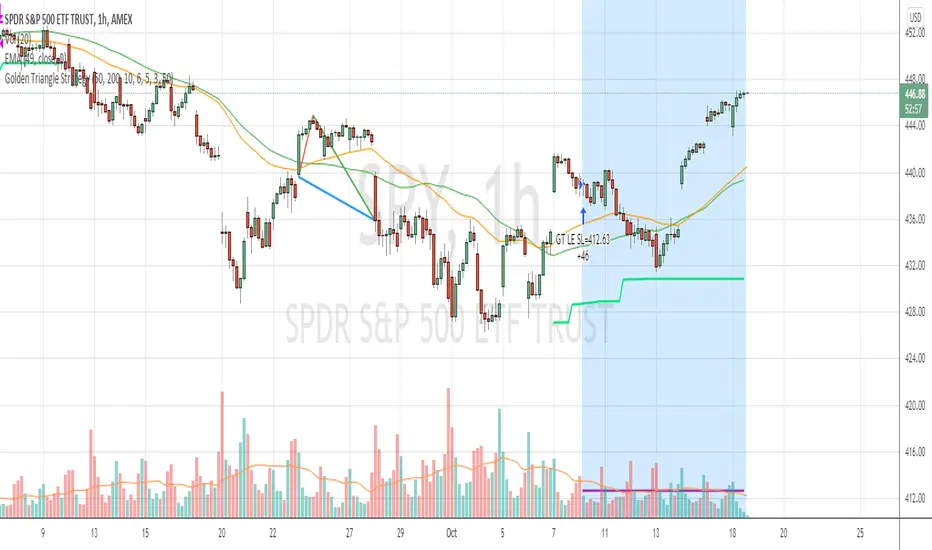
Golden Triangle StrategyGolden Triangle strategy setup is a variation of the buy-the-dip strategy, by Charlotte Hudgin.
You can find the detailed explanation here by Thomas N. Bulkowski thepatternsite.com
BUY
===
1. price should be trading above sma50
2. when it touches sma50 first time , check the starting rallypoint of where it initiated
3. from the above point to current close , see if you have white space , then draw the triangle
4. then check for volume confirmation ( current volume should be greater than last 4 ) --- I have slightly changed this to fit into hourly strategy by adding condition close>vwap
EXIT
====
1. Exit when close crossing down sma50 with at least 2% profit (slightly modified original condition)
StopLoss
========
2. stop loss is set to 6%
Warning
=======
For the use of educational purposes only
Portfolio and Risk Management: Gold Based Net Growth CoefficientHello, if our topic is stocks, whatever signal we get, we have to divide and reduce the risk.
Apart from the risk, we need inflation-free figures to detect a clear growth.
Gold is one of the most successful tools to beat inflation in this regard in the historical context.
When the economy is good, we have to beat both commodities and inflation.
For this purpose, I found it appropriate to develop a net growth factor free from gold growth.
Investors need several stocks with a high growth rate and as much risk-free as possible.
Personally, I think that the science of portfolio and risk management will last a lifetime and should continue.
I think this subject is a research and development subject.(R & D)
My research and publications on this matter will continue publicly.
I wish everyone a good day.
NOTE : You can determine the return in the time period you want to look back by adjusting the period in the rate you want from the menu.
The standard value is 200 days. (1 year)

ANN MACD GOLD (XAUUSD)This script aims to establish artificial neural networks with gold data.(4H)
Details :
Learning cycles: 329818
Training error: 0.012767 ( Slightly above average but negligible.)
Input columns: 19
Output columns: 1
Excluded columns: 0
Training example rows: 300
Validating example rows: 0
Querying example rows: 0
Excluded example rows: 0
Duplicated example rows: 0
Input nodes connected: 19
Hidden layer 1 nodes: 5
Hidden layer 2 nodes: 1
Hidden layer 3 nodes: 0
Output nodes: 1
Learning rate: 0.7000
Momentum: 0.8000
Target error: 0.0100
NOTE : Alarms added.
And special thanks to dear wroclai for his great effort.
Deep learning series will continue . Stay tuned! Regards.


Gap finder (gold minds)This tool highlights where gaps happens and outlines in the chart where the gap zones are. If there is a gap up there is a green line, a gap down it is red. The gap zone is highlighted in blue. You can choose the size of your gap with the input menu to the desired size. Feel free to ask comment below. Made for the Gold Minds group
