BTCUSD-zero to 20K LongerTimeFrame (LTF) -(BTCUSD)This is a Longer Time Frame Fib level indicator. It shows where the market is looking to go and where it has been. When the market get above one level ( white bar, for example) look for price action to continue to the next level. If it breaks below the white bar look for it to go the next level below for support. I will also publish levels inside these levels for those looking to see them on smaller time frames. You can find them yourself by taking the red level fibs as plug numbers. This makes it fractal in nature. I hope it will impress! It is great for having targets. It helps in knowing why the market may continue in a direction. For example: When the price action has already moved up, why does it keep going up, because it hasn't reached targeted fib level yet. Same reason price action may move lower. It is looking for its fib level support. Find the fractal or/of inner fibs by plugging in two consecutive red level fib numbers as the plug numbers. With two plug number it will work for any instrument at any level. I'm looking for 5400 for support higher on Bitcoin.
Wyszukaj w skryptach "Fractal"

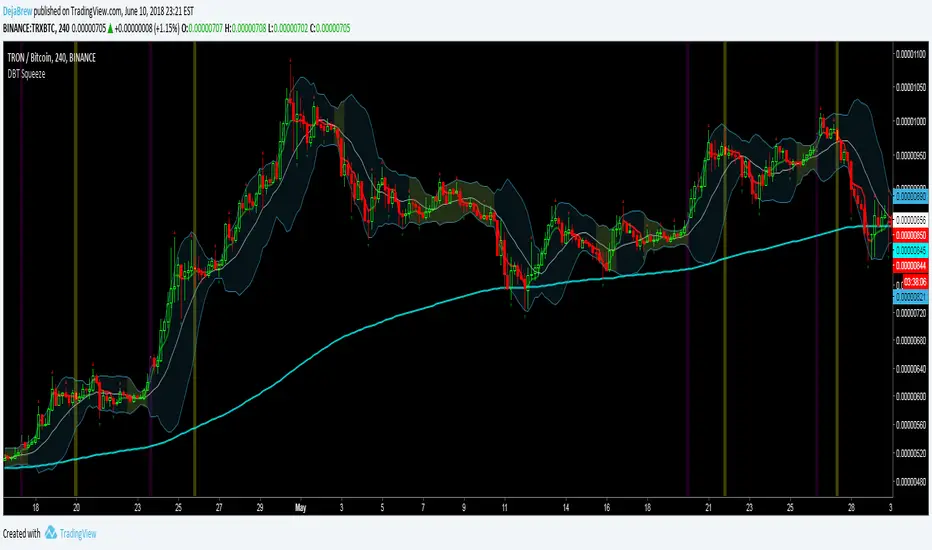
DBT SqueezeThe DejaBrew Trading Squeeze is an indicator designed over years of trading volatility. It uses Bollinger Bands to determine areas of low volatility, signified by the yellow shading of the squeeze. Then it takes into account CCI values to determine a breakout incoming. This indicator also has VWAP, 200 ema, and Williams Fractals built in.
To use this indicator first determine a time frame that does not give a large amount of signals (it was designed to work best on the 5min but has been tested and works great on all time frames above 5min). Once a time frame is determined then look for Bollinger Band squeezes signified by yellow shading. Once the squeeze is determined wait for a purple or blue buy candle to signal (purple are stronger signals). Once a buy candle has signaled evaluate price action, if bullish and supported by other indicators then either take an aggressive entry on the buy candle or wait for a pullback no greater than 50% of the buy candle. Once your position has been established place a stop loss at 1% or below the 200ema and VWAP if possible, no greater than 3% is recommended. Target a 3% gain or wait for the Yellow Sell Candle to close most or all of your position.
Do not take buy candles in extremely bearish markets. Purple Buy Candles are much stronger than blue because they are above the 200ema signifying a bullish trend. Do not take every buy candle if market is choppy and giving a lot of signals. Pair this indicator with a Commodity Channel Index (50) for the best signals. When the CCI is stable and not choppy the buy candles will be much more accurate. Do not take buy candles if the CCI is very choppy.
Use at your own risk. This is not financial advise and this indicator is not guaranteed to make you profits. Please message me if you have any questions or feedback. Enjoy.
DO NOT ASK FOR ACCESS. THIS INDICATOR WILL BE AVAILABLE ON MY WEBSITE ONCE IT RELEASES.


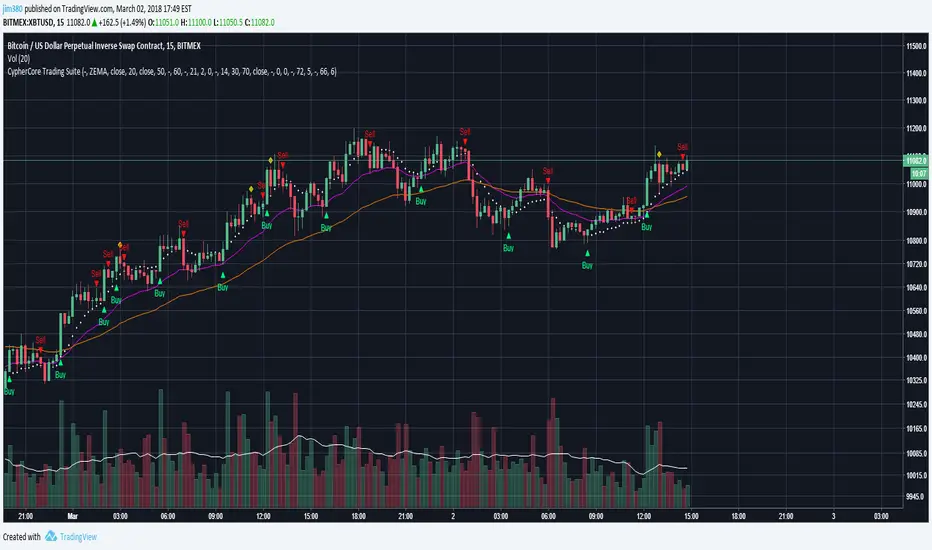
[STUDY] CypherCore Trading Suite
Rerband. Now a STUDY script.
- RSI overlay indicators (diamond shapes)
- Most commonly used MA types( i.e. SMA , EMA , WMA , VWMA , ZEMA )
- Bands
- Price Action Indicator (color coordinated)
color code:
yellow --- inside bars (breakout)
blue --- outside bars (breakout)
green --- up pin bars (reversal)
red --- down pin bars (reversal)
fuchsia --- down shaved bars (selling pressure, selling likely to continue)
aqua --- up shaved bars (buying pressure, buying likely to continue)
- Reversal candlestick patterns (only a few for now)
- Two strategies for determining buy/sell signals
1. buy/sell signals determined by EMAs crossover (better for position or swing trades)
2. buy/sell signals determined by MAs crossover (better for scalping)
03/02/2017
- Switched to STUDY
- Fractals added
- Alerts now fully working
- New "Input" menu
Buy/Sell signals are NOT financial advice.
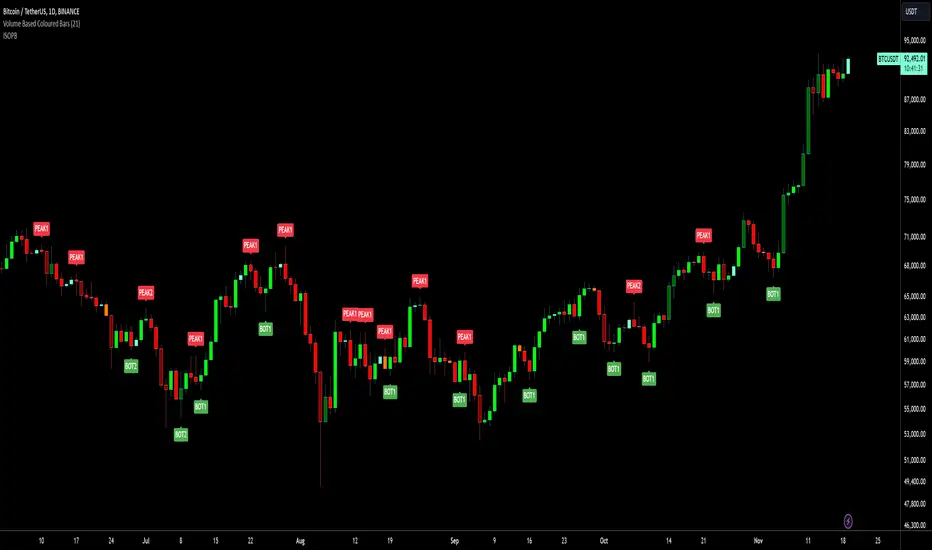
Isolated Peak and Bottom (Tuncer ŞENGÖZ) by KıvanÇ fr3762This Technique is created by Tuncer Şengöz @TuncerSengoz on twitter
An uptrend with higher highs might not make new highs everyday. So how could we define the end of an uptrend? How could we tell the difference between the end of an uptrend and a temporary correction? This isolated high/low technique aims to help us in this kind of situations.
We call the highest point of an uptrend until the particular day “an isolated Peak” and consider the lowest point of the day before as a signal level. If the signal level is broken in 2 days, we assume the uptrend to be over. If it is not broken in 2 days, the uptrend continues. The same technique also applies to a downtrend and the only difference would be the direction.
conversely it has the same logic of finding an end of a downtrend, called "Isolated Bottom" which can be considered the highest point of the day before as a signal level the same way.
The success rate of this technique is quite high (around 85%). There is no required term for this technique and it can be used in yearly, daily or ticker charts, because the market moves in fractals and repeats itself in every scale.
As in every technique, it might also give false signals in some situations like extreme volatility or emotional decisions of masses. However, it will be very helpful for us to indicate the direction of a trend.
Creator: Tuncer ŞENGÖZ @TuncerSengoz on twitter
Dynamic Range Channel [DW]This is an experimental study that utilizes Kaufman's Adaptive Moving Average and the McGinley Dynamic.
First, a fast and slow KAMA based McGinley Dynamic are calculated. The divergence between them is used to indicate wave direction.
The channel's bounds are calculated by taking the highest high and lowest low of the slow McGinley Dynamic over a specified channel period.
The dynamic midline is calculated by taking the mean of the highest and lowest values over the specified channel period.
Custom bar colors are included.
Also includes Williams Fractals for additional confirmation signals.

MonsterFractalA modification of the standard fractal indicator for pinpoint entry and narrow stop loss (trades taken in accord with other scripts). Similar to the standard Fractal, this script is one bar late (i.e. it can repaint one bar after it appears on the screen).
Other scripts from the picture (the Monster family of scripts) can be found here:
www.tradingview.com

BullTrading Parabolic Trend . Beta BullTrading Parabolic Trend . Beta
BullTrading Parabolic Trend is an experimental Indicator that filters main trend with minimum lag. The secondary filter smooths Parabolic Sar signals. Entries are based on Transient Zones Theory, Bill Williams Alligator, Fractals and Elliott Wave Oscillator.
Beta version use different parameters and displays

BullTrading Parabolic TrendBullTrading Parabolic Trend is an experimental Indicator that filters main trend with minimum lag. The secondary filter smooths Parabolic Sar signals.
Entries are based on Transient Zones Theory, Bill Williams Alligator, Fractals and Elliott Wave Oscillator.

Trade618ProContents:
-MA´s 6,24,72,288
-Fractals
Add this to your chart and then all you need to add is the AO and Volume.

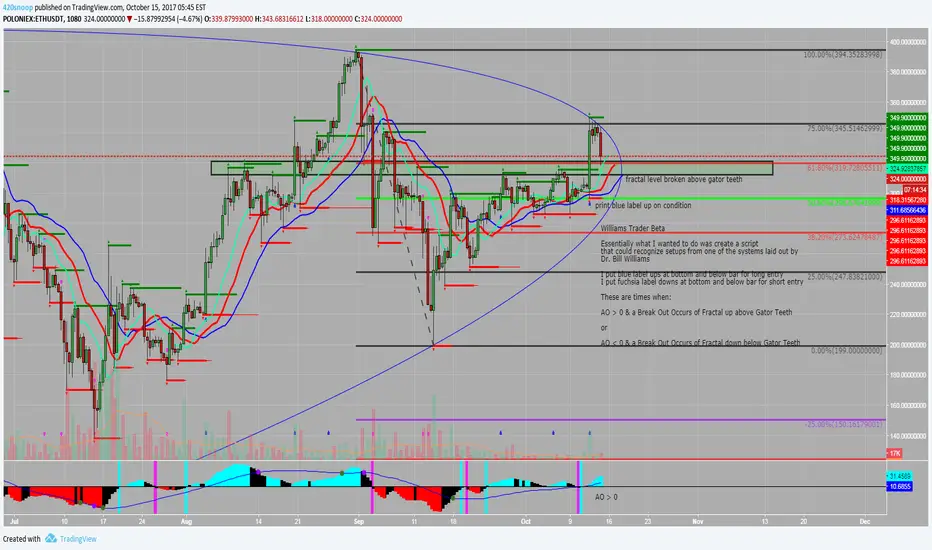
Williams Trader BetaWilliams Trader Beta (not for public use)
Essentially what I wanted to do was create a script that could recognize setups from one of the systems laid out by Dr. Bill Williams
I put blue label ups at bottom and below bar for long entry
I put fuchsia label downs at bottom and below bar for short entry
These are times when:
AO > 0 & a Break Out Occurs of Fractal up above Gator Teeth
or
AO < 0 & a Break Out Occurs of Fractal down below Gator Teeth
These also have alert conditions... be sure to use once per bar on close if using this condition!
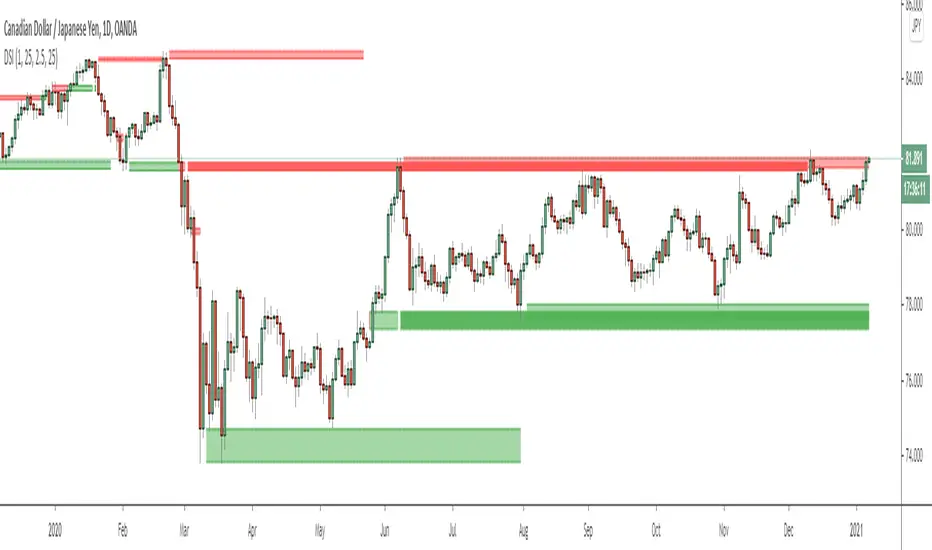
Dynamic Structure IndicatorThis is a dynamic structure indicator designed to map potential support and resistance zones (in all markets). It does this by looking back x amount of candles to identify major swing highs and lows on the specified reference timeframe, and then it draws a zone between the highest/lowest wick and the highest/lowest candle close across the chart until a new zone is created.
The settings are important because it gathers data from a separate reference timeframe, so sometimes it will map zones that aren’t really appropriate for lower timeframes. On lower timeframes (1Hr and under) I’d recommend setting the reference timeframe to your actual trading timeframe and increasing the lookback period to fine-tune the zone mapping. The script is set for 4 Hour forex charts by default.
Please note: the max zone option is disabled by default because it is different for every instrument, but this is a useful feature that I recommend using. Sometimes the indicator picks up huge gaps that aren’t really considered support or resistance zones. If this happens to you, use the zone size settings to invalidate huge (or tiny) zones. The zone size is in pips.
To be honest I didn’t get this indicator to be quite as accurate as I envisioned and it’s still a work in progress as I learn pine script, but this is the best I’ve been able to get it to function and with the right settings it works fairly well so I figured I might as well release this first version. Maybe someone with better skills than me can help refine it to more accurately identify major fractals and levels - if so, please get in touch! All traders should be able to identify their own major levels by eye anyway, but this script is intended to be a building block for future signal indicators I wish to develop.
Last of all - please don’t use this indicator to trade blindly! Often price will blast right through these zones and the zones aren’t always accurate. Remember that structure levels only work if they’re obvious to other traders, and always wait for confirmation signals that meet your trade plan rules before entering trades – especially reversals or counter-trend trades.
If you have any questions or tips to improve the script, feel free to leave a comment or private message me.
Enjoy, and good luck out there :)
- Matt.
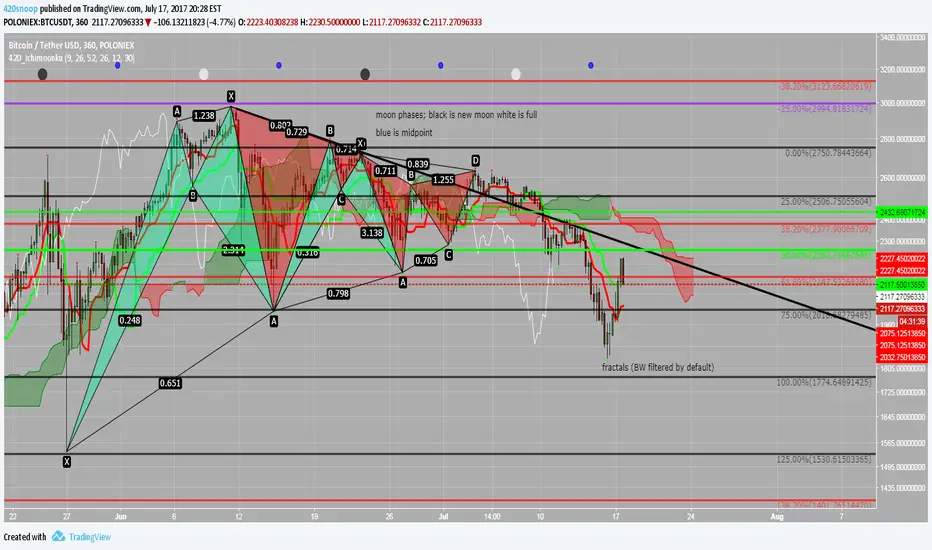
420_IchimoonkuSup all,
Snoop here with another script -- this time it is an ichimoku-type script. The ichimoku system is very powerful and the base script I have chosen to work from is the work of BrainZZ and Chris Moody; I added some alerts based on their signals and recolored to my liking. I suggest using the 'alert once per bar (on close)' if utilizing the alerts for TS crossing KS or the KS slope direction.
This script is great because it includes a moonphase indicator as well. This moonphase indicator was the work of Glaz and I appreciate the work he did on the base script which I have further modified and incorporated into this indicator. New moons are black, full moons are white, and the Q1 and Q3 are shown as blue.
The last thing in this script is the Williams Fractal and Higher High Higher Low fractal recognition. This is the work of JustUncleL and I appreciate the work he has done.
I hope everyone can get some good useage out of this it is packed full of some very powerful tools; feel free to PM me if you need resources on the ichimoku system or check out the education section of ichimoku_trader's posts.
As always good luck and happy trading!
xoxo
-- Snoop
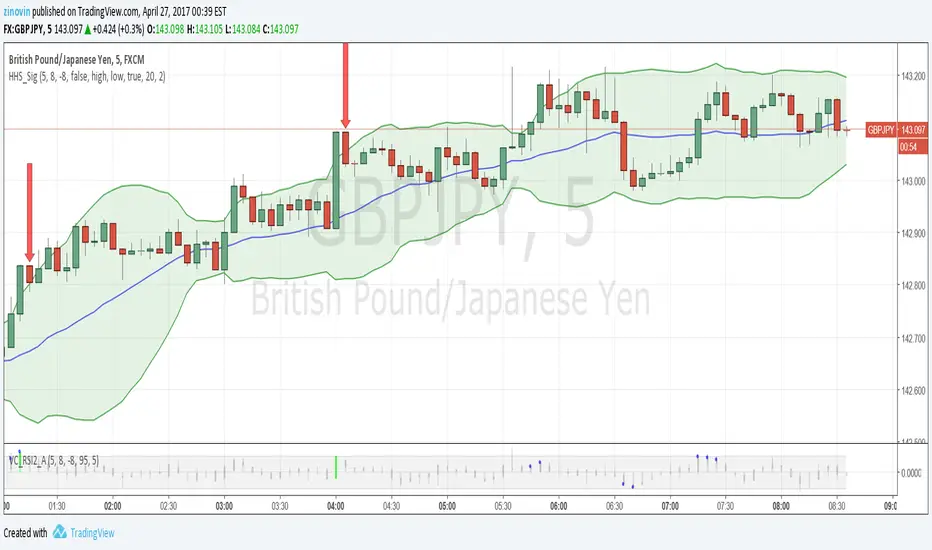
Hubba Hubba Style SignalsThe indicator shows signals for "Hubba Hubba Style" strategy (binary options). It is the best to use one with "Value Chart and RSI2 with Alert" indicator. I recommend to use TF5 and expiration time till 5 min.
Also HHS_Sig can show Bollinger Bands, Resistance and support lines based on William's fractals
TDRChaos-1.0TDR's version of the major Chaos Trading tools.
Alligator
Bullish/Bearish Divergent Bars (white cross above/below bar)
The three consecutive AO bars that start with the opposite bar first. (white square above/below bar)
Fractals (grey circle top/bottom)

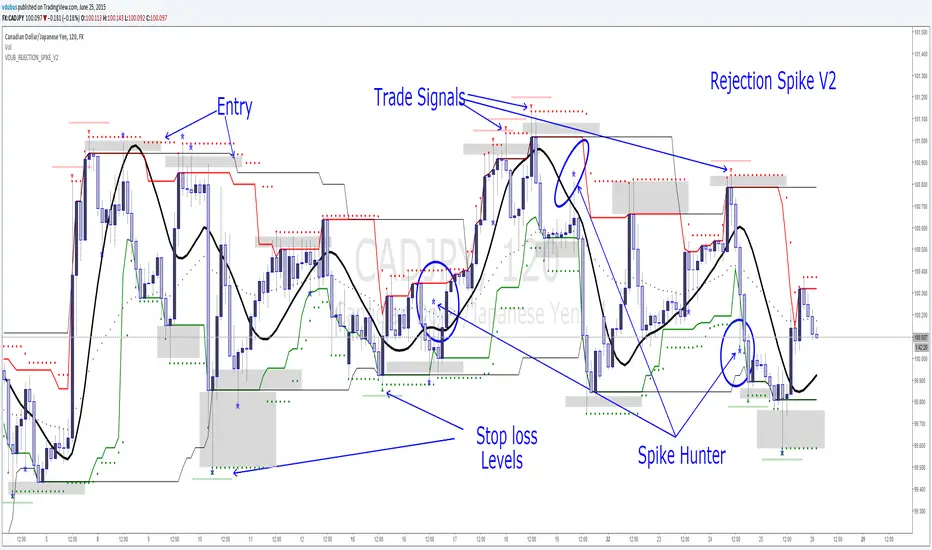
VDUB_REJECTION_SPIKE_V2VDUB_REJECTION_SPIKE_V2
Works on all time frames, Tested on 1min, I can't make it any faster
Hull MA
channel
channel 2
Pivot Channel
{RS} spike hunter
Modified Fractals V2
[iQ]PRO Structural Synthesis+Structural Synthesis+ Advanced Topology Analysis
Structural Synthesis+ is a high-fidelity technical analysis tool designed to identify significant institutional market structures using advanced signal processing and topological data analysis. It is built for a sophisticated method for distinguishing between genuine market breakouts and erratic price noise.
Methodology
This tool departs from traditional indicator logic by treating price action as a geometric manifold. It utilizes three core pillars of quantitative analysis to define market structure:
Topological Persistence: Instead of simple peak/valley detection, the script employs principles of persistent homology. It measures the "life span" of a price level relative to local volatility. Only structures that persist beyond a specific statistical threshold are qualified as significant, effectively filtering out "fake" levels created by minor liquidity grabs.
Digital Signal Processing (DSP): The engine features an adaptive denoising algorithm that estimates the true price trajectory in real-time. By minimizing the "lag vs. smoothness" trade-off common in standard moving averages, it provides a cleaner baseline for identifying structural breaks.
Entropy-Based Regime Detection: The script continuously calculates the Shannon Entropy of price movements. This allows the system to determine if the market is in an "Ordered" state (high probability for trend follow) or a "Chaotic" state (high probability for mean reversion or consolidation), adjusting the visual output and signals accordingly.
Key Features
Denoised Structure Mapping: Uses advanced signal processing to plot major support and resistance manifolds that adapt to current market conditions.
Liquidity Cluster Heatmap: Dynamically visualizes zones where significant price action has historically consolidated, highlighting potential areas of high interest.
Chaos vs. Order Matrix: An on-screen dashboard provides a real-time "Entropy" reading, identifying the current market regime.
Structural Gap Identification: Automatically highlights internal liquidity voids (gaps) that often act as magnets for future price action.
Validated Break of Structure (BOS): Generates signals only when a level is breached while the market is in an "Ordered" state, aiming to filter out low-conviction movements.
How to Use
Step 1: Identify the Regime: Check the Info Panel. An "Ordered" status suggests that structural breakouts (BOS) have higher validity, while "Chaotic" suggests a range-bound environment.
Step 2: Monitor Persistence: Look for the thick horizontal manifolds (Yellow for Resistance, Fuchsia for Support). These are your primary zones for institutional supply and demand.
Step 3: Signal Execution: A "BOS" (Break of Structure) label indicates price has successfully breached a persistent level with sufficient momentum and order.
Step 4: Risk Management: Utilize the Liquidity Clusters (Heatmap) to set logical take-profit targets or move stop-losses behind the most recent "Persistent" structure level.
Settings & Configuration
Topology Lookback: Adjusts the historical window used to identify significant price peaks and troughs.
Persistence Threshold: Controls the "strictness" of the structural filtering; higher values result in fewer, but more significant, levels.
DSP Denoising: Toggle the internal signal smoothing engine on or off to suit your preference for reactivity.
Chaos Threshold: Customizes the sensitivity of the Entropy calculation to define when the market enters a "Chaotic" state.
Visual Customization: Toggle the Heatmap, Structural Gaps (Holes), and dashboard visibility.
Past does not guarantee future results
Users discretion, offered for research and study purposes
To obtain access to this script, please see instructions to find where access is granted manually.

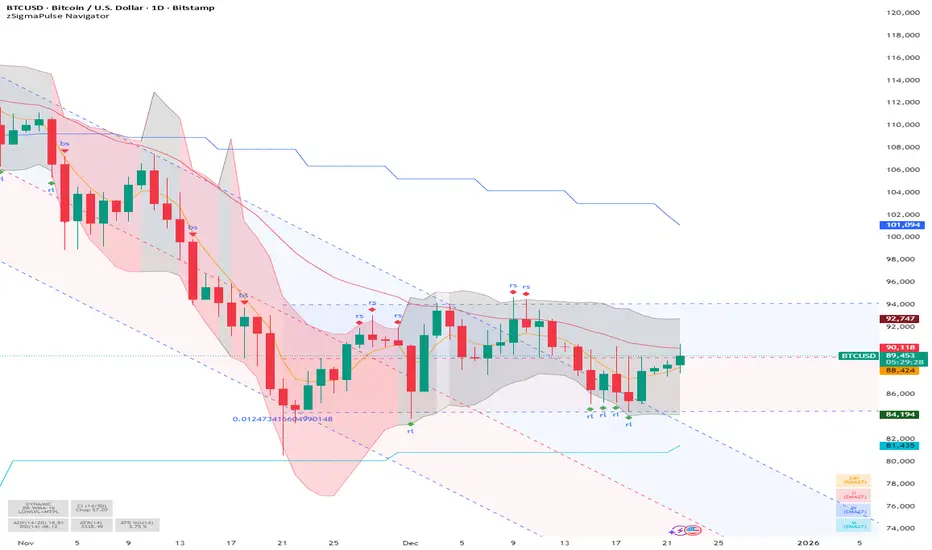
SigmaPulse NavigatorThe **zSigma Pulse Navigator** is a comprehensive, "Regime-Based" algorithmic trading tool designed for TradingView. Unlike standard technical indicators that generate continuous buy or sell signals regardless of market conditions, the zSigma Pulse functions primarily as a **market filter**. It first mathematically classifies the market environment as either "Efficient" (Trending) or "Inefficient" (Choppy) and only unlocks specific trading signals that are statistically valid for that specific state.
It is constructed from three distinct computational "engines" that work in unison to eliminate false signals:
### 1. The Regime Engine (The Filter)
The foundation of the zSigma Pulse is the **Choppiness Index (CI)**. The algorithm uses this to quantify the "Fractal Dimension" of price action.
* **Trend Mode (Green/Red Background):** If the Chop Index falls below a specific threshold (default 50), the system declares a Trend. The chart background lights up Green (Bullish) or Red (Bearish), permitting breakout strategies.
* **Chop Mode (Grey Background):** If the Chop Index rises above the threshold, the background turns Grey. This signals consolidation, warning the trader to ignore breakout signals and focus on mean reversion.
### 2. The Consensus Engine (The Vote)
To determine momentum direction, the indicator employs a proprietary "Voting System" that aggregates three independent indicators: **ADX** (Trend Strength), **RSI** (Momentum), and **SuperTrend** (Price Action).
* **The "2-out-of-3" Rule:** A directional signal (e.g., a Green Cloud) is only generated if at least **two** of these three engines agree. This consensus mechanism filters out "fake-outs" where price might move (SuperTrend) but lacks the internal energy (ADX) to sustain the move.
### 3. The Volatility Engine (The Cloud)
The tool visualises volatility through a **Dynamic Range**—a shaded cloud that expands and contracts based on market noise.
* It typically uses **Bollinger Bands** (based on Standard Deviation) or **Keltner Channels** (based on ATR).
* **In Trends:** The cloud expands, and the bottom of the cloud acts as a dynamic trailing stop.
* **In Chop:** The cloud contracts, creating a visual channel where traders can "buy the dip" (Diamond signals) at the bottom of the range.
### Key Features and Defaults
* **Institutional Tuning:** The indicator is hardcoded with "smart" defaults rather than standard retail settings. For example, it utilizes an **EMA 27** (a Fibonacci-adjacent number) rather than the standard 20 or 50 Moving Average, designed to catch institutional trends earlier.
* **Multi-Timeframe (MTF) Stack:** It automatically plots higher-timeframe Moving Averages (e.g., Weekly and Monthly lines) onto the Daily chart. This allows traders to ensure their trades align with the dominant structural trend without switching tabs.
* **Signal Shapes:**
* **Triangles:** Signal a **Breakout** (Trend Following).
* **Diamonds:** Signal a **Mean Reversion** entry (buying the bottom of the range in a pullback).
### Analogy
Think of the zSigma Pulse Navigator as a **sophisticated voltmeter** for the market.
Just as you wouldn't plug a sensitive appliance into an unstable power outlet, this tool measures the "current" of the market. If the volatility is erratic (Grey/Chop), it cuts the circuit to protect your capital. It only gives you the "Green Light" to trade when the voltage (Momentum) is stable and flowing in one direction.