Levels (Nephew_Sam_)Initial Commit.
1. Plots Asian Range based on time provided
- option to extend line to end of day
- option to fill range with background
2. Plots significant highs/low using fractals
3. Plot Daily/Weekly/Monthly OHLC
Wyszukaj w skryptach "Fractal"

Phoenix085-Studies-PerCentage Current Price ((fib-pivot-%))Misc Details :
Another Indicator and Totally my own concept...
If others have similar study already then Credit to them for coming up with this even before I did but this is just me fiddling with pinescript trying to paint my dream like a great man once said...
Background :
I am a strong believer of Market being Fractals and what best way to script it than Pivots.
So I just wanted to identify the Pivot High and Pivot Low of some period(in the script it is set to 500, please do play with it to get the best setting which captures atleast the major highs and lows of recent past)
I also think that Fibonacci levels are very crucial and so wanted to see how the market reacts at the Fibonacci ratios from Pivot High and Low.
Overview :
As said above the price at Pivot Low is considered as 0% on the graph and Value at Pivot High as the 100%.
Depending on the CMP, the thick white line is plotted...
The main thing of interest here is the Horizontal lines are Fib Levels and the market kinda reacts around those levels as the buyers and sellers have to come to equilibrium...
A price retracing from the 100% level just means Double Top = Sell(Probable) and a bounce from the 0% just means a double bottom = Buy(Probable)....
Also this indicator along with my other Public indicator() might give a better understanding of the price actions (I Hope)...
This is free to use and share with as many as you like...
Credits:
All the great people who have greatly influenced and still continue to do so...
@JustUncleL
@BigBitsIO
@TheArtofTrading
@QuantNomad
@SquigglesNiggles and many many many more

OFA - Order Flow AnalysisThe script analyzes order flow based on fractal structure breaks. Every time there is a fractal breakout in the opposite direction of the dominant side in control a new leg ( bullish or bearish ) forms. This script comes with the added value of displaying the velocity and the magnitude of each leg/cycle.
Order flow leaves a trail of the future market intentions via the ability or lack thereof of the aggregated flow to keep consuming liquidity provided by market makers and find or not equilibrium in price. The proper reading of order flow can provide information advantage. Flows can be read via two main venues:
1 - Magnitude: A major clue that will help determine the health of a trend is the type of progress by the dominant side in control of the trend. We need to ask the following question: Are the new legs in the active buy-sell side campaign as identified by the script increasing or decreasing in magnitude?
2. Velocity: When it comes to the distance the price moves, the magnitude is only ½ the equation. The other ½ has to do with the velocity of the move or the speed. Was the new leg created after a fast and impulsive move? Or did price make a new low or high with the movement being sluggish, compressive and taking too long to form? A good rule of thumb is to count the number of candles it took to achieve a new leg.

Ultimate multi-indicator & Alert script - AlphaNHBThis is a multi-indicator ultimate alert script that I built. This script is ideal for beginners, as well experienced traders who need direct indicators without any of the flashy unnecessary features. This script gets right to the point.
This strategy code was designed for the best mixture of most common indicators, allowing the user to mix and match any indicator he/she chooses.
Buying and selling indicators allow you to use the MACD , stochastics, RSI , moving average, fibonacci, t3, Bollinger bands , fractals, and more.
This script works on anything with a chart. It can be applied to crypto, stocks, bonds, forex, etc.
If you would like the strategy backtester that matches this script so that you can see the results of past data under certain configurations, it is available for free on my profile page. Or, just message me and I can direct you to it.
If anyone has suggestions on how to make this better, let me know! This is a growing script that I am building to be universally solid through different markets and through different market conditions!
Past performance doesn't suggest future.

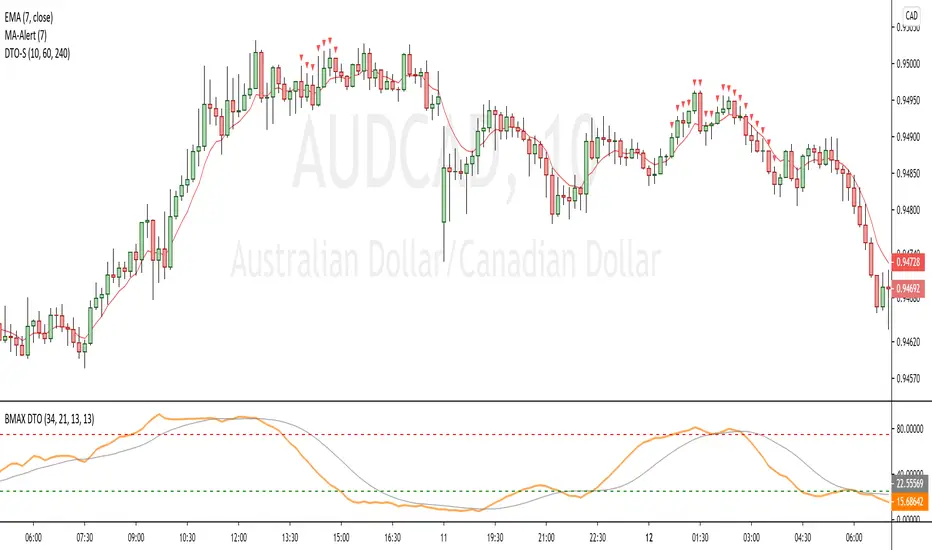
[BMAX] DTO Signal(ENGLISH)
This indicator is a variation of the original DT Oscillator that uses Stochastic and RSI calculations to find momentum opportunities. The purpose of it is to facilitate traking of multiple timeframes for overbought or oversold conditions.
As you can see on the example, we use the DT Oscillator in the selected timeframe, but in order to decide if we take a trade opportunity, we may want to see multiple timeframes in order to check a fractal scenario. DTO Signal indicates when 3 timeframes you select on the configurations are in the same condition, so overbought (above 75) or oversold (bellow 25).
(PORTUGUÊS)
Este indicador é uma variação do indicador DT Oscillator original que utiliza Estocástico e cálculos do RSI para encontrar oportunidades em "momentum". A proposta é facilitar o monitoramento de múltiplos tempos gráficos para condições de sobrecompra ou sobrevenda. Como você pode ver no example, com o uso do DT Oscillator no tempo gráfico escolhido, para que decidamos se tomamos uma posição no mercado, gostaríamos de verificar em múltiplos tempos gráficos uma condição fractal que construa um cenário provavel. DTO Signal indica quando 3 tempos gráficos escolhidos na configuração estão em uma mesma condição, de sobrecompra (acima de 75) ou de sobrevenda (abaixo de 25).
Support and Resistance-Heiken Ashi-Swing Index System-alertsThis is a breakout system that has pivot swing lines and a trailing stop built in. Many people try to use different ways to find out what a swing point is such as, zig zags, lookbacks, fractals, hand-drawn chart lines, or other subjective indicators. This looks at the heiken ashi price to objectively find the swing pivots. Many would agree that the color changes in the heiken ashi bars are signs of price reversals. This indicator tells where the significant swing points will be based on this concept. A lookback for a specific number of bars is then done to make sure the lowest low or the highest high is the actual swing point by looking at all possible combinations where it could be after finding the color change in the heiken ashi bar. After the swing points are found, the pivot lines can act as support and resistance levels, as trailing stops, as a confirmation of a breakout, or any other use that S/R lines might have. The colored zone filling is included along with the pivot top and bottom lines to show that the price has broken above/below the pivot lines and has remained above/below them. This trailing stop can be used as a final indication of an exit for trend following, breakout system, or any other system that it might benefit from by sometimes reacting before other trailing stop to give off a more reliable exit signal. It works similarly to other trailing stops such as ATR based ones and Supertrend, but instead of being used for an exit or stop, it is meant more for an entry or confirmation signal. A breakout of a price pattern or S/R levels can be confirmed when the colored red/green zone changes color. Other trailing stops or exit strategies can be combined to give off a better exit.
I made this indicator so that instead of using a trailing stop line to show the direction of the breakout or trend, a colored zone is used so that it doesn't get in the way of the upper and lower lines. It can be turned off in the settings if only the support and resistance lines are needed. Other than that, this indicator doesn't need any inputs whatsoever to find out where the swing pivots points might and are found objectively using heiken ashi. I also included several alerts to signal whenever the trend direction color zone changes, when the price breaks support or resistance, or when it breaks the previous support and resistance levels.

Ichimoku Kinko Hyo and moreI am publishing my updated Ichimoku ++ study with a more suitable title. Future updates will take place with this version.
Description:
The intention of this script is to build/provide a kind of work station / work bench for analysing markets and especially Bitcoin . Another goal is to get maximum market information while maintaining a good chart overview. A chart overloaded with indicators is useless because the structure of the chart is more difficult to see. The chart should be clear and market structure should be easy to see. The script allows you to add indicators and signals in different visualizations to better assess the quality of signals and the sentiment of the market.
A general advise:
Use the included indicators and signals in a confluent way to get stoploss, buy and sell entry points. SR clusters can be identified for use in conjunction with Fractals and other indicators as entry and exit pints. My other scripts can also help. Prefer 4 hours, daily and a longer time frame. There is no "Holy Grail" :).

Rain On Me PRO 2/3This is the part 2 of Rain On Me PRO. It follow my two other indicators "Rain On Me" and "Rain On Me V2". This version is called "PRO" because it is less "user-friendly" than the two previous versions. But it is more faster, and cleaner than ever!
This indicator is separated into 3 parts. You can find all parts into my profile in the « Scripts » section. Once the 3 parts together, the indicator is complete.
Here are the features for this part:
-Support/Resistance and Range lines (Red is Resistance, Yellow is Range, Green is Support).
-MTF Trend Line following the trend with red color for bearish trend and green color for bullish trend (Based on volume so it work only where the volume information flux is available).
-MTF Fractals with alerts. (Zigzag based on high and low).
Everything is fully customizable in settings.
To place an alert, always choose the "Once per bar" option.
Many functions are still to come. So don't hesitate to report bugs, suggestions and follow me to always be kept informed of the next updates to come!
//ALWAYS DELETE INDICATOR AND ALERTS AND RESET THEM AFTER AN UPDATE!
Thank again for your support!
Good trade everyone! And remember, money management is the most important!

Trend LineBasic Trend Line base on fractals (v0.1)
Can not draw a line on the future X axis, So just a line segment but not a ray.
I don't have a better idea to upgrade...

GC-ShorterTimeFrame (STF) (GC)This is a fractal version of the higher time frame Fib for GC . This is a Shorter Time Frame Fib level indicator. To be used with Longer Time frame Indicator. Though it can be used independently. It shows where the market is looking to go and where it has been. When the market get above one level ( white bar, for example) look for price action to continue to the next level (white bar). If it breaks below the white bar look for price action to go the next level below for support. It is fractal in nature. It is fib levels inside longer time frame fib levels. I hope it will impress! More importantly I hope you can make some money! It is great for having targets and support levels. It helps in knowing why the market may continue in a direction. For example: When the price action has already moved up, why does it keep going up, because it hasn't reached targeted fib level, yet. Same reason price action may move lower once it breaks a particular level. It is looking for its fib level support. I know Gold is in the spot light now...as most of the time. This should help trade smaller time frames. If it drops below or goes above this range I can publish more levels..just ask if I forget. Thx

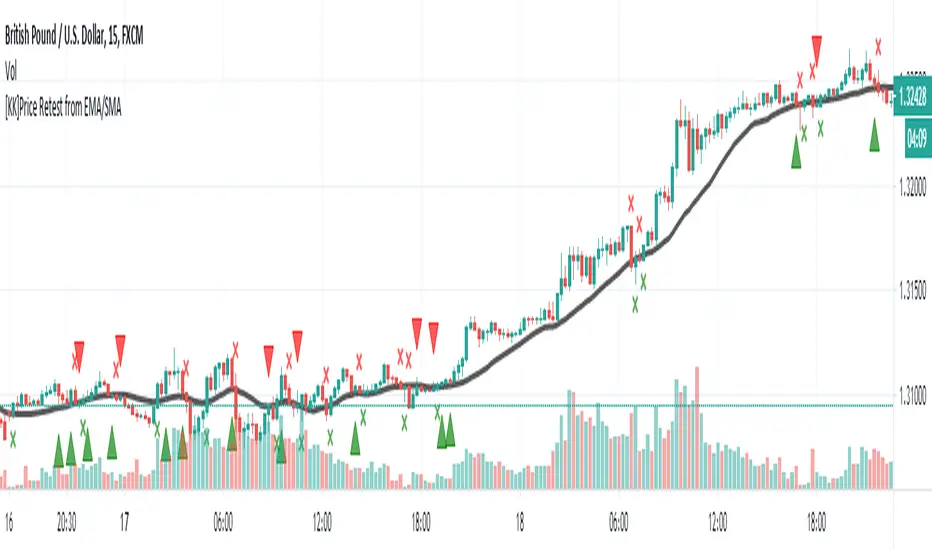
[KK]Price Retest from EMAScript show fractals on chart when price retest after breaking Exponential Moving Average.
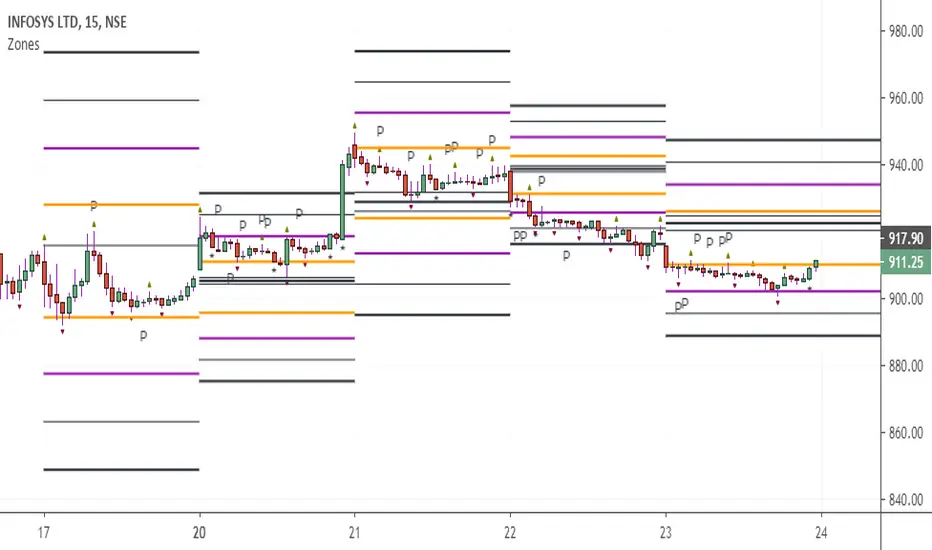
CAMZONEAdded Fractals which establishes high and low based on Bill Williams definition. Added one type of Pinbar (where the open and close is near extreme of the range and with long shadow that is at least 80% of the range). It is a powerful reversal pattern especially on the daily charts. These bars are identified with the character P. Also included dots below momentum candles.
DigitalTrendTradeAlerts | 0.3Digital Trend Trade Alerts is a compilation version of the Digital Trend Trade strategy that allows you to send out Trading View notifications:
The Digital Trend Trade trading strategy is designed for trading both local and global trends, as well as for displaying floating and fixed support levels and identifying price extremes.
The strategy consists of several main elements:
Global Average - On the chart, GA is displayed as the average price line, showing the current local trend direction with its color, as well as edging the bars to the trend color. Generates a signal when the local trend changes.
Global Trend - The second element of the strategy indicator is Global Trend, which forms the key support and resistance levels, when breaking through which the global trend changes and the corresponding signal is formed.
Bill Williams Fractal Levels - And the third element is the Bill Williams Fractal Levels block, which primarily fixes local extremes that can be used for scalping, as well as for setting a take profit and stop loss for a trade.
Support and resistance levels are also formed from local extremes.
To get access to the indicator, contact us via private messages.

NQLH-LongerTimeFrame (LTF) - Maroon, Green, Black/White (NQLH)This is a Longerer Time Frame Fib level indicator. It shows where the NQ market is looking to go and where it has been. When the market gets above one level ( white bar, for example) look for price action to continue to the next level. If it breaks below the white bar look for it to go the next level below for support. It is great for having targets. It helps in knowing why the market may continue in a direction. For example: When the price action has already moved up, why does it keep going up, because it hasn't reached targeted fib level yet. Same reason price action may move lower. It is looking for its fib level support. You can find them yourself by taking the red level fibs as plug numbers. This makes it fractal in nature. Find the fractal or/of inner fibs by plugging in two consecutive red level fib numbers as the plug numbers. With two plug number it will work for any instrument at any level. Use this indicator for a daily or weekly chart. The close on the day or the week would indicate where the next target level is at.

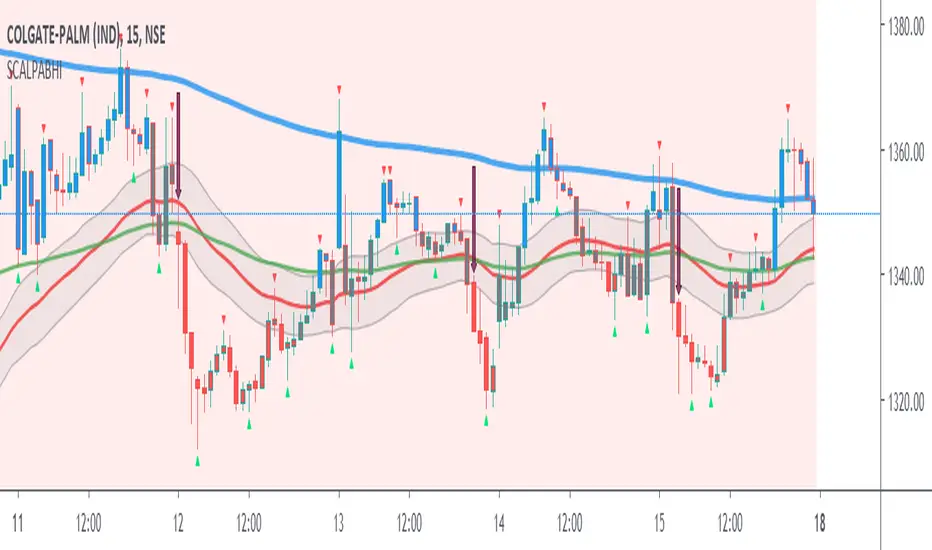
Scalping PullBack by AbhiSetup and hints:
When price is above the PAC(blue bars) we are only looking to buy as price comes back to the PAC, when price is below the PAC(red bars), we are only looking to sell when price comes back to the PAC
What we’re looking for when price comes back into the PAC we draw mini Trendlines (TL) utilising the Fractals and HH/LL points to guide your TL drawing.
Now look for the trend to pull back and break the drawn mini TL. That's is where we can place the scalp trade.
So we are looking for continuation signals in terms of a strong, momentum driven pullbacks of the PAC EMA(34).
The other EMAs are there to check for other Pullbacks when PAC EMA (34) is broken.
Other than the "SweetSpot Gold RN" indicator, you should not need any other indicator to scalp for pullbacks.
If you want to trade shallower Pullbacks for quicker scalps, try reducing the PAC and EMA combination lengths for example:
- 21 PAC and 55, 144, 377 for fast, medium, slow EMAs
- 13 PAC and 34, 89, 233 for fast, medium, slow EMAs
Each alert should be evaluated on it's own merits, the alerts are designed to highlight possible scalping trades from Pullback recoveries around the PAC.
Moving Average Compendium===========
Moving Average Compendium (16 MA Types)
===========
A selection of the most popular, widely used, interesting and most powerful Moving Averages we can think of. We've compiled 16 MA's into this script, and allowed full access to the source code so you can use what you need, as you need it.
-----------
From very simple moving averages using built-in functions, all the way through to Fractal Adaptive Averages, we've tried to cover as much as we can think of! BUT, if you would like to make a suggestion or recommendation to be added to this compendium of MA's please let us know! Together we can get a complete list of many dozens of types of Moving Average.
Full List (so far)
---
SMA - Simple Moving Average
EMA - Exponential Moving Average
WMA - Weighted Moving Average
VWMA - Volume Weighted Moving Average
DEMA - Double Exponential Moving Average
TEMA - Triple Exponential Moving Average
SMMA - Smoothed Moving Average
HMA - Hull Moving Average
ZLEMA - Zero-Lag Exponential Moving Average
KAMA - Kaufman Adaptive Moving Average
JMA - Jurik Moving Average
SWMA - Sine-Weighted Moving Average
TriMA - Triangular Moving Average
MedMA - Moving Median Average
GeoMA - Geometric Mean Moving Average
FRAMA - Fractal Adaptive Moving Average
Line color changes from green (upward) to red (downward) - some of the MA types will "linger" without moving up or down and when they are in this state they should appear gray in color.
Thanks to all involved -
Good Luck and Happy Trading!

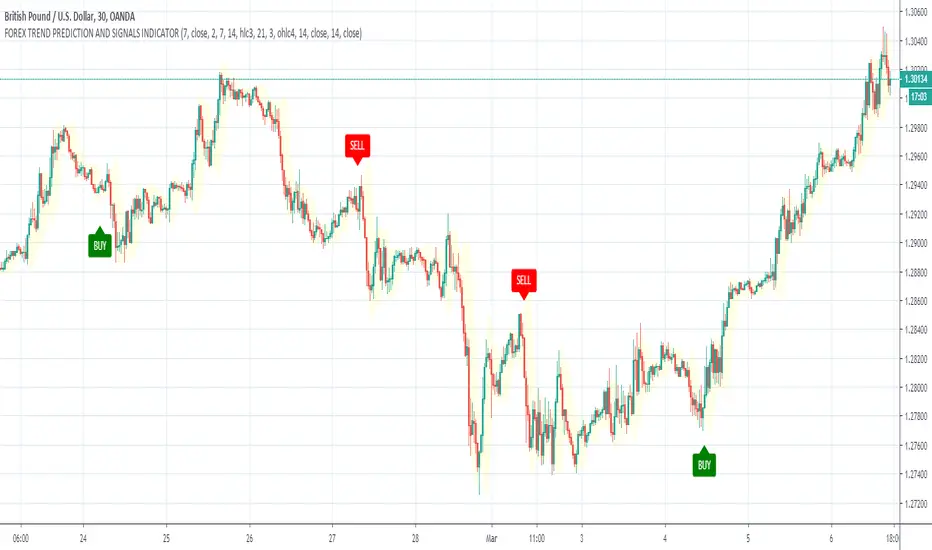
GBPUSD TREND DETECTION AND BUY/SELL ARROW SIGNALS INDICATORGBPUSD TREND DETECTION AND BUY/SELL ARROW SIGNALS INDICATOR
This script developed for active forex traders and based on Trend Analysis Indicators.
It used combination of Moving Averages, Volatility Indicator and Fractals and try to
detect reversal points of trends and generates buy/sell signals.
Works for all Forex currency pairs and time frames: 15MIN, 1H, 1DAY.
Can be used for swing trading and trend trading.
Advantage of this script indicator that all noise is filtered and signals detects long trends.
This make it useful as stand-alone trading strategy indicator or in combination with other indicators,
It is useful for day and intraday forex traders.
Main features of this indicator are:
✅ Forex Trend Reverse Points
✅ Forex breakout indicator
✅ Forex trend Signals
Zenith BladeThis script is based heavily on "Support/Resistance Zones x3" by Lij_MC
What I did is went and added alerts for when price breakouts the support line/zone.
You have the options to change if it is based on a zone breakout or a line breakout
You also can choose when it will go off, so for example you want an alert to trigger only between 7am and 8am then you can change that in the menu.
Lastly you can choose whither or not to show the Williams Alligator on the chart as I have found it beneficial in conjunction with the script since its based primarily on fractals to calculate Support and Resistance.

ChaosSN Label SignalThis signal indicator combines some key turning points including Fractals, Volume, Moving average and Momentum to try and pinpoint the moments a breakout or reversal is likely.
-Green/Red Arrows
Shows a possible breakout is pending. Place a long/short sell above or below the price line which is generated. Place a stop at a reasonable level as it's not guaranteed these breakouts will occur.
-Yellow Arrows
Shows a possible reversal is pending. Place a long/short sell above or below the price line which is generated. Place a stop at a reasonable level as it's not guaranteed these breakouts will occur.
Labels are also included to show possible rising/falling momentum as well as possible bullish/bearish/exhaustion candles.

PhiCube MIMASARThis PhiCube indicator measures the support and resistance of each PhiCube fractal, combining their alignment and slopes to determine trends and consolidations. The name means "Suport and Resistance (SAR) as indicated by the PhiCube MIMAs". MIMASAR is a combination of the PhiCube MIMACON and PhiCube MIMATEN indicators. Normal lines appear during trends. Bold lines appear in consolidations, showing the important support and resistance limits.
Este indicador PhiCube mede o suporte e a resistência de cada fractal PhiCube, mostrando tendência e consolidação dependendo do alinhamento e inclinação das MIMAs. O nome significa "Suporte e Resistência (SAR) pelas MIMAs PhiCube". MIMASAR é uma combinação dos indicadores PhiCube MIMACON e PhiCube MIMATEN. Linhas normais apresentam tendências enquanto linhas em negrito representam consolidações, mostrando os níveis importantes de suporte e resistência.

PhiCube SANTOMIMASARThe PhiCube SANTOMIMASAR indicator applies the PhiCube MIMA Suite on top of the Santo indicator to measure support, resistance, and relative behavior of the PhiCube fractals (SAR stands for Support And Resistance). It confirms price action and/or measures divergences with respect to price. Its scale is not fixed, nor is it directly comparable to the price scale. For this reason, it is necessary to apply the PhiCube MIMA Suite to both the Santo indicator as well as to price. Visual comparisons of crossovers and divergences between price and the Santo can then be made, showing a loss of velocity and potential reversal.
O indicador PhiCube SANTOMIMASAR e composto do indicador PhiCube MIMA Suite aplicado diretamente em cima do indicador Santo. Assim podemos medir suporte, resistência e comportamento relativo dos fractais PhiCube (SAR em inglês significa Suporte E Resistência). O indicador confirma o movimento e/ou mede divergências em relação do preço. Sua escala não é fixa, nem é comparável com a escala do preço. Por isso, é necessário aplicar o indicador PhiCube MIMA Suite tanto no preço quanto no Santo. Assim, podemos fazer uma comparação visual entre o preço e o Santo, comparando cruzamentos e divergências para identificar perdas de velocidade ou potencial reversão.


