Market Pivot Levels [Past & Live]Market Levels provide a robust view of daily pivot points of markets such as high/low/close with both past and live values shown at the same time using the recently updated system of polylines of pinescript.
The main need for this script arose from not being able to use plots for daily points because plots are inherently once drawn can't be erased and because we can't plot stuff for previous bars after values are determined we can't use them reliably. And while we can use traditional lines, because we would have extremely high amount of lines and we would have to keep removing the previous ones it wouldn't be that effective way for us. So we try to do it with the new method of polylines .
Features of this script:
- Daily High/Low Points
- Yesterday High/Low/Close Points
- Pre-Market High-Low points.
Now let's preview some of the important points of code and see how we achieve this:
With the code below we make sure no matter which chart we are using we are getting the extended hours version of sessions so our calculations are made safely for viewing pre-market conditions.
// Let's get ticker extended no matter what the current chart is
tc = ticker.new(syminfo.prefix, syminfo.ticker, session.extended)
Coding our own function to calculate high's and low's because inbuilt pinescript function cannot take series and we send this function to retrieve our high's and lows.
// On the fly function to calculate daily highlows instead of tv inbuilt because tv's length cannot take series
f_highlow(int last) =>
bardiff = last
float _low = low, float _high = high
for i = bardiff to 0 by 1
if high > _high
_high := high
if low < _low
_low := low
With doing calculations at the bars of day ending points we can retrieve the correct points and values and push them for our polylines array so it can be used in best way possible.
// Daily change points
changeD = timeframe.change("D")
// When new day starts fill polyline arrays with previous day values for polylines to draw on chart
// We also update prevtime values with current ones after we pushed to the arrays
if changeD
f_arrFill(cpArrHigh, cpArrLow, prevArrh, prevArrl, prevArrc, prevMarh, prevMarl)
valHolder.unshift(valueHold.new(_high, _low, _high, _close, _low, time, pr_h, pr_l))
The rest of the code is annotated and commented. You can let me know in comments if you have any questions. Happy trading.
Wyszukaj w skryptach "Fractal"

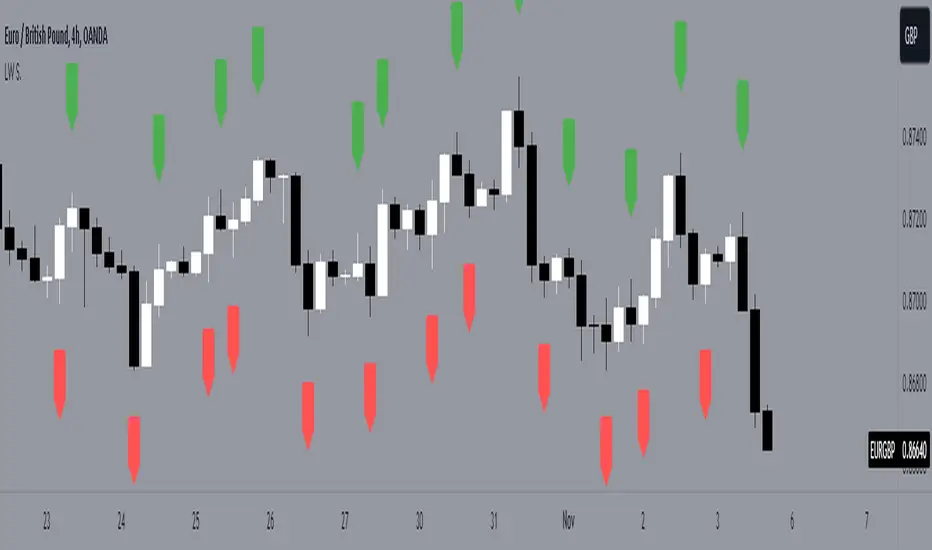
LW StructureThis easy and intuitive tool can be helpful to capture market trends.
This indicator marks the max and the min generated from the price with labels. The green labels are for the max peak and the red label for the min peak. This tool is inspired to the Larry Williams technique to easily catch the trend basing on the decreasing maximums and increasing mininums of the market structure.
Drawing inspiration from the Larry Williams approach, the LW Structure Indicator simplifies the process of recognizing trend patterns through the lens of market structure dynamics .
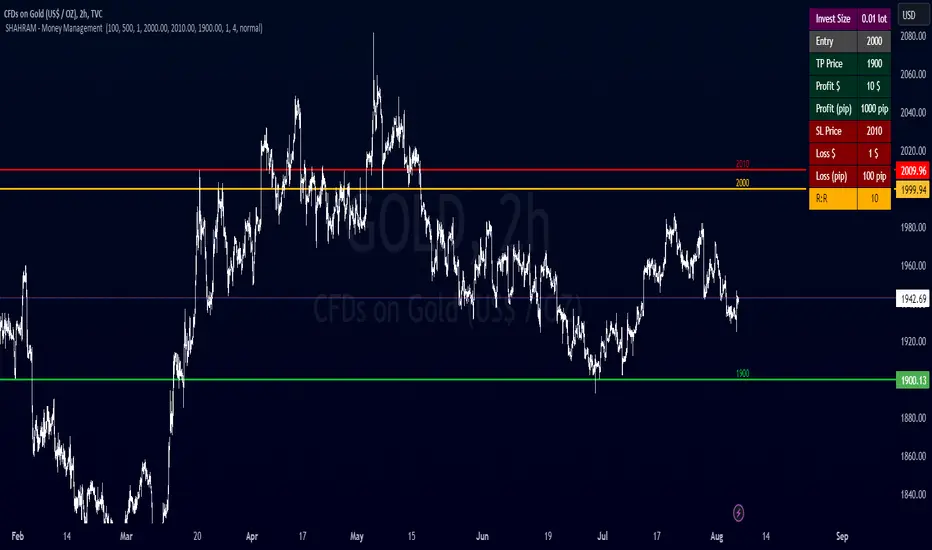
SHAHRAM - Money Management This indiator will help you to calculate your position size for managing the risk calculator.
Features :
Click-able Price Entry & SL & TP
calculations works on Forex, CFD, Stock, Futures and Crypto markets.
Usage:
Step 1: Set your entry price
Step 2: Set your stop loss
Step 3: Set your Target
Step 4: Choose the symbol, forex will be automatically detected
Step 5: Fill in your balance and set your risk settings
Parameters
- Set symbol: Forex (auto detection), US100, US30, BTC, XAUUSD, NGAS, XBRUSD, XTIUSD, AUS200, US500, OIL, GOLD, SILVER,...
- Account balance
- Risk in %
- Contract size
- Levels: Stop loss, Entry, Target
- Display settings for the Trading Panel
Trading panel
- Show Live P/L
- Show Risk to reward
- Show lot size
- Show risk in %
- Show account balance
- Show money at risk (no commissions included)
You need change the lot size in Account Setting of this indicator For Gold,Oil... and Other Symbol like as different pip value.
Simply choose your entry level and stop level than target price on the chart and the indicator will calculate your invest size and other documents. You can change your account risk and base currency units in the settings along with changing the scaling of the calculation to adjust the results with the lot sizing units of your broker. This allows the calculator to be used with CFDs, forex, Gold, etc.. Hope it helps in your trading it has been the single most useful tool in my trading as it has helped me always keep my risk locked up and on point that is why I released it.
Copyright BY : @shahramlife
indiator will help you to calculate your position size for managing the risk calculator.
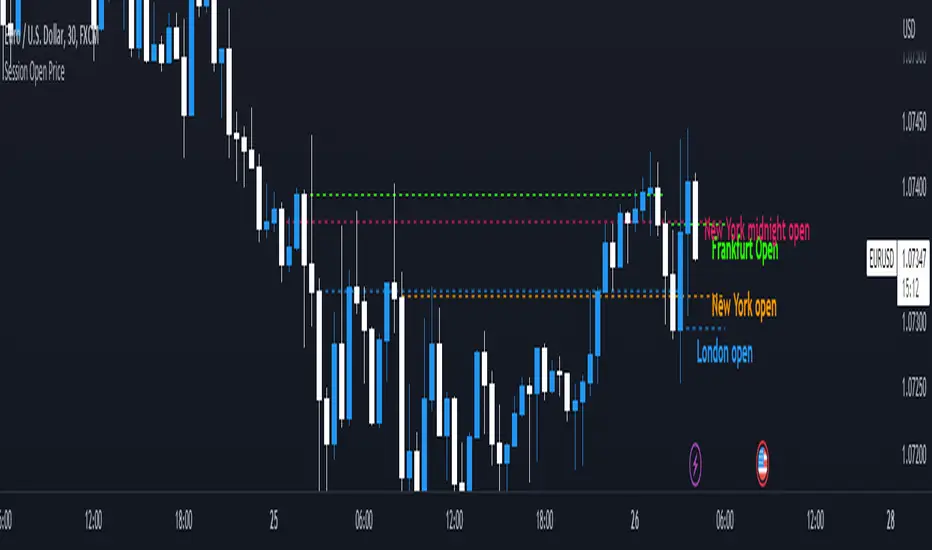
Session Open PriceThis Indicator displays the ICT kill zones' open price
You will be able to see the following open prices (ALL TIMES ARE IN NEW YORK TIME)
All times and appearances are customisable to your own liking.
The default time setting is recommended
- 00:00 AM Midnight New York Open Price (RED DASH LINE)
- 2:00 AM Frankfurt Open Price (GREEN DASH LINE)
- 3:00 AM London Open Price (BLUE DASH LINE)
- 8:30 AM New York Open Price (ORANGE DASH LINE)
HOW TO USE SESSION OPEN PRICE IN YOUR TRADING
If the price is above the opening price you only look for sells whereas if the price is under the opening price you only look for buys
BUY EXAMPLE
Wait for Midnight New York and Frankfurt open price to display
The price must be under both prices
Look for a Market maker buy model or your own entry model
Stoploss will be at the swing low and Take profit can be a fixed RR or how you calculate your take profit level
Trading BehnamI've read around here various definitions for engulfs along the lines of "an engulf consumes all orders at a level to allow price to easily pass through it." . That doesn't make much sense to me, if the guys with billions of dollars want to break a level, they will break it and price will run off very often. We've seen it time and time again, they don't need to engulf levels to give us a nice opportunity to get into the trade with them, if they want to blast through a level, they will do so and price will run off. If they want an opportunity to accumulate more orders before price runs away, then it doesn't make sense to engulf the level, better to let price bounce from that level and then fill more orders, if the level breaks then they have to deliberately stop the market running away and move it back to the pre-engulf area as the market momentum would naturally make it run off after an engulf. Other ideas about it being a secret signal between the institutions don't make sense to me either. To be honest, I think any secret signals between competing institutions come in the form of them in a heavily encrypted chatroom telling each other what to do. This collusion has been reported on previously as traders align their activities at important moments.
So I think we can all agree something along the lines of:
Fakeout:
Fakeout is an engulf of an obvious swing high/low in order to stop out traders and induce breakout traders to trade in the wrong direction, thus generating liquidity for the move in the opposite direction.
What's not so clear is the definition of the engulf, I'd like to try to give some ideas on the purpose of the engulf and it's definition and see what others think.
Engulf:
An engulf is the consumption of orders at an important level, not necessarily a swing/high low but an area where we expect to see supply or demand. Taking out of the orders tells us that the supply or demand which was or should have been present is now not present and tells us the intent direction of the market. If price runs off as is often the case, this is not tradeable and is effectively just a "breakout", although breakouts are usually considered to be breaks of swing high and lows which are obvious to the average trader. For an engulf to be tradeable there must be a retrace following the engulf back in the original direction. This adds confusion as it initially resembles a fakeout. So the question is, why does price retrace after the engulf? If an engulf to the short side is a genuine engulf and not a fakeout to generate long liquidity, why does it not travel immediately south if market momentum is ultimately south.
A small pocket of demand beneath the engulfed level may make it retrace north as price moves between areas of liquidity, this pocket of demand may give price enough momentum to make it back up to the supply which broke the demand level if key market participants do not favour an immediate market drop.
Alternatively key market participants may step in and drive the market back upwards.
Price moving north back to supply after the engulf may occur or be favourable for various reasons:
1) We often talk about FO generating liquidity because of breakout trading, but an engulf can also generate liquidity from breakout traders. Short breakout traders would place their stop losses a small distance above the engulf (breakout). If key players absorb this selling or allow a demand level to push price back up, they can run price back up to supply taking out the stops of the breakout short traders and make quick profit and/or generate more liquidity for their own shorts.
2) To confuse traders, the ITs don't want the puzzle that is Forex to be easy to solve, if price never retraced after an engulf then engulfs of all levels would be FOs. Price would either break and immediately runoff or it would turn and runoff in the other direction. In order to keep people confused about whether price is faking out or breaking out, sometimes price should whipsaw by breaking out, briefly faking out and then continuing in the direction of the breakout. This whipsaw pattern is to us a tradeable engulf.
3) Market momentum may be mixed, key players are indecisive or inactive or the market is behaving erratically.
4) As previously mentioned there may be a small pocket of supply/demand just past the engulf which is causing a reaction. This could also be viewed as a FO on a different timeframe. If the market engulfs an H1 demand level, then retraces for 30 mins upwards to supply, this engulf would be a valid and very profitable FO for an M1 trader looking to get long.

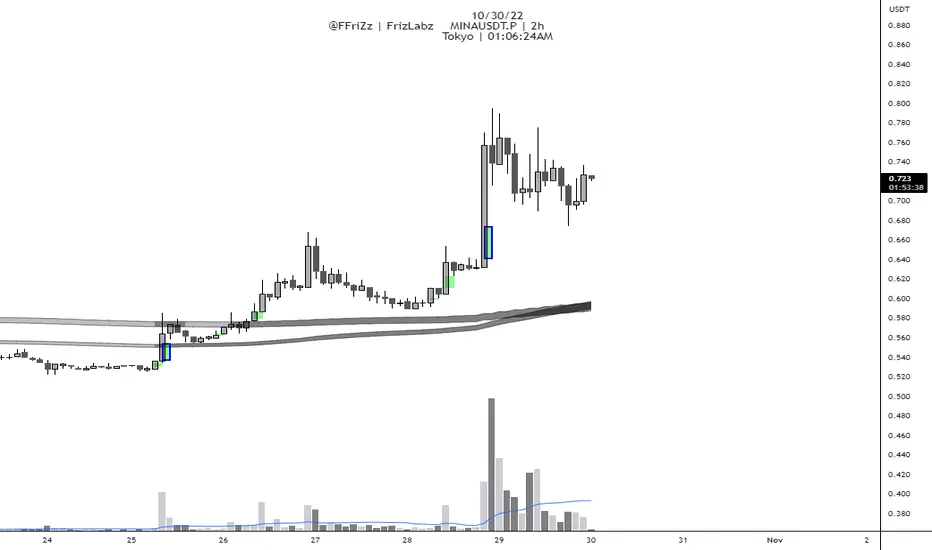
[PlayBit] FVG/EMAThis Indicator was made for the PlayBit Community by @FFriZz
This indicator includes 2 of the most used indicators within the community
1. FVG indicator -- Very minimalistic version seems to be the most used
2. EMA indicator -- Indicator made by using two 200 EMAs one tracking highs and one tracking closes -- to form a 200 EMA Channel
-- The EMA Can be used as a single one on the current chart or there are 5 other options that will allow you to track up to 5 timeframes
higher or lower
----- Options ------
-- FVGs --
1. Ability to keep FVGs on chart when Filled/Mitigated or have them Deleted
2. Setting to Change the border of the FVG when it has been tested
3. Can have the FVGs resize to the untapped area
4. Setting to adjust the number of FVGs that are displayed on Chart at a time
-- EMA --
1. Up to 5 Different timeframes
2. Color Switch if close is above or below EMAs
3. Color Settings
Shout out to the PlayBit Community
for being a great community for Trading and in general!
If anyone finds any bugs Please let me know on here or on PlayBit
or if I removed something in this version you would like to see put back..
Hope you enjoy!
@FFriZz | @FrizLabz
Fractal Series History SummaryThis script presents a summarized view of a series by drawing lines between series samples taken at power-of-two intervals from the current value.
The intent is to provide a visualization of trendlines at multiple scales, without having to untangle those that my overlap each other.
It doesn't overlay a price-chart as written; it could, but IMHO that would be redundant. It's intended to augment oscillators and other kinds of indicators that don't necessarily scale with a price chart.
The script does not attempt to provide buy or sell triggers, but rather, to provide a visualization tool and a line-drawing tech-demo.


Fractal Composite Ribbon 1.1Added alerts when L1 fast or L2 med-fast pop out of grey hysteresis state into red or green.

Best FracktalsKey Features:
Fractal Detection: The script detects both top and bottom fractals using custom logic based on candle body highs and lows, not wicks.
Customizable Parameters:
Number of candles (len) to check on each side of the central bar to determine if it forms a fractal.
Number of fractals (fractalCount) to remember and draw lines for.
Visual Indicators:
A red downward triangle marks top fractals above the bar.
A green upward triangle marks bottom fractals below the bar.
Fractal Lines:
Draws up to fractalCount horizontal lines across the chart at the levels of the most recent fractals.
Lines update dynamically as new fractals are detected.
Logic Overview:
Top Fractal: The central candle has a higher body high than surrounding candles.
Bottom Fractal: The central candle has a lower body low than surrounding candles.
Ensures no duplicate fractals are marked on equal highs or lows.

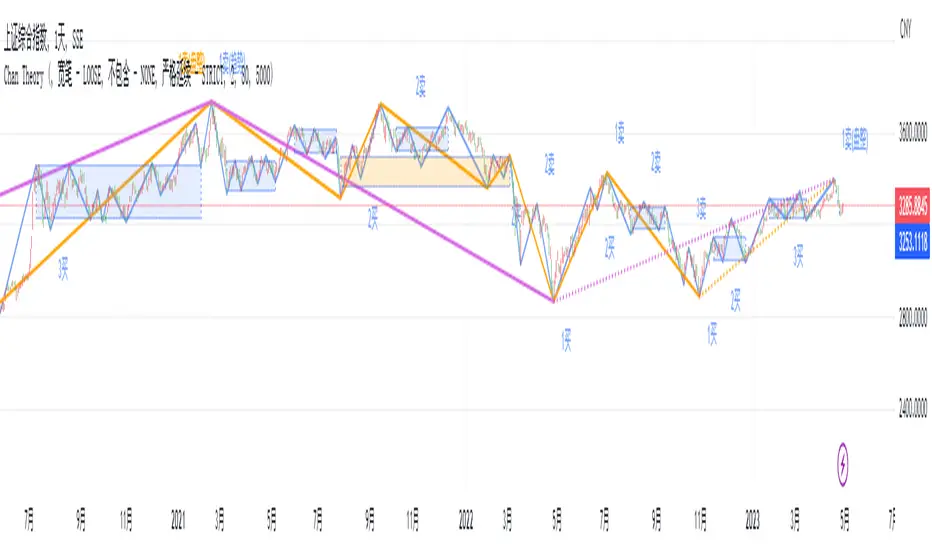
ChanLun ProChanLun, also known as Entanglement Theory or "缠论", is a highly regarded technical analysis methodology that originated in China. Since its introduction in 2006, ChanLun has rapidly gained significant attention and a strong following within the Chinese trader community due to its exceptional ability to navigate complex market dynamics.
ChanLun places great emphasis on market structure, price action, momentum, and the intricate interplay between market forces. It recognizes that the market operates in cyclical patterns and aims to capture the underlying structure and rhythm of price movements. Through meticulous analysis of the intricate relationships between price and time, it provides traders with a unique perspective on market trends, potential reversals, and critical turning points.
This indicator offers a meticulous and comprehensive implementation of the ChanLun theory. It facilitates in-depth analysis and visual representation of all essential components, encompassing “Candlestick Conversion”, "Candlestick Standardization", "Fractal", "Stroke", "Segment", "Pivot", and "Buying/Selling Point".
🟠 Algorithm
🔵 Step 1: Candlestick Conversion
In ChanLun, candlestick analysis focuses less on the opening/closing prices and wicks, but rather emphasizes the price range at which the stock price has reached. As a result, the initial step in ChanLun involves converting each candlestick to contain solely the high and low prices, disregarding other elements.
🔵 Step 2: Candlestick Standardization
In the second step, the converted candlesticks are standardized to ensure strict directional consistency and eliminate the presence of inner bars or outer bars. For any adjacent two candlesticks A and B where one’s price range completely encompasses another, A and B are merged into a new candlestick C. If A is trending up from its previous candle, then C will be defined such that high(C) = max(high(A), high(B)) and low(C) = max(low(A), low(B)). If A is trending down from its previous candle, then C will be defined such that high(C) = min(high(A), high(B)) and low(C) = min(low(A), low(B)).
After completing these steps, when considering any adjacent candlesticks A and B, we can always observe either of the following conditions:
1. high(A) > high(B) and low(A) > low(B)
2. high(A) < high(B) and low(A) < low(B)
The chart below illustrates how the candlesticks would appear after this step.
🔵 Step 3: Fractals
A "Fractal" refers to the pattern formed by three consecutive "standardized" candlesticks, where the middle candlestick shows a clear higher or lower value compared to the surrounding candlesticks. When considering three adjacent candlesticks, A, B, and C, we have either of the two conditions:
1. high(B) > high(A) and high(B) > high(C) and low(B) > low(A) and low(B) > low(C)
2. high(B) < low(A) and high(B) < low(C) and low(B) < low(A) and low(B) < low(C)
For #1 above, we refer to the combination of A, B, and C as a “Top Fractal”, whereas for #2 we designate it as a “Bottom Fractal”.
The chart below illustrates all the fractals, with the red triangles indicating the Top Fractals and the green triangles indicating the Bottom Fractals.
🔵 Step 4: Strokes
A “Stroke” is a line connecting a top fractal and a bottom fractal, subject to the following rules:
1. There must be at least one "free" candlestick positioned between these fractals, meaning it is not part of either the top or bottom fractal. This guarantees that a stroke encompasses a minimum range of five candlesticks from beginning to end.
2. The top fractal must have a higher price compared to the bottom fractal.
3. The endpoint fractals should represent the highest or lowest point throughout the entire span of the stroke. (There is an option within this indicator to enable or disable this rule.)
Strokes enable traders to identify and visualize significant price swings or trends while effectively filtering out minor fluctuations.
🔵 Step 5: Segments
A "Segment" is a higher-level line that connects the starting and ending points of at least three consecutive strokes, reflecting the current trend of the market structure. It continues to extend as new strokes emerge, until there is a break in the market structure. The break occurs when an uptrend forms a lower high and lower low, or when a downtrend forms a higher high and higher low. It's worth noting that during trading ranges, it is common for strokes to exhibit a higher high and lower low or a higher low and lower high pattern (similar to inner bars and outer bars). In such cases, the strokes will be merged in a similar manner as described earlier for candlesticks, until there is a distinct break in the market structure. Segments provide a relatively stable depiction of the market trend in a higher timeframe, as opposed to strokes.
It is important to note that the algorithm used to calculate segments from strokes can be recursively applied to the generated segments again, forming higher-level segments that represent the market trend on a even larger timeframe.
🔵 Step 6: Pivots
In ChanLun, the term "Pivot" does not indicate a price reversal point. Instead, it represents a trading range where the price of a security tends to fluctuate. Within a given "Segment," the pivot is determined by the overlap of two consecutive strokes moving in the opposite direction of the segment. When two downtrend strokes A and B form a pivot P within an uptrend segment S, the upper and lower bounds of the pivot are defined as follows:
1. upper(P) = min(high(A), high(B)
2. lower(P) = max(low(A), low(B))
The pivot range is typically where consolidation occurs and where there is a high trading volume.
If a future stroke, moving in the opposite direction of the current segment, overlaps with the upper and lower bounds of the pivot, it is merged into the existing pivot and extends the pivot along the x-axis. A new pivot is formed when two consecutive strokes moving in the opposite direction of the current segment, intersect with each other without overlapping the previous pivot.
Likewise, pivots can also be recursively identified within the higher-level segments. The blue boxes below represent the "Segment Pivots" that are identified within the context of higher-level segments.
🔵 Step 7: Buying/Selling Points
There are three types of buying/selling points defined in ChanLun.
1. Type 1 Buying and Selling Points: Also known as trend reversal points. These points are where the old segments terminate and new segments are generated.
2. Type 2 Buying and Selling Points: Also known as trend continuation points. These points occur while the price is in the midst of a trend and signify the continuation of the trend. In an uptrend, the Type 2 buying point is the rebound point after the price retraces to a previous low or support level, indicating that the price may continue to rise. In a downtrend, the Type 2 selling point is the pullback point after the price rallies to a previous high or resistance level, indicating that the price may continue to decline.
3. Type 3 Buying and Selling Points: These points indicate the retests of breakouts from pivot ranges. The presence of these retest points suggests that the price has the potential to continue its upward/downward movement above/below the pivot levels.
A discerning reader may notice that these buying/selling points are lagging indicators. For example, by the time a new segment is confirmed, multiple candlesticks have already occurred since the type 1 buying/selling point of that segment.
Indeed, it is true that the buying/selling points lag behind the actual market movements. However, ChanLun addresses this issue through the utilization of multi-timeframe analysis. By examining the confirmed buying/selling points in a lower timeframe, one can gather additional confidence in determining the overall trend of the higher timeframe.
🔵 Step 8: Divergence
Another core technique in ChanLun is the application of divergence to anticipate the emergence of type 1 buying/selling points. While MACD is the most commonly employed indicator for detecting divergence, other indicators such as RSI can also be utilized for this purpose.
🟠 Summary
In essence, ChanLun is a robust approach to technical analysis that integrates the careful examination and interpretation of price charts, the application of technical indicators and quantitative tools, and a keen attention to multiple timeframes. Its objective is to identify prevailing market trends and uncover potential trading prospects. What sets ChanLun apart is its holistic methodology, which blends both qualitative and quantitative analysis to facilitate informed and successful trading decisions.
🟠 NOTE
The freely available "ChanLun | AlgoTrader" script, published by the same account, incorporates only a limited set of fundamental concepts from ChanLun.
In contrast, this script is a premium invite-only version that represents a comprehensive implementation of the complete ChanLun methodology, specifically tailored for more experienced and professional traders.
________________________________________________________________________________
该指标严格按照缠论原文实现了包括“K线标准化”、“分型”、“笔”、“线段”、“中枢”和“买卖点”在内的所有关键元素。它旨在为缠友们提供一个准确可靠的缠论实现,以便快速而精准地分析市场,从而获得更优秀的交易业绩。
该指标的主要特点如下:
1. 实时标记所有缠论元素:该指标具备实时识别和标记分型、笔、线段、中枢和买卖点的功能,提供清晰的信号和准确的趋势判断。
2. 多种笔段算法选择:提供三种不同的笔算法(“老笔”、“新笔”和“4K”)以及两种线段算法(“特征序列”和“1+1终结”),满足不同交易者个性化需求,可根据偏好和策略选择最适合的算法。
3. 三级别联立:指标同步计算并显示笔、线段和递归高级段,提供更全面的市场动态分析。
4. 自定义颜色:用户可以根据个人喜好和需求自定义指标的颜色方案,与图表风格和视觉需求完美匹配。
5. 完美实现K线回放功能:指标充分利用了K线回放功能,让交易者能够回顾和分析历史市场数据,提高对市场趋势的研究和理解,增强市场洞察力和决策能力。

TTF SMC ToolkitGreetings and welcome to another community indicator from TTF! This indicator is our attempt to build a suite of tools for use in Smart Money Concepts (SMC) and Price Action style trading strategies. If you aren't familiar with these models, we'd encourage you to do some independent research on them to find out how to properly use these models and the tools included in this indicator.
Important! To utilize all features of this indicator fully, please select "Bring to front" under the visual order menu.
All of the fundamental concepts of this toolkit revolve around smart money concepts and price action trading, here are some key concepts of this indicator's different features:
DR (defining range): This is a technique that uses the candle wicks (high and low of price) during a specific hour of a trading session to create a trading framework to help visualize order flow. When price breaks the high of the range, there is a very high statistical probability based on price action history, that the bottom of the range won't be traded past for the rest of that trading session. Vice versa for price breaking the low of the range.
IDR (implied defining range): Similar to DR above, this method uses the candle body (open and close of price) of price during a specific hour of a trading session to help create a trading framework to help visualize order flow.
Equilibrium: Any range can be objectively divided into a top and bottom half. The equilibrium represents the 50% mark between a range high and a range low. It is most often plotted with a fibonacci tool.
Fair Pricing Model: This is a hypothesis postulating that "big money" (a.k.a. "market movers", "institutional investors", etc.) seeks to buy in the discount area of any given price range, and sell in the premium area of that same range. See DR and IDR for examples of possible techniques to help identify and define the price range to apply to this model.
Non-discretionary Levels: This is essentially a fancy way of saying that the levels drawn by this indicator are strictly rules-based, and will always behave in the following manner:
1. For a given trading session, once the levels are drawn, they will remain constant throughout the rest of the trading session, no matter what price does afterwards.
2. The levels drawn will be drawn using the same rules every single day, without human bias or discretion.
Williams Fractals: This fractal pattern is based upon a specific candlestick pattern sequence. For a bullish Williams fractal, you will see X number of falling candles, followed by X number of rising candles. The candle at the fulcrum (bottom or top of the fractal structure) is where the fractal will print. a bearish fractal will be the inverse of this pattern. Note that this is a lagging indicator as it takes X candles after the fulcrum candle for the fractal pattern to complete. In most common cases, the value of X is 2 (2 falling candles, the fulcrum candle, and 2 rising candles) for a total of 5 candles to complete the fractal pattern. You can find more information in this article, which describes this type of fractal: www.investopedia.com
Fractal Wyckoff Accumulation/Distribution: The Wyckoff Method is used by investors and traders to determine market trends, select investments, and time the placement of trades. It can help them identify the times at which big players are accumulating (or distributing) positions in a security. Fractal Wyckoff accumulation/distribution refers to watching the process occur on a lower timeframe, from a higher timeframe. For more information on the Wycoff Theory, you can see this article: www.investopedia.com
Now that we've covered some terms and definitions, let's cover the 4 major components included in this indicator.
ICT NY Midnight/NY Open (08:30 NY time):
The first piece of the indicator being displayed here is the ICT midnight and 8:30am NY price lines. These lines can be used as non-discretionary levels, or as intra-day premium/discount as part of a fair-pricing model.
DR/IDR:
Initially developed by TheMas7er, DR stands for defining range, and it highlights a range during high volume periods of the day that can act as non-discretionary levels, with very high historical accuracy.
Williams Fractals
Williams Fractals denote fractal market structure, and can be used to mechanically create ranges and view potential liquidity pools in a similar manner to using pivot points.
Triple M:
This tool highlights wicks that represent fractal Wyckoff accumulation and distribution. This pattern can be used an a potential entry trigger when paired with other confluences.
And now that we've covered the core concepts/definitions and an overview of each major component of this indicator, it's time to bring everything together by giving an example of how these tools can be used to define a strategy.
Before NYSE open, turn on the price lines to get a sense of whether price is in the premium or discount of the daily fair-pricing model.
Once NYSE market opens, wait for DR/IDR to establish and break its range.
If the bias from DR/IDR aligns with the fair pricing model from the ICT price lines, you could look for a fractal Wyckoff entry during a retracement.
Disclaimer: This strategy is provided purely as an example and has not been tested by us. Please do your own due diligence by thoroughly backtesting and forward-testing on a demo account befor using any proposed strategy live market with real money!
Important! To utilize all features of this indicator fully, please select "Bring to front" under the visual order menu.

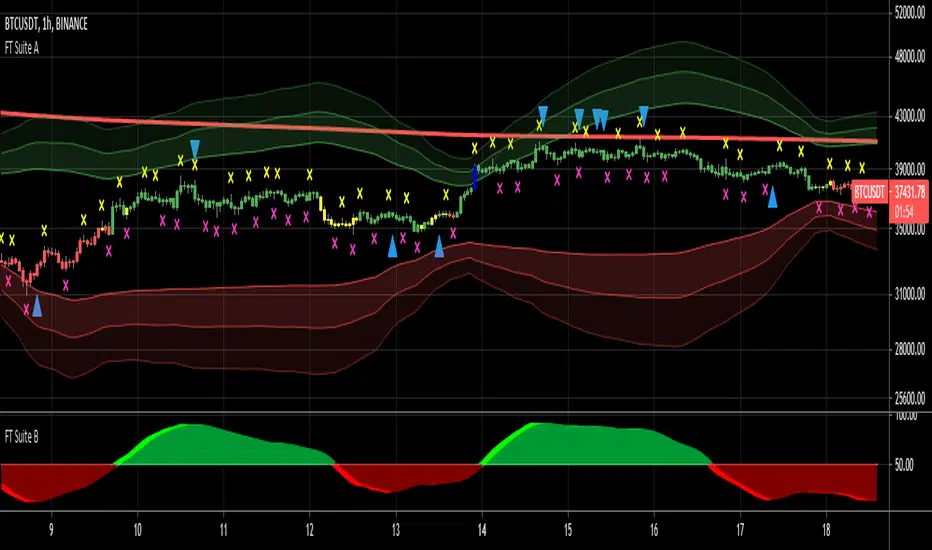
FieryTrading Suite AThis trading suite offers a complete package to traders, both long- and short-term. The idea here is that by combining FieryTrading Suite A and B, one can get a better grip on the markets, thus making more profitable trades. This trading suite is suited for all time frames and assets. Ideally one would combine this trading suite with their own strategies or indicators.
This indicator pack consists of several parts and offers quite some customization.
// FieryTrading Suite A
Bar Trend: the bars will get colored according to the current, short-term, trend. Green is bullish, red is bearish and yellow is neutral. By tweaking the Bar Trend Length one can make the bar trend more or less responsive. Higher lengths are better for long term trading, whereas a shorter length is better for short-term or scalping.
MTF EMA: this is actually two indicators in one. First, we have the EMA on the chart, which is a general current trend indicator. Above the EMA means bullish, under the EMA means bearish. This EMA is also colored according to the long-term trend, which gets pulled from a higher time-frame. Green means long term bullish, red long-term bearish, yellow neutral.
Overshoot Area: the green and red bands around the price are areas where the price might potentially reverse from. This works exceptionally well in consolidating (horizontal) markets. The wider the overshoot area, the stronger the trend. A very tight overshoot area might indicate that the price will soon make a strong move. Increase the overshoot length to make it better suited for long-term. Decrease the length for better detection of small moves.
Extra’s:
1) Extreme bars: when turned on, the bars will color blue if the price reaches a potential strong area of reversal or consolidation. Blue bars are also great areas to exit your current position. Increase the Extreme Multiplier in case you want it less responsive. Decrease the multiplier to quicker spot extreme bars, but with a higher margin of error.
2) FieryTrend: due to its popularity, I’ve decided to included my FieryTrend indicator in the Trading Suite. It’s a great tool to manually find trend lines, resistances and supports. See my FieryTrend indicator for more info.
3) Fractals: when turned on, this option will display fractals on the chart. These fractals are mainly used for stop-loss determination, but can be used for other strategies as well.
4) FT B Reversal: when turned on, this will place reversals of the FieryTrend Suit B on the chart. Make sure to keep the inputs of the FT B indicator the same on both the A and B suite. It might trigger some false-positives, don’t trade this blindly. Wait for the lighter color to completely disappear behind the darker one on FT B.
Alerts: Alerts can be created for Extreme Bars, Bar Trend and FieryTrading Suite B Reversals. Bar trend currently triggers an alert of every bullish / bearish bar, want to make it trigger once in the future, but I’m encountering an unknown bug.
// FieryTrading Suite B
This oscillator tries to give traders an idea of the current trend, as well as trend reversals. The higher the lengths, the bigger the potential trends can become. Be aware that higher lengths are less responsive to market movements. The default inputs are best for most traders. Alerts for this indicator can be made in the FT Trading Suite A, indicated by the blue up / down triangles.
// Potential strategies
There are several potential strategies that one can follow by just looking at the chart. Here are some examples:
1.0 For longer term trades one could simply trade the bar colors. Buy when the bar goes green, sell when it goes red.
1.1 You could exit the trade at either an Extreme Bar or when the price enters the Overshoot Area
1.2 During bullish trends (green bars, green MTF EMA), you could spot potential entries with the FieryTrading Suite B. Enter on every dip on the oscillator. Inverse would be true for shorts.
2.0 You could trade the FT B Reversals during their respective trend. So, trade bearish reversals during a red MTF EMA, bullish reversals during a green MTF EMA.
Never trade one indicator naked. Always use other indicators to confirm your bias.
For take-profit and stop-loss selection I would generally advise to look at the most recent fractal and place the stop above / below the fractal bar. Bullish trades should look at the pink fractal, bearish trades at the yellow fractal. When no fractal is available, look at the reversal bar and apply the same strategy.
For short term trades I’d advise a risk-reward of 1.5, longer term 2 – 2.5.
See the screenshots below for a couple of examples.
For access, please take a look at the "Author's Instructions" below.
Chan Theory - Chanlun UltraChan Theory -Chanlun Ultra
Overview
This script is based on the core technical framework of Chan Theory, transforming complex market fluctuations into a multi-layered, quantifiable structural analysis system. Through real-time dynamic computation, it automatically parses key components in price movements such as fractals, pens, segments, and pivot zones. Integrated with momentum analysis and trading signal alerts, it provides traders with comprehensive market insights from micro to macro perspectives. The core distinction of Chan Theory from traditional technical indicators lies in its rigorous recursive logic and human-centric market philosophy. This script faithfully restores Chan Theory's essence of "using Zen to resolve market complexity," decomposing spiral price movements into an orderly trading decision system.
Technical Principles
This indicator implements the complete recognition process from candlesticks to fractals, pens, segments, and pivot zones using pure Pine Script under Chan Theory's framework. Core technical implementations include:
1. Candlestick Containment Processing
Employs specific algorithms to handle candlestick containment relationships, eliminating random noise:
In uptrends: Select the higher high and higher low values
In downtrends: Select the lower high and lower low values
Ensure complete elimination of containment through recursive processing
2. Fractal Identification System
Performs strict fractal judgment on processed candlesticks:
Top Fractal: The middle candlestick's high is higher than both adjacent candlesticks
Bottom Fractal: The middle candlestick's low is lower than both adjacent candlesticks
Validate fractal effectiveness via the filterOperateType function
3. Pen Construction Mechanism & Type Selection
Connects valid top/bottom fractals to form pen structures, offering four pen types:
Classic Pen: Traditional Chan Theory definition, strictly following classic rules
Optimized Pen: Enhanced algorithm for short-term volatility recognition
4K Pen: Builds pens based on fractals formed by at least 4 candlesticks (improves stability)
Strict Pen: Employs the most stringent validation conditions for reliability
4. Segment Partitioning Algorithm
Applies segment rules to pen sequences with three modes:
- Dynamic Real-time Progressive Correction: Adjusts forming segments continuously with new data
- Strict Mode: Fully complies with Chan Theory definitions
- Extension Mode: Flexible handling of trend developments
5. Pivot Zone Recognition Technology
Identifies pen-level and segment-level pivot zones
Calculates pivot zone price ranges and time durations
Analyzes pivot zone evolution characteristics
Supports display of pivot zones across different levels
Trading Signal System & Filters
Trading Signal Filtering System
This indicator provides comprehensive filtering functions:
Fractal Validity Filter: Verifies fractal patterns and post-fractal developments
Basic Fractal Filter: Eliminates non-compliant fractals through basic feature checks
Type I MACD Divergence Filter: Enhances Type I signal reliability via MACD divergence analysis
Type II Signal Filter: Custom conditions for Type II signals
-False Signal Trap Avoidance: Detects and bypasses deceptive price patterns
Chan Theory Trading Signal Principles
Type I Signals (Trend Reversals)
Principle: Forms when price makes new highs/lows with weakening internal momentum (divergence)
Identification: Compares structural features of adjacent same-direction pens
Application: Early trend reversal signals for swing trading
Type II Signals (Pullback Entries)
Principle: Occurs during retracements as sub-level reversal signals
Identification: Determined by pivot zone support/resistance and fractal combinations
Application: Optimal positions for pullback trades with controlled risk
Type III Signals (Breakout Confirmations)
Principle: Confirms pivot zone breakouts
Identification: Price breaks prior pivot zone boundaries with valid fractals
Application: Trend continuation signals for trend-following strategies
Indicator Features
Multi-Level Structural Analysis
Distinguishes structures across levels via level parameters
Higher-level trends guide lower-level operations
Implements cross-level collaborative logic
Displays sub-level pivot zones
Structural Visualization
Pens: Displayed per selected pen type
Segments: Rendered according to chosen segment mode
Pivot Zones: Color gradients indicate consolidation strength
Technical Implementation
Data Structure Design
Pen Object: Stores direction, timestamps, and price attributes
Segment Object: Manages segments and constituent pens
Pivot Object: Defines pivot zone ranges and characteristics
Grade Object: Organizes analysis results across levels
User Guide
Parameter Settings
Pen Type: Classic/Optimized/4K/Strict (adapt to analysis needs)
Segment Mode: Dynamic/Strict/Extension (match trading strategies)
Signal Filters: Enable/disable specific filters
Pivot Display: Toggle sub-level pivot zones
Divergence Settings: Configure types (regular/hidden) and display styles
Strategy Settings: Set trading rules linked to signals
Strategy Configuration
Follow Segments: Trade in alignment with segment direction
Signal Participation: Enable/disable Type I/II/III signals
Signal Conditions: Require signals to appear post-pivot zone formation
Prevent Early Entries:
Type I signals require ≥1 pivot zone or 5 pens
Type II Safety Control: Participate only if Type III signals are absent
Practical Recommendations
Select pen types/segment modes per market conditions
Adjust filters for different instruments and timeframes
Enhance accuracy through multi-level analysis
Confirm Type I signals with divergence indicators
Choose strategy parameters aligned with risk tolerance
Value Proposition
Systematizes Chan Theory into computable structures
Multiple pen/segment methods adapt to diverse markets
Advanced filtering significantly improves signal quality (historically validated)
Multi-level analysis provides holistic market insights
This tool is for technical analysis only. It does not constitute investment advice. Users must exercise independent judgment based on personal risk tolerance and objectives.
概述
本脚本基于缠论核心技术框架,将复杂的市场波动转化为多层次、可量化的结构分析系统。通过实时动态演算,自动解析价格走势中的分型、笔、线段、中枢等核心组件,并融合动量分析与交易信号预警功能,为交易者提供从微观到宏观的全方位市场透视。缠论区别于传统技术指标的核心在于其严格的递归逻辑与人性化市场哲学,本脚本忠实还原缠论"以禅破缠"的思想精髓,将螺旋缠绕的价格运动分解为有序的交易决策体系。
技术原理
本指标基于缠论技术分析框架,通过纯Pine Script实现了从K线到分型、笔、线段和中枢的完整识别流程。核心技术实现包括:
1. K线包含处理
采用特定算法处理K线包含关系,消除随机波动干扰:
- 上涨趋势中取高点高值、低点高值
- 下跌趋势中取高点低值、低点低值
- 通过递归处理确保包含关系完全消除
2. 分型识别系统
在处理后的K线基础上实现严格的分型判断:
- 顶分型:中间K线高点高于两侧K线
- 底分型:中间K线低点低于两侧K线
- 通过`filterOperateType`函数实现分型有效性验证
3. 笔的构建机制与类型选择
连接有效顶底分型形成笔结构,提供四种笔类型选择:
- **老笔**:传统缠论笔定义,严格遵循经典规则
- **新笔**:优化算法,增强对短期波动的识别能力
- **4K**:基于至少4根K线形成的分型构建笔,提高稳定性
- **严笔**:采用最严格的条件验证,确保形成的笔结构可靠
4. 线段划分算法
基于笔序列应用线段划分规则,支持三种线段模式:
- **当下延伸后修正**:实时计算当前形成中的线段,并随新数据更新修正
- **严格模式**:要求线段完全符合缠论定义,减少假信号
- **延伸模式**:更灵活地处理线段延伸情况,适合趋势分析
5. 中枢识别技术
- 实现笔中枢和线段中枢识别
- 计算中枢价格区间与时间范围
- 分析中枢演变特征
- 支持显示不同级别中枢功能
买卖点系统与过滤机制
买卖点过滤系统
本指标提供全面的买卖点过滤功能:
- **买卖点分型过滤**:检验分型形态有效性,验证分型后续发展
- **买卖点分型基础过滤**:针对分型基本特征进行验证,排除不合格分型
- **1买卖macd背驰过滤**:通过MACD判断背驰情况,提高一类买卖点可靠性
- **2买卖点过滤**:专门针对二类买卖点的过滤条件
- **防狼术**:避免陷阱式买卖点,提高交易安全性
缠论买卖点原理
1. **一类买卖点**
- 原理:基于趋势背驰原理,当价格创新高/低但内部结构力度减弱时形成
- 识别方法:通过比较相邻同向笔的结构特征判断力度变化
- 应用:提供趋势可能反转的早期信号,适合波段操作
2. **二类买卖点**
- 原理:发生在回调过程中,属于次级别转折信号
- 识别方法:通过中枢支撑位与分型组合判断
- 应用:回调买入或做空的较佳位置,风险相对可控
3. **三类买卖点**
- 原理:中枢突破确认信号
- 识别方法:价格突破前中枢边界并形成有效分型
- 应用:趋势延续的确认信号,适合追踪趋势
指标特点
多级别结构分析
本指标支持多级别联动分析:
- 通过级别参数区分不同级别结构
- 高级别趋势指导低级别操作
- 实现级别间的协同判断逻辑
- 支持显示次级别中枢功能
结构可视化
- 笔结构:根据选择的笔类型显示
- 线段结构:按照选定的线段模式呈现
- 中枢区域:颜色渐变标识不同强度
技术实现说明
数据结构设计
指标设计了完整的面向对象结构:
- Pen结构:存储笔的方向、时间、价格等属性
- Segment结构:管理线段及其组成笔
- Pivot结构:表示中枢范围和特性
- Grade结构:区分不同级别的分析结果
使用指南
参数设置
- 笔的类型:选择老笔、新笔、4K或严笔以适应不同分析需求
- 线段模式:根据交易策略选择合适的线段计算方式
- 买卖点过滤:根据需要启用不同的过滤机制
- 中枢显示:选择是否显示次级别中枢
- 背离设置:选择背离类型、显示方式和样式
- 策略设置:配置与买卖点相关的交易策略选项
策略应用配置
- 跟随线段:根据线段方向进行交易
- 买卖点参与设置:可选择性参与一类、二类和三类买卖点
- 买卖点条件限制:可设置买卖点需要在中枢形成后出现
- 防止过早进场:可要求一类买卖点至少出现一个中枢后或至少5笔后才参与
- 二类买卖点安全性控制:可选择仅在未出现三类买卖点的情况下参与
实际应用建议
- 结合市场环境选择合适的笔类型和线段模式
- 针对不同品种和时间周期调整过滤设置
- 通过多级别分析提高判断准确性
- 使用背离指标确认一类买卖点的有效性
- 根据策略风格选择适合的策略配置参数
技术特点与价值
本指标通过系统化实现缠论结构分析,提供了一种客观的技术分析工具。它的核心价值在于:
1. 将复杂的缠论理论系统化为可计算的结构
2. 提供多种笔、线段判断方法以适应不同市场环境
3. 完善的买卖点过滤系统大幅提高信号质量
4. 多级别联动分析提供全面市场视角
*本指标仅提供技术分析参考,不构成投资建议。用户应根据自身风险承受能力和投资目标进行判断。*

AP13Indicator “AP13”
Class : oscillator
Trading type : intraday
Time frame : 5 min – 15 min
Purpose : search for reverse points
Level of aggressiveness : aggressive
Indicator «AP13» is based on the Fractal Market Hypothesis. According to this hypothesis each price movement can be represented in form of a set of self-similar structures – fractals. To identify fractals in this indicator elements of Bill Williams’s trading system are used (see “Trading Chaos” by Bill Williams for details). They allow identifying local bottom and local top of the price movement.
Accordingly, when you know that price has reached the bottom (or top), you have enough information to build a trading strategy based on these signals: buy from the bottom and sell from the top. The novelty of this indicator is filtration of the fractals: only those ones which are in the current trend direction are displayed. As the result the quality of the signals from the indicator «AP13» is much higher comparing with classical fractal analogues.
Structure of the indicator
Indicator consists of the following elements:
- Triangles with titles – blue ones with “BUY” title and red ones with “SELL” title to indicate according trading signals;
- Red lines – stop-loss lines – lower line for the “buy” trades, upper line for the “sell” trades;
- Lime and orange lines – trend lines used to identify the current tendencies.
Input parameters of the indicator
To set up the indicator a number of input parameters are used:
- Averaging Period – regulates the level of aggressiveness of the indicator – the less the parameter is more signals are generated;
- Stop multiplier – this parameter is used to detect stop-loss values. The higher the parameter is the bigger the stops are.
Rules of trading
Signal for “buy” is generated when a blue triangle with title “BUY” appears on the chart. Signal for “sell” is generated when a red triangle with title “SELL” appears on the chart.
For short (“sell”) positions stop-loss should be set above the upper red line. For long (“buy”) positions stop-loss should be set below the lower red line.
Take-profit is set near the previous fractal or position is closed when the opposite signal appears on the chart. One more possible option is to close position after certain period of time (for example a few candles after its opening).

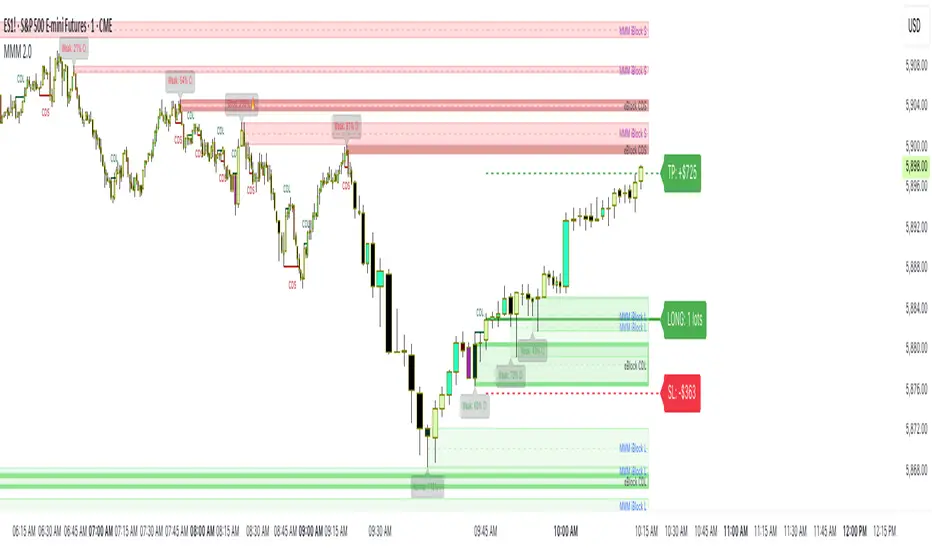
MMM @MaxMaserati 2.0MMM @MaxMaserati 2.0 - TradingView Indicator
The Backbone of the Max Maserati Method
The MMM @MaxMaserati 2.0 indicator is the core of the proprietary Max Maserati Method (MMM), a trading system designed to decode institutional price action. It integrates candle bias analysis, market structure identification, volume-based signals, and precise entry zones to align traders with smart money.
Core Components of the MMM System
1. Six Core Candle Classifications
Master these patterns to reveal institutional behavior:
Bullish Body Close: Closes above previous high, signaling strong buying.
Bearish Body Close: Closes below previous low, indicating intense selling.
Bullish Affinity: High tests previous low, closes within range, showing hidden bullish strength.
Bearish Affinity: Low tests previous high, closes within range, reflecting bearish pressure.
Seek & Destroy: Breaks both previous high/low, closes inside, direction depends on close.
Close Inside: High/low within previous range, bias based on close.
2. Plus/Minus Strength System
Quantifies candle conviction:
Bullish Strength: Low to close distance.
Bearish Strength: High to close distance.
Plus (+): Dominant strength signals strong follow-through.
Minus (-): Balanced strengths suggest caution.
3. PO4 Candles (Power of OHLC (4))
Analyzes OHLC for body-closed candles after swing high/low fractals:
C2: Body close above high/below low post fractal with strength conditions.
C3: Stronger body close with pronounced low/high breakouts.
C4: Body close which show strength and might trigger a BeB/BuB
Visualization: Green (bullish), purple (bearish) bars; triangle markers for fractals.
4. MC2 (High Volume Reversal Candles)
High buy/sell volume candles reversed by opposing volume:
Bullish MC2: Buy volume flipped by sell volume, signaling exhaustion.
Bearish MC2: Sell volume flipped by buy volume, indicating reversal.
Visualization: Dark green (bullish), dark red (bearish) bars.
5. MMM Blocks (eBlocks and iBlocks)
Marks institutional order blocks:
External Blocks (eBlocks): At market structure changes (MSC), labeled BuB/BeB.
Internal Blocks (iBlocks): Within trends, labeled L/S.
Volume: Normalized with indicators (🔥 high, ↑ above average, ↓ low).
Filters: Discount (0-50), premium (50-100), extreme (0-20, 80-100), mid-range (20-50, 50-80).
6. Entry Blocks - Specific Entry Areas
Entry Blocks are precise zones for framing trades based on the MMM system, triggered post-MSC to capitalize on institutional momentum:
Purpose: Pinpoint high-probability entry areas following a Market Structure Change (MSC), aligning with smart money direction.
Formation:
MMM Entry Block Long: Forms after a bullish MSC (BuB), typically at the swing low (e.g., lowerValueMSC) of the fractal pattern, marking a long entry zone.
MMM Entry Block Short: Forms after a bearish MSC (BeB), typically at the swing high (e.g., upperValueMSC), marking a short entry zone.
Styles :
Close-to-Swing High/Low: Box drawn from the candle’s close to the swing high/low level, emphasizing the fractal pivot.
High/Low-to-Close: Box drawn from the candle’s high/low to its close, capturing the full price action range.
Visualization:
Labeled “MMM Entry Block Long” (cyan background/border) or “Short” (pink background/border).
Includes a dashed midline for reference.
Volume displayed if enabled, normalized with markers (🔥 >150%, ⚡ >120%, ❄️ <70%).
Behavior:
Deletes when price touches the level (On Level Touch) or closes beyond it (On Candle Close)
Limited to a configurable number ( default 5) to avoid clutter.
Trade Framing:
Entry: Enter within the eBreak box, ideally on a pullback or confirmation candle aligning with MMM bias (e.g., Bullish Body Close or Affinity).
Stop-Loss: Placed below the eBreak low (bullish) or above the high (bearish), leveraging the swing level as support/resistance.
Take-Profit: Targets higher timeframe high (bullish) or low (bearish), with ratio (default 2.0) for risk-reward.
MMM Integration: Use candle bias (Plus/Minus), PO4 signals, and MMPD consensus to confirm entry direction and strength.
Significance: eBreaks frame trades by isolating institutional entry points post-MSC, reducing noise and enhancing precision.
7. Market Structure Change (MSC)
Tracks structure shifts:
Detection: Fractal highs/lows with adjustable candle count.
Visualization: Green (BuB), red (BeB) lines/labels; numbered breaks (Bub1/Beb1).
Counter: Tracks consecutive MSCs for trend strength.
8. MMPD (Market Momentum Price Delivery)
Analyzes momentum/trend:
Conditions: Red (bearish), Green (bullish), Pink (modifying bearish), Pale Green (modifying bullish).
Traps: Flags bullish/bearish traps when MMPD conflicts with body close.
Metrics: SuperMaxTrend, momentum (K/D), MMPD level.
Consensus: Rated signals (e.g., “Very Strong Buy ★★★★★”).
9. Trade and Risk Management
Disciplined trading:
Entry Visualization: Entry, stop-loss, take-profit lines/labels with customizable risk (riskAmount, default $50) and reward (ratio).
Behavior: Shows last/all entries, removes on MSC shift or breach.
Text Size: Tiny, Small, Normal.
NB: The Trade and risk management is to use with caution, it is not fully implemented yet.
10. Stats Table
Real-time dashboard:
Elements: Timeframe, symbol, candle bias, strength, MMPD, momentum, SuperMaxTrend, MMPD level, volume, consensus, divergence, delta MA, price delivery, note (“Analyze | Wait | Repeat”).
Customization: Position, size, element visibility.
Colors: Green (bullish), red (bearish), orange (warnings), gray (neutral).
11. Delta MA and Divergence
Monitors volume delta:
Delta MA: Smoothed delta with direction arrows (↗↘→).
Divergence: Flags MMPD-momentum divergences (⚠️).
Key Features
Automated Analysis: Detects PO4, MSC, blocks, MC2, Entry Block via OHLC.
Color-Coded Visualization: Bars, lines, table cells reflect bias/strength.
Dynamic Bias Lines: Higher timeframe high/low lines with labels.
Volume Analysis: Normalized volume across blocks, entries, MC2.
Flexible Filters: Tailors block/entry Block display to strategies.
Real-Time Metrics: Tracks strength, delta, trend points.
Trading Advantages
Institutional Insight: Decodes manipulation via OHLC and volume.
Early Reversals: Spots shifts via PO4, MC2, MSC, Entry Blocks.
Precise Entries: entry block frame high-probability trades.
Robust Risk Management: Stop-loss, take-profit, risk-reward.
Simplified Complexity: Actionable signals from complex action.
Profit Target Framework
Bullish: Higher timeframe high.
Bearish: Higher timeframe low.
Plus Strength: Direct move.
Minus Strength: Pullbacks expected.
Entry Blocks/MSC-Driven: Entry anchor entries to MSC targets.
Trader’s Mantra
“Analyze | Wait | Repeat” - Discipline drives profits.
The MMM @MaxMaserati 2.0 indicator, with Entry Blocks as specific trade-framing zones, offers a professional-grade framework for precise, institutional-aligned trading.
Note: Based on the proprietary Max Maserati Method for educational and analytical use.
Chanlun FBFD pen czsc Channel Chan Theory
🏆 Chan Zhong Shuo Chan FBFD Pure Segment Version Indicator - Flagship Edition
Background
A decade of craftsmanship, a significant upgrade
This Chanlun indicator has undergone nearly 10 years of meticulous refinement and continuous optimization. Since its initial design in 2015, it has been validated through actual trading. Now newly upgraded and launched on TradingView, it offers more comprehensive functions and superior performance.
It truly implements all core theories from the original Chanlun text, including a complete system of K-line inclusion, fractal recognition, pen and segment analysis, center theory, pure pen and segment division (classification of the first and second cases in the original text), divergence and reversal, providing professional and comprehensive technical analysis tools for Chanlun enthusiasts in the industry.
Chinese Translation for User Indicator Interface:
● 顶背离: Top Divergence
● 底背离: Bottom Divergence
● 顶背驰: Top Divergence Including Trend Structure
● 底背驰: Bottom Divergence Including Trend Structure
📦 Parameter Settings
● Number of K-lines to calculate: Up to 5000, which is the maximum data available even for free TradingView users
● Pen detail parameters: Old/new pens, sub-high/low pens, high/low pens, strict pens can be adjusted and selected according to the target numbers
● Segment detail parameters: Adjustable
● MA and Bollinger Bands display parameters: Check to display, uncheck to hide as needed
● Center price and pen/segment price display: Check to display, uncheck to hide as needed
● MACD parameters: Can be adjusted as needed, including fast, slow, and signal line period settings
● MA parameters: Default parameters can be manually adjusted
● Pen divergence, segment divergence, pen-segment reversal display: Check to display, uncheck to hide as needed
● Pen-segment divergence and reversal alerts: Disabled by default, can be enabled by checking. Then in TradingView's alert interface, select the indicator in conditions, set "Any alert() function call", set notification type, and create the alert to receive notifications
🔥 Integration of other commonly used indicators and reasons:
✅ Moving Averages: Since Chanlun uses MA overlay analysis, this makes it more convenient for users to analyze trends from different perspectives, so it's essential to add
✅ Bollinger Bands: Bollinger Bands channel, combined with Chanlun, can also provide more perspectives for trend analysis and improve accuracy, so it's also added
✅ MACD: This is an indispensable indicator for analyzing trend strength in Chanlun theory, so it must be integrated for convenient analysis
✅ Chanlun ZSLX pen czsc Channel Chan Theory and Chanlun FBFD pen czsc Channel Chan Theory scripts share some underlying source code and must be integrated because:
The underlying K-line inclusion, MACD divergence and reversal, K-line objects, and pen parts in the original Chanlun text are the same, but the top-level segment and trend recursion division principles, display effects, and functions are significantly different. Additionally, TradingView community has source code quantity restrictions, making it impossible to fully integrate the two versions into one. Therefore, the kxian object returned by the Start_kxian function, the bi object returned by the Start_bi function, the source code for drawing K-line centers in showKxianzsfunc, and the MACD divergence and reversal judgment code in this script will have integrated parts with the same source code.
🎯 Technical Principles
🔥 1. Comprehensive coverage of original Chanlun functions
✅ Multi-level center combination - pen centers, K-line centers, segment centers
● Chanlun K-line centers: The lowest level Chanlun centers
● Chanlun pen centers: Pen center division intervals from the original text, taking the lowest point of the overlapping part as the high point and the highest point of the overlapping part as the low point
● Chanlun segment centers: Segment center division intervals from the original text, taking the lowest point of the segment overlapping part as the high point and the highest point of the segment overlapping part as the low point
✅ Divergence and reversal warning - divergence and reversal algorithm
● Principle: Adopts MACD strength statistics from the original Chanlun text, distinguishes between divergence/reversal in pen structures and segment structures, marks specific values on the graph, differentiates MACD strength between pens and segments. This will be further upgraded with more complex statistics in the future, but currently serves as a reference for the current cycle. Specific analysis still requires multi-cycle strength analysis.
✅ Original two-level pure segmentation - exclusive algorithm
● Principle: Strictly follows segment division from the original text, distinguishing between the first and second cases, as well as special fractal inclusion processing for the second case, and segment rules. Some segments may not end at the highest or lowest points.
✅ Real-time K-line inclusion processing - intelligent recognition of inclusion relationships
● In rising K-lines, take the higher high and higher low values (take the higher among highs)
● In falling K-lines, take the lower high and lower low values (take the lower among lows)
✅ Accurate fractal marking - automatic recognition of top and bottom fractals
● By setting the old/new pen parameter to 2, the high and low points of each top and bottom fractal will be drawn
● Top fractal: Among three K-lines, the middle K-line has a higher high and a higher low than both sides
● Bottom fractal: Among three K-lines, the middle K-line has a lower low and a lower high than both sides
✅ Multi-dimensional pen and segment analysis - complete system of pens and segments
● Old pens: Traditional strict pen definition in Chanlun, consistent with the original text
● New pens: Traditional new pen definition in Chanlun, meeting the relaxed pen conditions in the original text
● Fractal pens: Pens formed by top and bottom fractals, with sensitive price response (many peers mark fractal pens of this cycle as sub-level)
● Segments: This version adopts a recursive approach, treating some pens as segments in certain places. Most places are the same as pure segmentation, but with different line-drawing principles
✅ Multi-level center combination - K-line centers, pen centers, segment centers
● K-line centers: The smallest level Chanlun centers
● Pen centers: Adopt pen center division intervals from the original text, taking the lowest point of the overlapping part as the high point and the highest point of the overlapping part as the low point
● Segment centers: Adopt segment center division intervals from the original text, taking the lowest point of the segment overlapping part as the high point and the highest point of the segment overlapping part as the low point
⚙️ Indicator Features
⚙️ 1. Diversified pen and segment algorithm engine
🎨 Three pen algorithms: "Chanlun old pen", "Chanlun new pen", "top-bottom fractal pen", with more custom pen types to be added later
🔧 Common parameter adjustments: Equal high/low points, highest/lowest point pens, sub-high/low pens, fractal interval judgment, and other refined controls
📊 Dual segment division: Original pure segmentation + large-level segmentation
🎯 Multiple personalized parameter adjustments: Many other different parameters to meet different Chanlun enthusiasts' understanding needs and trading styles
🌟 2. Multi-level intelligent combination system
📈 Synchronous calculation and display: K-line centers, pens, pen centers, segments, large-level segments, segment center linkage analysis
🏗️ Exclusive pure segmentation algorithm: Accurately identifies first and second case segment divisions
🎪 Multi-level center system: Complete coverage of three center levels
📊 Panoramic market analysis: Provides comprehensive market dynamic insights
🎨 3. Professional visual customization
🌈 Custom color schemes - perfectly matching personal chart styles
💰 Price label display - marking of key price levels for pens, segments, and centers
📐 Professional auxiliary tools - practical functions such as moving averages and Bollinger Bands
🎁 MACD - supporting indicator in the sub-chart
⏰ 4. Perfect K-line replay support
🔄 Historical data review - perfectly supports TradingView replay function
📚 Market research tool - enhances historical trend analysis capabilities
🧠 Decision-making ability enhancement - deepens market insight and judgment level
📦 Product Versions
🥇 Version 1: Professional Segmentation Edition
Suitable for: Traditional Chanlun enthusiasts pursuing classic segmentation algorithms
Core functions:
🔸 Multiple pen algorithms: Fractal pens, new pens, old pens, sub-high/low pens, highest/lowest pens
🔸 Pen and segment detail adjustments: Massive parameters supporting various pen division schemes
🔸 Complete center system: K-line centers, pen centers, segment centers
🔸 Intelligent warning system: Divergence and reversal prompts and alarm functions
🔸 Recursive large levels: Current level and large-level segmentation analysis
**📊
💡 Peer comparison: The "professional version" functions of other platforms are just basic configurations here
🎊 Experience now and start your professional Chanlun analysis journey!
Pre-sales note: The Chan Zhong Shuo Chan theory is relatively complex. The software tries its best to implement the functions described in the original text, but there may still be some flaws that cannot be handled perfectly. These will be gradually improved in the future. Customers who are concerned about this can try it for a few days first, purchase it if they find it suitable, or treat it as a test if not. We welcome everyone to feedback problems and bugs, and the shopkeeper will update, modify, and optimize in the future when available.
1. K-line inclusion from the original text
2. Pen and segment multi-level divergence and reversal prompts
3. More than three types of pens that can be adjusted
4. Including pen and segment area strength statistics + center high and low price display
5. Three-level center (K-line center, pen center, segment center) detailed analysis
6. Multiple moving averages display
7. Commonly used superimposed Bollinger Bands
8. Original text segment division rules with 2-level segments
9. Some alarm functions designed, including divergence and reversal, with more to be added in the future
10. A total of dozens of optional parameter settings
11. Free trial
🏆 缠中说禅FBFD 纯分段版指标 - 旗舰版
背景
十年匠心,重磅升级
这套缠中说禅指标历经近10年的精心打磨与持续优化,从2015年初版设计至今,已经过实战验证。现全新升级登陆TradingView,功能更加完善,性能更加卓越。
真正实现了缠论原文中的所有核心理论,包括K线包含、分型识别、笔段分析、中枢理论、 纯分笔分段(原文第一种和第二种情况分类)、背离背驰等完整体系,为缠论爱好者提供业界专业、全面的技术分析工具。
📦参数设置
- 计算K线数量:最多计算5000根,免费tradingview用户也只能这么多数据
- 笔细节参数:新旧笔、次高低点笔、最高低点笔、严格笔 可以调整可按标的数字选
● - 线段细节参数: 调整
- 显示均线和布林线参数:根据需要设置打钩就是显示,取消打钩就是隐藏
- 显示中枢价格和笔段价格:根据需要设置打钩就是显示,取消打钩就是隐藏
- macd参数:可以根据自己需要调整参数 快 慢 信号线周期设置
- 均线参数:默认参数可以自己手动调整
- 显示笔背离、段背离、笔段背驰:根据需要设置打钩就是显示,取消打钩就是隐藏
- 笔段背离背驰报警:默认关闭可以设置打钩开启,然后在tradingview的警报界面,条件里选择指标,设置:任何alert()函数调用,再设置通知类型,然后创建报警就可以收到报警
🔥整合其他常用指标和原因:
✅均线:因为缠论里是有使用均线叠加分析,这种更方便用户从不同视角分析走势,所以必须增加
✅布林线:布林线通道,结合缠论,也可以更多的视角分析走势,提高准确度,所以也增加了
✅macd:这个是缠论分析理论里必不可少的分析走势力度的指标,所以也必须整合进来方便分析
✅Chanlun ZSLX pen czsc Channel Chan Theory这个脚本和Chanlun FBFD pen czsc Channel Chan Theory这个脚本有些底层的源码是一样的必须整合原因:
因为缠论原文底层的K线包含、macd背离背驰、K线对象和笔部分都是一样的,但是顶层的线段和走势递归两种划分原理和显示效果和功能是有很大区别,并且tradingview社区的源码量有限制,导致也无法两个版本划线完全整合成一个,所以,这个脚本里的Start_kxian函数返回的kxian对象、 Start_bi函数返回的bi 对象 、showKxianzsfunc画K线中枢部分的源码、macd背离背驰判断部分代码,会有一样的整合部分源码
🎯 技术原理
🔥 1. 全方位缠论原文功能覆盖
● ✅ 多级中枢联立 - 笔中枢、K线中枢、线段中枢
○ - 缠论K线中枢:最低级别的缠论中枢
- 缠论笔中枢:原文的笔中枢划分区间,高点取重叠部分的最低点,低点取重叠部分最高点
- 缠论线段中枢:原文的线段中枢划分区间,高点取线段重叠部分的最低点,低点取线段重叠部分最高点
● ✅ 背离背驰预警 - 背离背驰算法
○ - 原理:采用缠论原文的macd力度统计,区分笔结构的背离背驰和段结构的背离背驰,并且在图形上标上具体数值,区分笔和段的macd力度,后期这个还要继续升级更复杂的统计,仅做本周期的参考,具体也是要多周期力度分析
● ✅ 原文两级别纯分段 - 独家算法
- 原理:严格按原文的线段划分,区分第一种情况和第二种情况,以及特殊的第二种情况分型包含处理,线段规则,有的地方可能不是结束在最高最低点
● ✅ 实时K线包含处理 - 智能识别包含关系
○ - 上涨K线中取高点高值、低点高值,高高取高
- 下跌K线中取高点低值、低点低值,低低取低
● ✅ 精准分型标记 - 顶底分型自动识别
○ - 通过新旧笔参数设置2,会画出每个顶底分型高低点
○ - 顶分型:三根k线中,中间K线高点高于两侧K线,低点也高于两侧
- 底分型:三根k线中,中间K线低点低于两侧K线,高点也低于两侧
● ✅ 多维笔段分析 - 笔、线段完整体系
○ - 老笔:传统缠论严格笔定义,符合原文
- 新笔:传统缠论新笔定义,符合原文宽松笔条件
- 分型笔:顶底分型就成笔,价格反应比较敏锐(同行很多人把本周期分型笔标成次级别)
○ - 线段:这个版本采用递归思路,有的地方一笔处理成段,大部分地方跟纯分段一样,但是划线原理不同
● ✅ 多级中枢联立 - K线中枢、笔中枢、线段中枢
○ - K线中枢:最小级别的缠论中枢
- 笔中枢:采用原文的笔中枢划分区间,高点取重叠部分的最低点,低点取重叠部分最高点
- 线段中枢:采用原文的线段中枢划分区间,高点取线段重叠部分的最低点,低点取线段重叠部分最高点
⚙️ 指标特点
⚙️ 1. 多样化笔段算法引擎
● 🎨 三种笔算法: "缠论旧笔"、"缠论新笔"、"顶底分型笔",以及后面会增加更多自定义类型笔选择
● 🔧 常见参数调节: 等高低点、最高低点笔、次高低笔、分型区间判断等精细化控制
● 📊 双重段划分: 原文纯分段 +大级别分段
● 🎯 超多个性化参数调整: 还有很多其他不同参数,满足不同缠友的理解需求与交易风格
🌟 2. 多级别智能联立系统
● 📈 同步计算显示: K线中枢、笔、笔中枢、线段、大级别线段、线段中枢联动分析
● 🏗️ 独家纯分段算法: 精确识别第一种、第二种情况线段划分
● 🎪 多级中枢体系: 三重中枢级别完整覆盖
● 📊 全景市场分析: 提供全面的市场动态洞察
🎨 3. 专业视觉定制
● 🌈 自定义配色方案 - 完美匹配个人图表风格
● 💰 价格标识显示 - 笔、段、中枢关键价位标注
● 📐 专业辅助工具 - 均线、布林线等实用功能
● 🎁 MACD - 配套附图指标
⏰ 4. 完美K线回放支持
● 🔄 历史数据回顾 - 完美支持TradingView回放功能
● 📚 市场研究利器 - 提升历史走势分析能力
● 🧠 决策能力增强 - 深化市场洞察与判断水平
📦 产品版本
🥇 版本一:专业分段版
适合:传统缠论爱好者,追求经典分段算法
核心功能:
● 🔸 多种笔算法: 分型笔、新笔、旧笔、次高低点笔、最高低点
● 🔸 笔段细节调整: 海量参数支持各种笔划分方案
● 🔸 完整中枢体系: K线中枢、笔中枢、段中枢
● 🔸 智能预警系统: 背离背驰提示及报警功能
● 🔸 递归大级别: 本级别、大级别分段分析
**📊
💡 同行对比: 其他平台的"专业版"功能,在我们这里只是基础配置
🎊 立即体验,开启专业缠论分析之旅!
售前说明:缠中说禅理论,相对比较复杂,软件尽量实现原文的功能,但是也难免有些瑕疵地方,无法处理到位,这边后期会陆续完善,介意的客户可以先试用几天,觉得合适再买,不合适就当测试下,欢迎大家反馈问题和bug,掌柜有空会后期更新修改和优化
1.原文的K线包含
2.笔段多级别背离背驰提示
3.超过三种笔可以调整
4.包含笔段面积力度统计+中枢高低点价格显示
5.三级别中枢(K线中枢 笔中枢 段中枢)精细分析
6.多个均线显示
7.常用叠加布林
8.原文线段划分规则,并且做2级别段
9.设计了一些报警功能,背离背驰等,后期还会陆续完善
10.总共几十个可选参数设置
11.免费试用

Ultimate Multi-Physics Financial IndicatorThe Ultimate Multi-Physics Financial Indicator is an advanced Pine Script designed to combine various complex theories from physics, mathematics, and statistical mechanics to create a holistic, multi-dimensional approach to market analysis. Let’s break down the core concepts and how they’re applied in this script:
1. Fractal Geometry: Recursive Pattern Recognition
Purpose: This part of the script uses fractal geometry to recursively analyze price pivots (highs and lows) for detecting patterns.
Fractals: The fractalHigh and fractalLow signals represent key turning points in the market. The script goes deeper by recursively analyzing layers of pivot sequences, adding "depth" to the recognition of patterns.
Recursive Depth: It breaks down each detected pivot into smaller components, giving more nuance to market pattern recognition. This provides a broader context for how prices have behaved historically at various levels of recursion.
2. Quantum Mechanics: Adaptive Probabilistic Monte Carlo with Correlation
Purpose: This component integrates randomness (from Monte Carlo simulations) with current market behavior using correlation.
Randomness Weighted by Correlation: By generating random probabilities and weighting them based on how well the market aligns with recent trends, it creates a probabilistic signal. The random values are scaled by a correlation factor (close prices and their moving average), adding adaptive elements where randomness is adjusted by current market conditions.
3. Thermodynamics: Adaptive Efficiency Ratio (Entropy-Like Decay)
Purpose: This section uses principles from thermodynamics, where efficiency in price movement is dynamically adjusted by recent volatility and changes.
Efficiency Ratio: It calculates how efficiently the market is moving over a certain period. The "entropy decay factor" reflects how stable the market is. Higher entropy (chaos) results in lower efficiency, while stable periods maintain higher efficiency.
4. Chaos Theory: Lorenz-Driven Market Oscillation
Purpose: Instead of using a basic Average True Range (ATR) indicator, this section applies chaos theory (using a Lorenz attractor analogy) to describe complex market oscillations.
Lorenz Attractor: This models market behavior with a chaotic system that depends on the historical price changes at different time intervals. The attractor value quantifies the level of "chaos" or unpredictability in the market.
5. String Theory: Multi-Layered Dimensional Analysis of RSI and MACD
Purpose: Combines traditional indicators like the RSI (Relative Strength Index) and MACD (Moving Average Convergence Divergence) with momentum for multi-dimensional analysis.
Interaction of Layers: Each layer (RSI, MACD, and momentum) is treated as part of a multi-dimensional structure, where they influence one another. The final signal is a blended outcome of these key metrics, weighted and averaged for complexity.
6. Fluid Dynamics: Adaptive OBV (Pressure-Based)
Purpose: This section uses fluid dynamics to understand how price movement and volume create pressure over time, similar to how fluids behave under different forces.
Adaptive OBV: Traditional OBV (On-Balance Volume) is adapted by using statistical smoothing to measure the "pressure" exerted by volume over time. The result is a signal that shows where there might be building momentum or pressure in the market based on volume dynamics.
7. Recursive Synthesis of Signals
Purpose: After calculating all the individual signals (fractal, quantum, thermodynamic, chaos, string, and fluid), the script synthesizes them into one cohesive signal.
Recursive Feedback Loop: Each signal is recursively influenced by others, forming a feedback loop that allows the indicator to continuously learn from new data and self-adjust.
8. Signal Smoothing and Final Output
Purpose: To avoid noise in the output, the final combined signal is smoothed using an Exponential Moving Average (EMA), which helps stabilize the output for easier interpretation.
9. Dynamic Color Coding Based on Signal Extremes
Purpose: Visual clarity is enhanced by using color to highlight different levels of signal strength.
Color Coding: The script dynamically adjusts colors (green, orange, red) based on the strength of the final signal relative to its percentile ranking in historical data, making it easier to spot bullish, neutral, or bearish signals.
The "Ultimate Multi-Physics Financial Indicator" integrates a diverse array of scientific principles — fractal geometry, quantum mechanics, thermodynamics, chaos theory, string theory, and fluid dynamics — to provide a comprehensive market analysis tool. By combining probabilistic simulations, multi-dimensional technical indicators, and recursive feedback loops, this indicator adapts dynamically to evolving market conditions, giving traders a holistic view of market behavior across various dimensions. The result is an adaptive and flexible tool that responds to both short-term and long-term market changes

Chan Theory - CHANLUN | CZSCChan Theory (CHANLUN) is a technical analysis theory created by Chinese analyst CZSC, primarily applied in the analysis and decision-making of financial markets such as stocks, futures, forex, and crypto.
It is a technical analysis method based on price and time, including candlestick patterns, fractal theory, box theory, trend theory, divergence theory, multiple time frame analysis, and more.
"Chan" means zen, indicating that the fluctuations in the market are rooted in human nature, such as greed, anger, ignorance, slowness, and suspicion.
"Chan" is also the pinyin of the Chinese character '缠', which means entanglement or entwining. as the fluctuations in the stock market were intertwined like a spiral.
Concepts
Fractal - fractal is formed by three candlesticks, with the middle one being the highest for a top fractal and the lowest for a bottom fractal. In Chan Theory, the first step is to traverse all candlesticks to find all valid fractals.
Stroke - stroke is usually composed of multiple fractals, with a top fractal and a bottom fractal at both ends, and the connection between them forms a stroke with clear high and low points. This is the smallest unit of composition in Chan Theory, similar to the zigzag algorithm.
Segment - segment is generated from strokes based on the feature sequence algorithm, and a segment contains at least three strokes. a segment is a higher level of period, indicating the trend of the market at a higher level,similar to period 5M to period 30M.
Box - box is the overlapping area of multiple segments, and a box contains at least three segments. A box represents a densely traded area and a temporary consensus price range,the bull-bear battle has not produced a clear outcome, it means that the market is in a state of uncertainty and that the direction of the trend is unclear.
Trend - In Chan Theory, two or more boxes in the same direction form a trend,If the box position are gradually rising, it is defined as an uptrend,conversely, it is a downtrend.
Differences with ZigZag
Both the Chan Theory Stroke and the ZigZag are formed by connecting the high and low points to create a line. But in Chan Theory, there are strict additional requirements:
There must be at least five candlesticks between the high and low points, Otherwise it does not form a Stroke.
The high and low fractal cannot share the same candlestick,Otherwise it does not form a Stroke.
There must be at least three candlesticks between the high and low fractal,these three candlesticks must move in the same direction.
There may be complex situations where there are multiple top or bottom patterns in a single Stroke, requiring special handling to determine the connection rules for the lines.
Chan Theory is a complex theory that includes not only Stroke, but also other theories such as Box、Recursion and Divergence.
Recursion
The processing flow of the Chan Theory is similar to a ternary algorithm, It organizes chaotic candlestick into an orderly system (Fractal -> Stroke -> Segment -> Box -> Trend),levels gradually increase from small to large. We can let the levels develop continuously to obtain the appropriate level for analysis and trading, In Chan Theory, it is called "recursion". This method allows us to observe the structure of smaller levels to make trading decisions at the current level,and it allows us to combine multiple levels to determine specific trading points.
Divergence
Chan Theory uses MACD to infer the strength of the trend as momentum analysis. Chan Theory calculates the MACD area of the K-line to quantify the strength of a trend, and compares the areas of the front and back two sections of the same level box to determine whether the trend is exhausted,it is called "divergence". this is one of the important part to determine trading points.
缠论是一种技术分析理论,由中国分析师 "缠中说禅"所创立,主要应用于股票、期货、外汇、加密货币等金融市场的分析和决策。
市场哲学和禅
以股市为基础。缠者,价格重叠区间也,买卖双方阵地战之区域也;禅者,破解之道也。以阵地战为
中心,比较前后两段之力度大小,大者,留之,小者,去之。
以现实存在为基础。缠者,人性之纠结,贪嗔疾慢疑也;禅者,觉悟、超脱者也。以禅破缠,上善若
水,尤如空筒,随波而走,方入空门。
技术分析简解
以走势中枢为中间点的力度比较,尤如拔河,力大者,持有原仓位,力小者,反向操作。
把走势全部同级别分解,关注新的走势之形成,以前一走势段为中间点与再前一走势段比大小,大者,
留之,小者,去之。
进行多重赋格性的同级别分解操作,尤如行船、尤如开车,以不同档位适应不同情况
技术分析量化组件
形态学 - 笔、线段、走势中枢、走势类型
动力学 - 背驰、走势中枢、走势的能量结构
壹缠脚本是以缠论为核心理论,实现的技术分析指标系统
功能说明
基于缠论分析 实时笔段走势画线、自动中枢标识、多级别K线递归走势、实时标注缠论三类买卖点
支持配置多种笔、段、走势规则 满足交易者的笔段习惯和风格
支持TradingView警报机制 实时推送各级别买卖点通知到邮箱或Webhook
脚本图例说明
笔段走势 - 蓝线为当前级别K线构成的笔,紫色线为基于笔级别特征序列处理生成的段,紫线为基于当前级别段生成的走势
中枢级别 - 各级别画线、中枢、买卖点提示信息采用同一颜色。即笔级别中枢同为浅蓝色、段级别中枢为橙色。
MACD面积 - 笔段走势的末端数字为对应笔段的MACD面积, 蓝色为笔MACD面积,橙色为段MACD面积,紫色为走势MACD面积。