Enhanced Fractal Dimension IndexThis script utilizes the concept of fractal dimension to analyze a trend strength.
Usage:
- When there is a trend, the value < 1.5: the further away it gets from 1.5, the stronger the trend
- Vice versa
Wyszukaj w skryptach "Fractal"


[PX] MTF Fractal Level This script identifies multi-timeframe fractal level, which can be used as support and resistance.
If you are looking for someone to develop your own indicator or trading strategy, don't hesitate to get in touch with me here on TradingView or below.
Contact:
www.pascal-simon.de
info@pascal-simon.de

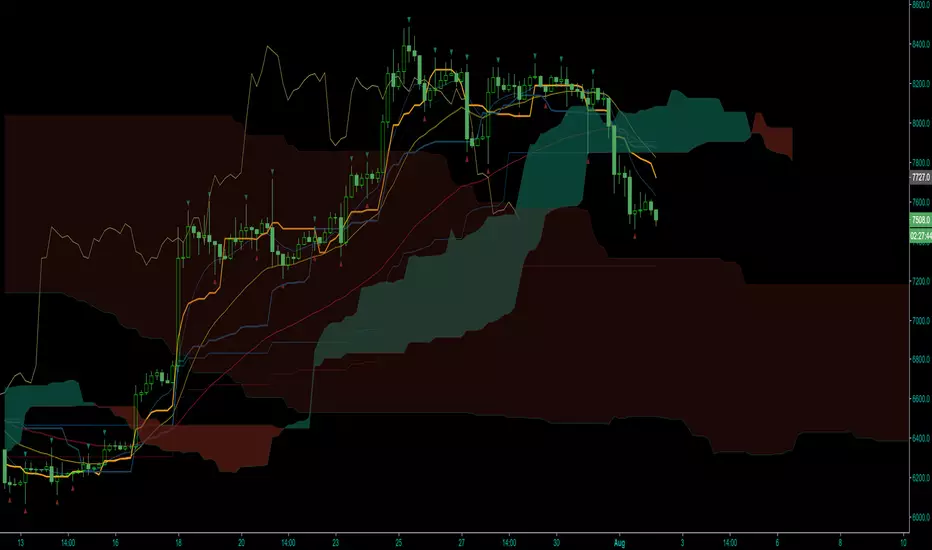
PpSignal Composit Fractal volatilityThis strategy is based on a mix of indicators. Institutional trades enter the market following the rule: trend, volatility and volume.
If we want to find the trend it is necessary to use the CFB composite fractal behavor, you can look for it within my indicators the explanation. the CFB will be in charge of finding the right trend. if we have the tendency in hand we go to look for volatility.
Volatility is a cyclical effect, caused mainly by the aggressive entry or aggressive exit of money in the market or what is the same, by fear or enthusiasm.
The changes in the perspective of the participants caused by news, crisis, natural disasters or simply by the entry or exit of large capitals, will cause the price to move quickly in short periods of time.
example, if we are in the 1h chart and the closing price of the daily bar is higher than the opening price and this is accompanied by volatility we have a greater probability of entering at the right time.
For this we use standard deviation, atr and W% smoothing.
Once all this information is aligned we have a correct entry with trend and volatility.
We leave when the price is inside the band atr.
the system also has different individual alerts such as ATR, kc channel, open close mtf bar, w%, cfb.
I recommend that you look for your best strategy according to the instument that you wish to trade.
Buy = when the cfb show buy signal and the price is above the atr.
sell = when the cfb show sell signal when the price is below the lower band of atr.
inside = exit.

Ranging MA Zone with Fractal linesThis plots a zone of the candle crossing the MA marking a no trade zone or sideways movement. Other is Fractal lines, which can also be used as support and resistance.
Any questions feel free to PM or comment.

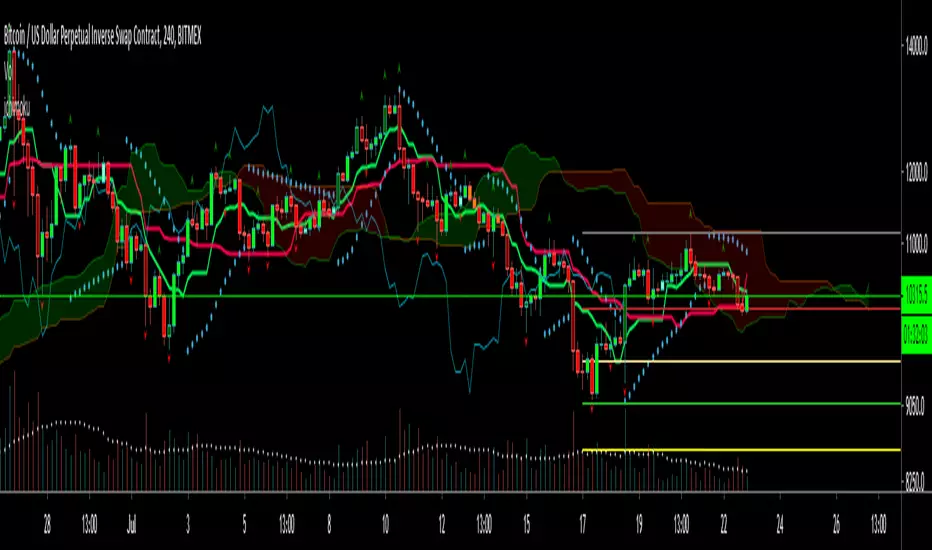
2xIchimoku Cloud + 4xEMA + Williams FractalCopy+Pasted/edited the code from :
Moku
www.tradingview.com
EMA
www.tradingview.com
Fractal
www.tradingview.com
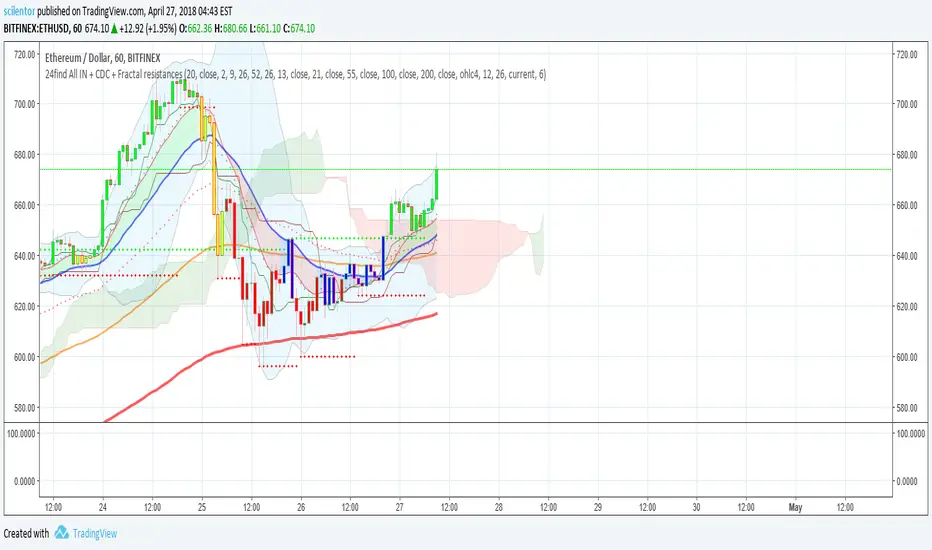
24find All IN + CDC + Fractal resistancesCombined to previous which had only CDC added on top of the original by dimoe with Fractal resistances by synapticEx.
Momentum Fractal VolatilityThis is another modified macd combined with bollinger bands. The idea is to follow this with the momentum indicator I developed and just like when you look at cycle time frame and higher cycle time frame (Barry Burn), here you can see the higher momentum time frame (fractal energy, Barry Burn).
When the macd line goes above/bellow the bollinger band, it changes the color to green/red for easier identifying possible momentum exhaustion places and times.

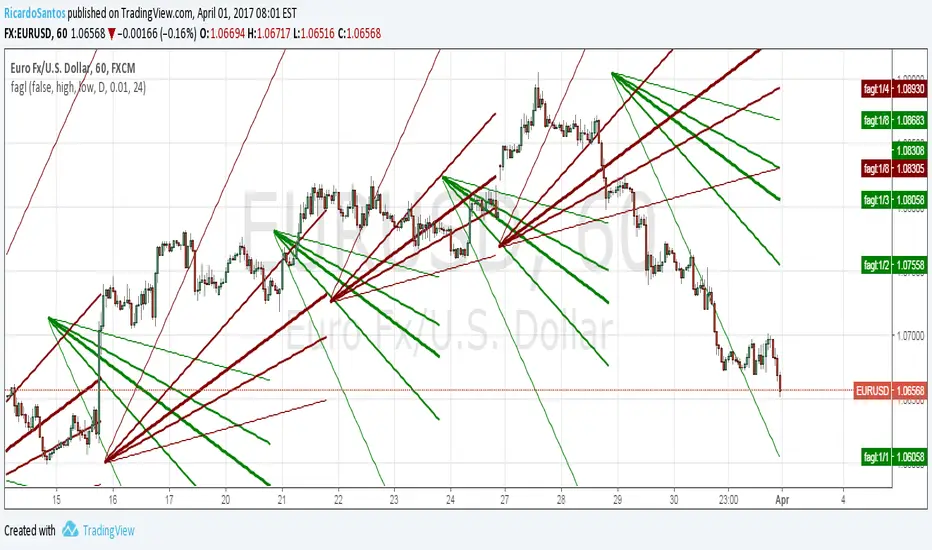
[RS]Fractal Auto Gann LinesEXPERIMENTAL:
GANN lines projection based on zigzag tops/bottoms, use at your own risk.
Chaos 2.0This is pure chaos!
I just wanted 1 thing I can put on a chart to try to get a clearer picture of what is going on (and not take up all the indicator spaces a free user is allowed haha)
Many things going on from so many different users
honestly I'm sorry I cant shout out everyone whose code I have ever read and used in another project just for the sake of learning more about pinescript!
As a way of shouting everyone out! (and giving out my most useful and configurable system)
I give you... CHAOS
I originally got an Alligator, AO, and Fractal script from a user ChaosTrader, then realized I love using averages!
I added the MESA (lazybear?) and the McGinley Dynamic Range (sry idk) and a simple 233 SMA.
I also found about something called the www.prorealcode.com another user had created for Pinescript.
I really liked that script so I adapted it to do the same kind of signal printing for circles and squares (crosses and series)
Check it out tell me what you think and how I can make it better for everyone!
thanks all!
Snoop

ChaosThis script adds a Bill Williams Alligator to your charts and the three wisemen:
1. Wiseman 1 - Bullish or bearish divergent bars shown with a circle (be sure to check angulation manually).
2. Wiseman 2 - Super AO - with a square.
3 Wiseman 3 - Fractal with a triangle.
Be sure to wait until the current bar is closed before using these signals.
Reference: TradingChaos Version 2

[RS]Temporal Fractal Flow Study V1EXPERIMENTAL: Study on Fractal Price Flow.
UPDATE: Cleaned up, added optional time frames(all), will need to go into options for setup, all settings are off by default.

[RS]Fractal Levels V1EXPERIMENTAL: update to previous version, added a average of the fractal levels and the ability to hide the diferent components.

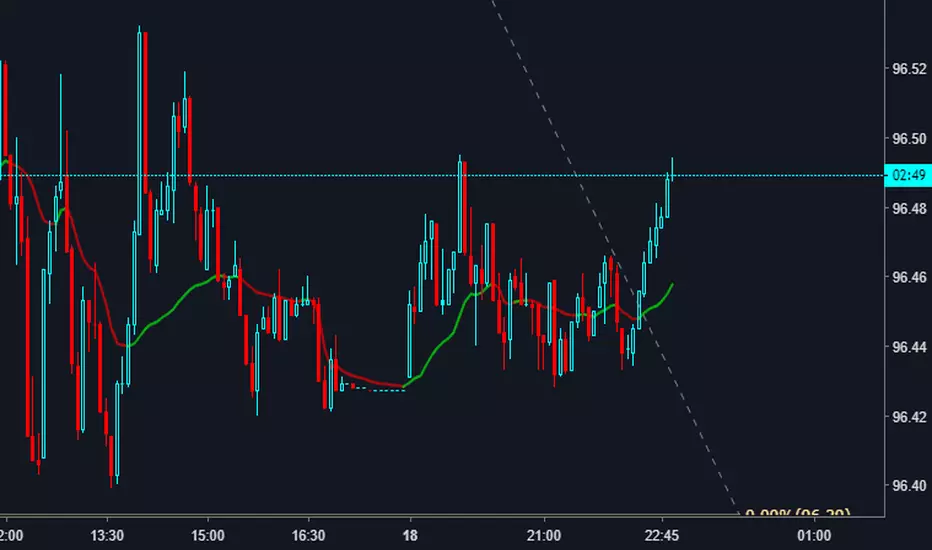
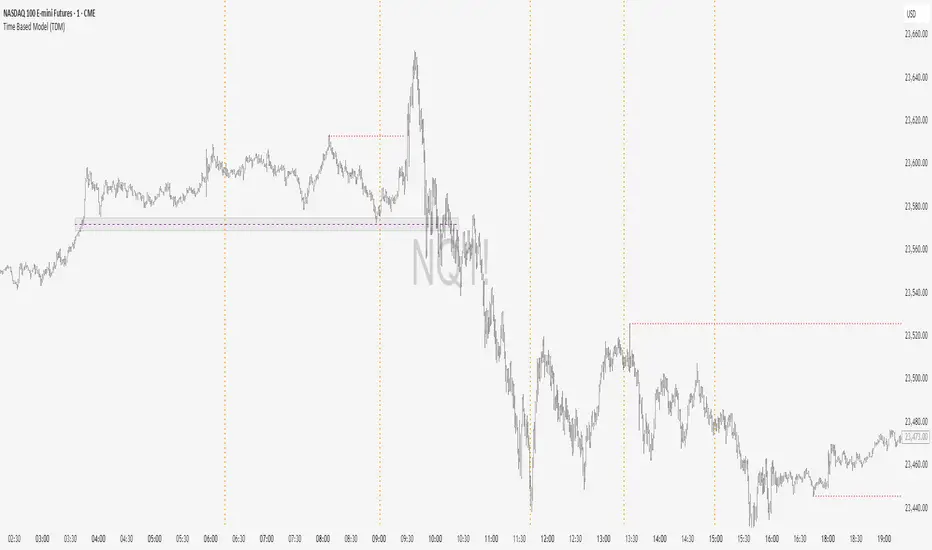
Time Based Model (TDM)This indicator is based on TDM's Time-Based Model, designed primarily for trading indices during the New York session.
The Time-Based Model follows the DC framework with some key adjustments:
It focuses on the New York session time, specifically from 14:00 to 14:00 EST.
The model pulls time Fibonacci levels between these 14:00-to-14:00 periods to identify potential market turning points.
Additionally, it applies the time Fibonacci retracement again on the last two segments to refine timing analysis.
This approach helps traders anticipate when price action is more likely to react, based on time cycles rather than just price levels, improving timing precision within the NY session.
ADXcellenceThis advanced trading indicator, inspired by Dr. Charles B. Schaap's book "ADXcellence: Power Trend Strategies", leverages the principles of the Average Directional Index (ADX) to help traders identify and exploit trending conditions in the market.
The ADXcellence Indicator uses multiple levels of analysis to evaluate the strength and direction of trends.
In addition to the classic ADX+DMI input settings, these features are included:
ADX Slope Signal: This parameter, controls the sensitivity of the ADX slope, which will indicate when the trend strength is increasing or decreasing.
The indicator provides three trend levels: strong trend level, trending level, and low volatility level, which can be customized to suit various trading strategies.
The color gradients for the ADX, DI+, and DI- lines are designed to visually represent the trend strength from the low volatility level to the strong trend level. The indicator also uses a dynamic background color, highlighting the periods when the ADX is rising. The color will vary depending on the dominant DI.
The ADXcellence Indicator also offers a unique feature of dynamically adjusting the fill between DI+ and DI-, with the color and fill intensity changing based on the relative value of the two.
This indicator is a powerful tool for traders who use trend-following strategies and is best used in conjunction with other technical analysis tools to confirm signals and avoid potential false signals.
Remember, no indicator is perfect and every trading strategy should include risk management and proper due diligence.
Enjoy :)

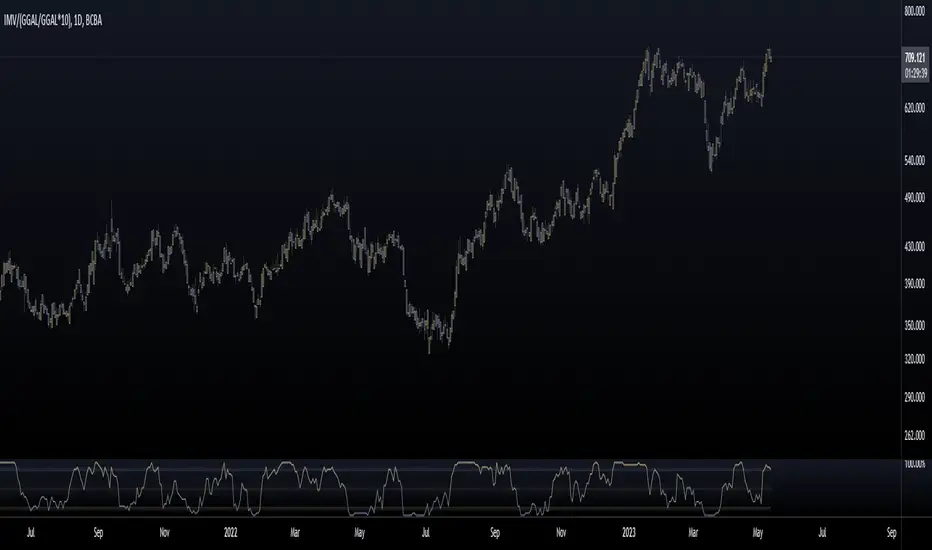
Mervaleta BreadthFellow Merval investors/traders , I'm sharing this script with you that allows you to calculate a breadth indicator using the components of the Merval Index (IMV) from Argentina.
This breadth indicator shows the percentage of stocks that are above a moving average. In this case, you can choose between an EMA or SMA, and you can select the period of the moving average.
The components that make up the index and were used for this script are as follows:
AGRO
ALUA
BBAR
BMA
BYMA
CEPU
COME
CRES
CVH
EDN
GGAL
HARG
LOMA
MIRG
PAMP
SUPV
TECO2
TGNO4
TGSU2
TRAN
TXAR
VALO
YPFD
For all of them, their dollar value in CCL was used, calculated with GGAL.
Enjoy :)
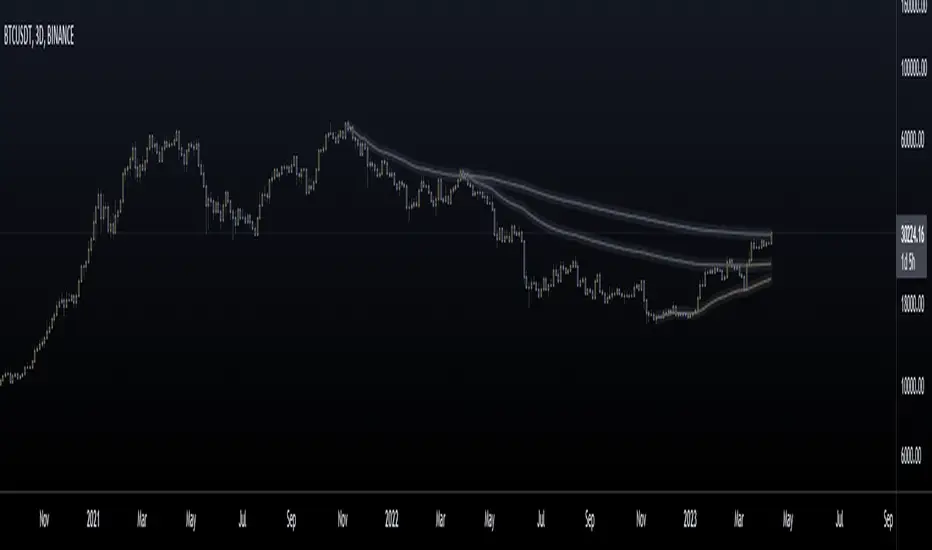
Kalman TrendKalman Filter
The Kalman Filter is a powerful mathematical tool that provides an efficient computational solution to the least-squares method. It was initially developed and used for navigation and control theory but has found its way into numerous applications, including financial market analysis.
In simple terms, a Kalman filter is an algorithm that uses a series of measurements observed over time, containing statistical noise and other inaccuracies, and produces estimates that tend to be more accurate than those based on a single measurement alone.
The basic calculation of a Kalman Filter involves two main steps: Prediction and Update. In the prediction step, the Kalman filter produces estimates of the current state variables, along with their uncertainties. Once the outcome of the next measurement (somewhat corrupted by noise) is observed, these estimates are updated using a weighted average, with more weight being given to estimates with higher certainty.
Indicator Usage
The proposed indicator, in this case, uses a Kalman Filter and applies a Moving Average (MA) to the filter. This creates a sort of "smoothed" version of the Kalman Filter, which then can be utilized in a crossover method for trading.
The indicator generates a cloud between the Kalman Filter and the Moving Average. This cloud can be visualized on a price chart and is used to indicate potential buy and sell signals. When the Kalman Filter crosses above the Moving Average, it is typically a bullish signal (buy), and when it crosses below, it is a bearish signal (sell).
One feature of this indicator is the ability to choose the type of Moving Average applied to the Kalman Filter. The options include:
SMA (Simple Moving Average)
EMA (Exponential Moving Average)
RMA (Running Moving Average)
WMA (Weighted Moving Average)
HMA (Hull Moving Average)
VWMA (Volume Weighted Moving Average)
TMA (Triangular Moving Average)
You also have the ability to customize the colors of the indicator, allowing you to easily visualize and differentiate the bullish and bearish signals on the chart. It helps in enhancing user experience and understanding of the market's state, thereby facilitating better trading decisions.
Remember, as with all trading indicators, the Kalman Filter should not be used in isolation. It is recommended to use it in conjunction with other indicators and methods to confirm signals and prevent false positives.

Anchored Moving Averages - InteractiveWhat is an Anchored Moving Average?
An anchored moving average (AMA) is created when you select a point on the chart and start calculating the moving average from there.
Thus the moving average’s denominator is not fixed but cumulative and dynamic. It is similar to an Anchored VWAP, but neglecting the volume data, which may be useful when this data is not reliable and you want to focus just on price.
Main Features
This interactive indicator allows you to select 3 different points in time to plot their respective moving averages. As soon as you add the indicator to your chart you will be asked to click on the 3 different points where you want to start the calculation for each moving average.
Each AMA (Anchored Moving Average) will be colored according to its slope, using a gradient defined by two user chosen colors in the indicator menu.
The default source for the calculation is the pivot price (HLC3) but can also be modified in the menu.
Examples:
Enjoy!
Nadaraya-Watson OscillatorThis indicator is based on the work of @jdehorty and his amazing Nadaraya-Watson Kernel Envelope, which you can see here:
General Description
The Nadaraya-Watson Oscillator (NWO) will give the same information as the Nadaraya-Watson Envelope, but as an oscillator off the main chart, by plotting the relationship between price and the Kernel and its bands. This also means that we can now detect divergences between price and the NWO.
You can see the relationship between the two here:
You can think of this indicator as the kernel envelope version of a Bollinger Band %B. In ranging markets the bands are perfect for mean reversion trades, but in certain situations the break of one of the bands can signal the beggining of a strong trend and price will remain close to the bands for a long period and will only give small pullbacks. As with any indicator, confluence with price and other tools must be taken into account.
Main Features
As with @jdehorty 's Envelope, you can change the following settings:
Lookback Window.
Relative Weighting.
The initial bar for the regression.
ATR period for the bands.
Inner and Outer Multiples for the bands.
I also added the following:
A middle band around the Kernel to filter out false crossovers.
A Hull Moving Average to smoothen out the movements of the oscillator and give extra confirmation of turnover points.
Colors
Some special things to note regarding the coloring:
The zero line features a gradient that changes color every time the Kernel slope changes direction.
The Oscillator plot has a gradient coloring that gets stronger the closer it gets to each of the bands.
Every time the oscillator crosses over/under the outer bands the background will be highlighted.
Happy trading!

TideMasterThe TideMaster is an alternative to the classic moving average, providing a volatility channel around its centerline. The idea of such envelope has been popularized by many technicians such as Jake Bernstein and Jeffrey Kennedy.
The channel creates a virtual S/R zone which is ideal trend following and pullback entries after impulsive movements. It also acts as a tool to avoid price whipsaws and to provide a simple heuristic for entry and stop loss placement within a moving average system.
This indicator has the following unique features:
- Gradient Color Centerline to track the moving average slope/direction.
- Gradient Color Volatility Channel with adjustable width.
- 5 Moving Average Types: EMA,SMA,HMA,WMA & VWMA.
Enjoy!
