HTF Fractal Swings [BornKillerBee]Of course. A good description is key to helping other traders understand and use your script. Here are a few options, from a concise version to a more detailed one. You can mix and match parts as you see fit.
Option 1: Concise & To the Point
Title: HTF Fractal Swings
Description:
This indicator automatically identifies and plots significant swing highs (buyside liquidity) and swing lows (sellside liquidity) from a higher timeframe (HTF) directly onto your current chart.
It's designed for traders who use multi-timeframe analysis to map out market structure and identify key areas of interest for entries or targets. Lines extend into the future until price crosses them, providing a clean visual of which liquidity levels are still intact.
Features:
Plots HTF swing points on your lower timeframe chart.
Lines automatically stop extending once liquidity is taken.
Optional "Order Flow Leg" box to visualize the current dealing range between the last major high and low.
Fully customizable: Choose your HTF, number of swings to show, colors, and line styles.
Option 2: Detailed & Feature-Rich (Recommended)
Title: HTF Fractal Swings & Liquidity Visualizer
Description:
Overview
This powerful indicator is designed for price action and smart money concept (SMC) traders who rely on multi-timeframe analysis. It automatically detects Bill Williams' fractal swing points on a user-defined higher timeframe (HTF) and plots them with precision on your current, lower timeframe chart. This allows you to effortlessly track key market structure, identify pools of liquidity, and define the current trading range without ever leaving your chart.
Core Concepts & How to Use
Buyside & Sellside Liquidity: The plotted swing highs represent potential buyside liquidity, which can act as resistance or a target for bullish moves. Conversely, swing lows represent sellside liquidity, acting as potential support or a target for bearish moves.
Dynamic Levels: Lines for each swing level extend into the future, acting as a clear visual guide. When price trades through a level (based on your chosen "Cross Trigger Source"), the line stops extending and its color fades. This provides an instant signal that the liquidity at that price has likely been swept or "taken."
Order Flow Leg: When enabled, the script draws a box connecting the most recent swing high and swing low. This helps visualize the current dealing range or order flow leg. Traders may look for entries at a discount (below 50% of the range) or a premium (above 50%) to target the opposing side of the range.
Key Features
Multi-Timeframe Analysis, Simplified: Define any higher timeframe (e.g., '4H', '1D') and see its key structural points on your '5m' chart.
Precise Swing Placement: The script finds the exact LTF candle responsible for the HTF swing, ensuring the level is plotted with maximum accuracy.
Automatic Liquidity Tracking: Visually confirm when a liquidity level has been breached.
Customizable Display:
Set the number of recent swing highs and lows to track.
Choose whether a cross is triggered by the High/Low (wick) or the bar Close.
Fully control the colors, line styles, and widths for each timeframe.
Toggle the swing time on the labels for historical reference.
This tool is perfect for cleaning up your charts and focusing on the price levels that matter most.
Wyszukaj w skryptach "Fractal"

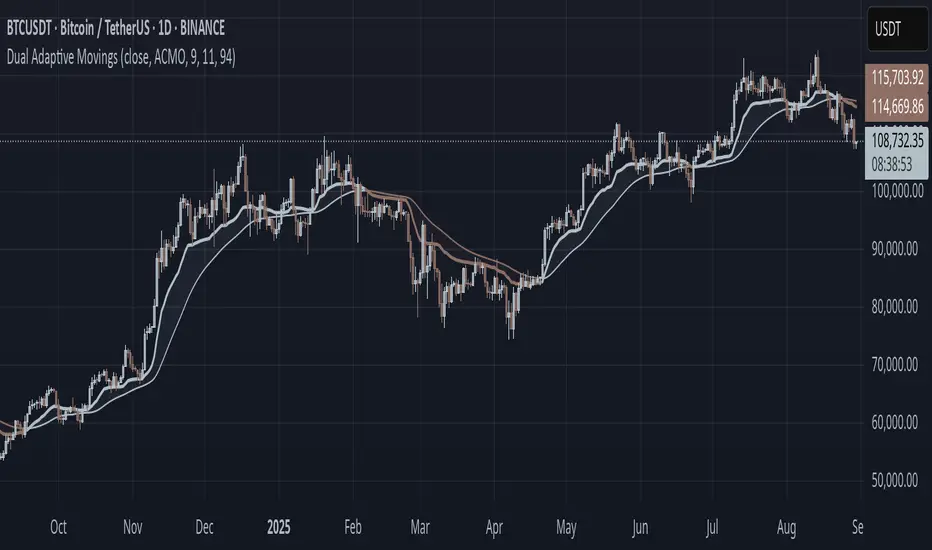
Dual Adaptive Movings### Dual Adaptive Movings
By Gurjit Singh
A dual-layer adaptive moving average system that adjusts its responsiveness dynamically using market-derived factors (CMO, RSI, Fractal Roughness, or Stochastic Acceleration). It plots:
* Primary Adaptive MA (MA): Fast, reacts to changes in volatility/momentum.
* Following Adaptive MA (FAMA): A smoother, half-alpha version for trend confirmation.
Instead of fixed smoothing, it adapts dynamically using one of four methods:
* ACMO: Adaptive CMO (momentum)
* ARSI: Adaptive RSI (relative strength)
* FRMA: Fractal Roughness (volatility + fractal dimension)
* ASTA: Adaptive Stochastic Acceleration (%K acceleration)
### ⚙️ Inputs & Options
* Source: Price input (default: close).
* Moving (Type): ACMO, ARSI, FRMA, ASTA.
* MA Length (Primary): Core adaptive window.
* Following (FAMA) Length: Optional; can match MA length.
* Use Wilder’s: Toggles Wilder vs EMA-style smoothing.
* Colors & Fill: Bullish/Bearish tones with transparency control.
### 🔑 How to Use
1. Identify Trend:
* When MA > FAMA → Bullish (fills bullish color).
* When MA < FAMA → Bearish (fills bearish color).
2. Crossovers:
* MA crosses above FAMA → Bullish signal 🐂
* MA crosses below FAMA → Bearish signal 🐻
3. Adaptive Edge:
* Select method (ACMO/ARSI/FRMA/ASTA) depending on whether you want sensitivity to momentum, strength, volatility, or acceleration.
4. Alerts:
* Built-in alerts trigger on crossovers.
### 💡 Tips
* Wilder’s smoothing is gentler than EMA, reducing whipsaws in sideways conditions.
* ACMO and ARSI are best for momentum-driven directional markets, but may false-signal in ranges.
* FRMA and ASTA excels in choppy markets where volatility clusters.
👉 In short: Dual Adaptive Movings adapts moving averages to the market’s own behavior, smoothing noise yet staying responsive. Crossovers mark possible trend shifts, while color fills highlight bias.
Hurst Exponent Adaptive Filter (HEAF) [PhenLabs]📊 PhenLabs - Hurst Exponent Adaptive Filter (HEAF)
Version: PineScript™ v6
📌 Description
The Hurst Exponent Adaptive Filter (HEAF) is an advanced Pine Script indicator designed to dynamically adjust moving average calculations based on real time market regimes detected through the Hurst Exponent. The intention behind the creation of this indicator was not a buy/sell indicator but rather a tool to help sharpen traders ability to distinguish regimes in the market mathematically rather than guessing. By analyzing price persistence, it identifies whether the market is trending, mean-reverting, or exhibiting random walk behavior, automatically adapting the MA length to provide more responsive alerts in volatile conditions and smoother outputs in stable ones. This helps traders avoid false signals in choppy markets and capitalize on strong trends, making it ideal for adaptive trading strategies across various timeframes and assets.
Unlike traditional moving averages, HEAF incorporates fractal dimension analysis via the Hurst Exponent to create a self-tuning filter that evolves with market conditions. Traders benefit from visual cues like color coded regimes, adaptive bands for volatility channels, and an information panel that suggests appropriate strategies, enhancing decision making without constant manual adjustments by the user.
🚀 Points of Innovation
Dynamic MA length adjustment using Hurst Exponent for regime-aware filtering, reducing lag in trends and noise in ranges.
Integrated market regime classification (trending, mean-reverting, random) with visual and alert-based notifications.
Customizable color themes and adaptive bands that incorporate ATR for volatility-adjusted channels.
Built-in information panel providing real-time strategy recommendations based on detected regimes.
Power sensitivity parameter to fine-tune adaptation aggressiveness, allowing personalization for different trading styles.
Support for multiple MA types (EMA, SMA, WMA) within an adaptive framework.
🔧 Core Components
Hurst Exponent Calculation: Computes the fractal dimension of price series over a user-defined lookback to detect market persistence or anti-persistence.
Adaptive Length Mechanism: Maps Hurst values to MA lengths between minimum and maximum bounds, using a power function for sensitivity control.
Moving Average Engine: Applies the chosen MA type (EMA, SMA, or WMA) to the adaptive length for the core filter line.
Adaptive Bands: Creates upper and lower channels using ATR multiplied by a band factor, scaled to the current adaptive length.
Regime Detection: Classifies market state with thresholds (e.g., >0.55 for trending) and triggers alerts on regime changes.
Visualization System: Includes gradient fills, regime-colored MA lines, and an info panel for at-a-glance insights.
🔥 Key Features
Regime-Adaptive Filtering: Automatically shortens MA in mean-reverting markets for quick responses and lengthens it in trends for smoother signals, helping traders stay aligned with market dynamics.
Custom Alerts: Notifies on regime shifts and band breakouts, enabling timely strategy adjustments like switching to trend-following in bullish regimes.
Visual Enhancements: Color-coded MA lines, gradient band fills, and an optional info panel that displays market state and trading tips, improving chart readability.
Flexible Settings: Adjustable lookback, min/max lengths, sensitivity power, MA type, and themes to suit various assets and timeframes.
Band Breakout Signals: Highlights potential overbought/oversold conditions via ATR-based channels, useful for entry/exit timing.
🎨 Visualization
Main Adaptive MA Line: Plotted with regime-based colors (e.g., green for trending) to visually indicate market state and filter position relative to price.
Adaptive Bands: Upper and lower lines with gradient fills between them, showing volatility channels that widen in random regimes and tighten in trends.
Price vs. MA Fills: Color-coded areas between price and MA (e.g., bullish green above MA in trending modes) for quick trend strength assessment.
Information Panel: Top-right table displaying current regime (e.g., "Trending Market") and strategy suggestions like "Follow trends" or "Trade ranges."
📖 Usage Guidelines
Core Settings
Hurst Lookback Period
Default: 100
Range: 20-500
Description: Sets the period for Hurst Exponent calculation; longer values provide more stable regime detection but may lag, while shorter ones are more responsive to recent changes.
Minimum MA Length
Default: 10
Range: 5-50
Description: Defines the shortest possible adaptive MA length, ideal for fast responses in mean-reverting conditions.
Maximum MA Length
Default: 200
Range: 50-500
Description: Sets the longest adaptive MA length for smoothing in strong trends; adjust based on asset volatility.
Sensitivity Power
Default: 2.0
Range: 1.0-5.0
Description: Controls how aggressively the length adapts to Hurst changes; higher values make it more sensitive to regime shifts.
MA Type
Default: EMA
Options: EMA, SMA, WMA
Description: Chooses the moving average calculation method; EMA is more responsive, while SMA/WMA offer different weighting.
🖼️ Visual Settings
Show Adaptive Bands
Default: True
Description: Toggles visibility of upper/lower bands for volatility channels.
Band Multiplier
Default: 1.5
Range: 0.5-3.0
Description: Scales band width using ATR; higher values create wider channels for conservative signals.
Show Information Panel
Default: True
Description: Displays regime info and strategy tips in a top-right panel.
MA Line Width
Default: 2
Range: 1-5
Description: Adjusts thickness of the main MA line for better visibility.
Color Theme
Default: Blue
Options: Blue, Classic, Dark Purple, Vibrant
Description: Selects color scheme for MA, bands, and fills to match user preferences.
🚨 Alert Settings
Enable Alerts
Default: True
Description: Activates notifications for regime changes and band breakouts.
✅ Best Use Cases
Trend-Following Strategies: In detected trending regimes, use the adaptive MA as a trailing stop or entry filter for momentum trades.
Range Trading: During mean-reverting periods, monitor band breakouts for buying dips or selling rallies within channels.
Risk Management in Random Markets: Reduce exposure when random walk is detected, using tight stops suggested in the info panel.
Multi-Timeframe Analysis: Apply on higher timeframes for regime confirmation, then drill down to lower ones for entries.
Volatility-Based Entries: Use upper/lower band crossovers as signals in adaptive channels for overbought/oversold trades.
⚠️ Limitations
Lagging in Transitions: Regime detection may delay during rapid market shifts, requiring confirmation from other tools.
Not a Standalone System: Best used in conjunction with other indicators; random regimes can lead to whipsaws if traded aggressively.
Parameter Sensitivity: Optimal settings vary by asset and timeframe, necessitating backtesting.
💡 What Makes This Unique
Hurst-Driven Adaptation: Unlike static MAs, it uses fractal analysis to self-tune, providing regime-specific filtering that's rare in standard indicators.
Integrated Strategy Guidance: The info panel offers actionable tips tied to regimes, bridging analysis and execution.
Multi-Regime Visualization: Combines adaptive bands, colored fills, and alerts in one tool for comprehensive market state awareness.
🔬 How It Works
Hurst Exponent Computation:
Calculates log returns over the lookback period to derive the rescaled range (R/S) ratio.
Normalizes to a 0-1 value, where >0.55 indicates trending, <0.45 mean-reverting, and in-between random.
Length Adaptation:
Maps normalized Hurst to an MA length via a power function, clamping between min and max.
Applies the selected MA type to close prices using this dynamic length.
Visualization and Signals:
Plots the MA with regime colors, adds ATR-based bands, and fills areas for trend strength.
Triggers alerts on regime changes or band crosses, with the info panel suggesting strategies like momentum riding in trends.
💡 Note:
For optimal results, backtest settings on your preferred assets and combine with volume or momentum indicators. Remember, no indicator guarantees profits—use with proper risk management. Access premium features and support at PhenLabs.

MarketMastery Suite by DGTAll-in-One Trading Framework for Price Action, Smart Money, and Market Structure
Unlock a complete, institutional-grade toolkit built for modern traders. The MarketMastery Suite blends advanced price action logic, multi-timeframe structure detection, capital flow analytics, and liquidation-based risk tools — empowering you to decode market behavior with confidence.
Whether you're identifying smart money zones, anticipating structural shifts, or managing position risk, MarketMastery Suite delivers actionable and adaptive insights.
KEY FEATURES
---------------------------------------------------------------------------------------------------------------
⯌ Dynamic Support & Resistance Zones
Automatically detects major Support and Resistance zones based on adaptive logic derived from ICT-style OBs and BBs. Rather than using fixed lookbacks, the script applies swing-based detection to reveal significant levels across Local, Regional, Global, and Macro structures — pinpointing areas of likely institutional interest.
⯌ Trend Stop & Range Detection
Tracks market bias with a smart 3-tier trailing stop that filters noise and identifies potential breakouts, traps, or directional flips — even in ranging conditions.
⯌ Fractal Market Structure & Shift Detection
Detects real-time Break of Structure (BoS) and Change of Character (CHoCH) events across fractal structure levels — Local to Macro — helping confirm or anticipate market shifts.
⯌ Volume & Capital Flow Analysis
Highlights volume spikes and overlays Cumulative Volume Delta (CVD) and Open Interest (OI) to uncover buyer/seller intent and momentum pressure shifts.
⯌ Trend Snapshot Dashboard
A clean, mobile-friendly dashboard that shows live trend strength, directional flow (Price, OI, CVD), and key capital activity, anchored to the latest swing evaluation window.
⯌ Liquidation Risk Zones
Visualizes liquidation and margin thresholds based on leverage, entry price, and maintenance margin — essential for futures risk planning.
ALERT MESSAGES
---------------------------------------------------------------------------------------------------------------
Support & Resistance Events
"Rejection {count} at Support · Support ≈ {value}"
"Support Retest {count} After Break · Support ≈ {value}"
"Rejection {count} at Resistance · Resistance ≈ {value}"
"Resistance Retest {count} After Break · Resistance ≈ {value}"
Support & Resistance Transitions
"Support Broken · {value} → Becomes Resistance"
"Resistance Broken · {value} → Becomes Support"
Market Structure Alerts
"{fractal depth} {Bullish|Bearish} Break of Structure detected."
"{fractal depth} {Bullish|Bearish} Change of Character detected."
Bias Transitions
"{Bullish|Bearish} Bias — Trailing stop flipped {upward|downward} {volume activity}"
"Potential {Bullish|Bearish} Flip — Early signs of {upward|downward} pressure {volume activity}"
"Ranging or Transitioning — Market lacks a clear trend {volume activity}"
Volume Spike
"Extreme volume spike detected!"
DISCLAIMER
---------------------------------------------------------------------------------------------------------------
This script is intended for informational and educational purposes only. It does not constitute financial, investment, or trading advice. All trading decisions made based on its output are solely the responsibility of the user.
Płatny skrypt

(FVC) Fractal Volatility Compression (DAFE) (FVC) Fractal Volatility Compression
See the Market’s Volatility DNA.
The Fractal Volatility Compression (FVC) is a next-generation tool for traders who want to see volatility compression and expansion across multiple timeframes and volatility engines—not just price, but the very structure of volatility itself.
What Makes FVC Unique?
Dual-Engine Volatility:
Plots both classic price-based (Stdev) and meta-volatility (VoVix) compression/expansion, so you can see when the market is “coiling” or “exploding” on multiple levels.
Fractal, Multi-Timeframe Analysis:
Measures volatility on short, medium, and long timeframes, then normalizes each as a Z-score. The result: a true “coiled spring” detector that works on any asset, any timeframe.
Threshold Lines You Control:
Yellow center line: Your neutral baseline.
Green compression line: When crossed, the market is “spring-loading.”
Red expansion line: When crossed, volatility is breaking out.
All lines are solid, clean, and end before the dashboard for a professional look.
Agreement Fill: When both engines agree (both above or both below the center line), a bright fill highlights the zone—red for expansion, green for compression.
Signature Dashboard & Info Line:
Dashboard (right-middle) shows all Z-scores and FVC values, color-coded for instant clarity.
Compact info label for mobile or minimalist users.
Inputs & Customization
Thresholds: Set the yellow, green, and red lines to match your asset, timeframe, and risk tolerance.
Timeframes & Lengths: Tune the short, medium, and long volatility windows for your style.
Toggle Lines: Show/hide Stdev or VoVix FVC lines independently.
Dashboard & Info Line: Toggle for your workflow and screen size.
How to Use
Compression (below green): Market is “coiling” across timeframes—watch for explosive moves.
Expansion (above red): Volatility is breaking out—expect regime shifts or trend acceleration.
Agreement Fill: When both lines agree, the signal is strongest.
Not a Buy/Sell Signal: These are regime and structure signals—combine with your own
strategy and risk management.
Why should you use FVC?
See what others can’t:
Most tools show only one dimension of volatility. FVC reveals the fractal DNA of market compression and expansion. Works on any asset, any timeframe. Professional, clean, and fully customizable.
Fractal Volatility Compression (FVC):
Because the next big move is born in the market’s hidden compression.
For educational purposes only. Not financial advice. Always use proper risk management
Use with discipline. Trade your edge.
— Dskyz, for DAFE Trading Systems

Self-Adaptive RSI with Fractal Dimension and Entropy ScalingSelf-Adaptive RSI with Fractal Dimension and Entropy Scaling
This advanced oscillator is a refined version of the RSI that integrates multi-timeframe analysis, fractal scaling, and entropy to create an adaptive, highly responsive indicator. The script leverages a range of techniques to dynamically adjust to market conditions and enhance sensitivity to trend and volatility. Here’s a breakdown of the core features:
Base and Fixed Adaptive Lengths:
A base length (input by the user) seeds the initial length for calculations. The script then calculates a fixed adaptive length as a multiplier of this base, providing consistency across different calculations.
Multi-Timeframe RSI Calculation:
The script calculates RSI across multiple timeframes (5 minutes to daily) and aggregates these values using a weighted average based on the Golden Ratio. This multi-timeframe RSI accounts for both short-term and long-term trends, making it more robust and responsive to shifts in market direction.
Enhanced RSI Using Adaptive Volume Weighting:
Price differences are smoothed and adjusted incorporating volume-based weights, allowing the RSI to adapt to changes in trading volume. This volume impact factor enhances trend detection accuracy.
Adaptive Zero-Lag RSI with Golden Ratio Smoothing:
To eliminate lag, the multi-timeframe RSI is smoothed using a zero-lag EMA based on a Golden Ratio length, adding precision to the RSI’s responsiveness while minimizing delay.
Fractal Dimension Scaling:
The oscillator is scaled to expand its range using fractal dimensions, capturing market complexity and adjusting for periods of high or low volatility. This scaling enhances sensitivity to price fluctuations.
Entropy-Based Trend Sensitivity and Volatility Compression:
The final RSI incorporates entropy scaling, achieved through a trend factor derived from a linear regression. This factor adjusts the RSI output based on market volatility and directional strength, compressing the indicator during stable periods and expanding it in high-volatility conditions.
Overbought and Oversold Thresholds Using Statistical Percentiles:
Rather than fixed thresholds, the overbought and oversold levels are set dynamically using percentile ranks (99th and 1st percentiles) over a long period, making them adaptive and reflective of historical price extremes.
This self-adaptive RSI, combining multi-timeframe weighting, fractal scaling, and entropy, provides a nuanced view of market trends and momentum. It dynamically adjusts to market volatility and structure, offering a sophisticated tool for traders seeking adaptive trend analysis and reliable entry/exit signals.

Prometheus Polarized Fractal Efficiency (PFE)This indicator uses market data to calculate Polarized Fractal Efficiency (PFE) on an asset, so traders can have a better idea of which direction it may go.
Users can control the lookback length for the fractal calculation, the lookback length for the Exponential Moving Average (EMA), and whether or not to display lines at the -50 and 50 level, or -25 and 25 level.
Polarized Fractal Efficiency:
The Polarized Fractal Efficiency (PFE) indicator is a value between -100 and 100 with 0 as a midpoint.
A PFE above 0 indicates the asset may trend higher, a PFE below 0 indicates the asset may trend lower.
There are many ways to trade with PFE, the intuitive trend riding as described above, or reversals.
Even when the PFE is above 0, if it gets high enough, it may also be an indication of a reversal. A PFE of 90 - 100, or -100 - -90, may indicate price is ready to revert the other direction. Furthermore, traders already in a position may look to breaks of other levels to be their take profit or stop out spot.
Calculation:
Pi = 100 x (Price - Price )2 + N2 / Summation, j= 0, to N-2 (Price - Price )2 + 1
If Close < Close Pi = -Pi
PFEi = EMA(Pi, M)
Where:
N = period of indicator
M = smoothing period
Citation: www.investopedia.com
Scenarios:
Inputs are (9, 5) and every display option is on.
Trend example
Step 1: A short trade appears as PFE crosses below -25. We reach a safe take profit as PFE crosses below -50. Traders can use these levels to exit as well as enter.
Step 2: On the cross above 25 there is a safe long. As the PFE value breaks 0 a safe, early take profit could be appropriate for this trade. No guarantee we would see 50.
Step 3: Long scenario at break of 25, straight to 50. Simple, straightforward setup.
Step 4: This long results in a stop loss. Once again entry as PFE crosses 25, but as we cross the 0 line it is for a loss.
Step 5: The last trade in this example is reminiscent of step 3. This is a short trade entry at break of 25 and exit at break of 50.
Traders have liberty to use the PFE value to determine spots to enter and exit trades, long or short. 25 and 50 were chosen arbitrarily, values like 10 and 60 may work as well, we encourage traders to use their own discretion along with tools.
Reversal example
Step 1: PFE is around -100, crossing below it at one point! Strong zone for a potential reversal.
Step 2: PFE crosses above 25 adding conviction.
Step 3: Option to exit at 70.
Step 4: Option to exit at 90.
There is no “one size fits all method”, this approach may be more intuitive for some users and is just as feasible as the first.
Longer trend example
Step 1: Using -50 and 50 this time instead of -25 and 25 to be safer on our entries we see a short here. Was a good entry and as the value gets closer to -70 we can safely close.
Step 2: On this candle we see a long for the break of 50. On the next candle we break the 0 line, but because of our safe entry at 50, we could hold this and only stop out at a break of -25. We get close but stay in it and close at 70.
Step 3: Break of 50 for a long once again. This time the break of 0 line occurs as we are in profit, not letting a green trade go red is a golden rule of trading, so an early exit here.
Step 4: Same at step 2, break of 50 to long and stay in it, not stopping out at break of 0 line. The PFE value eventually reaches 70 and there is a good exit.
Quicker Reversal example
Step 1: Notice a close with PFE below -90, enter long for the reversal. Then close for profit when the PFE crosses above 70.
Step 2: When the PFE breaks above 90 we have a short entry. Like the long closing it when it crosses below -70.
Step 3: This step is the same setup as step 2. As PFE breaks above 90 we have a short entry. Closing it when it crosses below -70.
Recap:
Described above are 4 different examples with many different trades. Both trend and reversal trades. The PFE value is an indicator that can be used by traders in many different ways and Prometheus encourages traders to use their own discretion along with tools and not follow indicators blindly.
Options:
Users can control the input for the lookback of the indicator. The default is 9.
The smoothing factor for the EMA is also changeable, default is 5.
Users have options to display lines at -50, -25, 25, and 50.

Order Block & Fractal Zones (OBFZ) Indicator.The "Order Block & Fractal Zones (OBFZ) Indicator." indicator is a technical analysis tool designed to identify and display key price levels on a chart. It utilizes the concept of Order Blocks and the Fractal Value Zone (FVG) to highlight potential support and resistance areas in the market.
The indicator marks bearish and bullish Order Blocks, which are significant price structures characterized by consecutive higher highs and higher lows for a bearish block, or consecutive lower lows and lower highs for a bullish block. These blocks suggest potential areas of market reversal.
Additionally, the indicator calculates and displays retracement and extension levels within each Order Block. These levels are derived from the previous highest and lowest values within a specified number of candles. The retracement levels include 38.2%, 50%, and 61.8%, while the extension levels include 138.2%, 150%, and 161.8%.
Furthermore, the Fractal Value Zone (FVG) is determined to identify the highest high and lowest low within the selected number of candles. The FVG helps identify areas of significant price action and potential breakout zones.
Overall, the "Order Block & Fractal Zones (OBFZ) Indicator." indicator assists traders in identifying potential support and resistance levels, as well as areas of market reversal or breakout. It can be used to make informed trading decisions based on key price levels within the observed price action.
FDI-Adaptive Supertrend w/ Floating Levels [Loxx]FDI-Adaptive Supertrend w/ Floating Levels is a Fractal Dimension Index adaptive Supertrend indicator. This allows Supertrend to better adaptive to volatility of the market. This also includes floating levels that act as support and resistance, stop loss or take profit, or indication of market reversal. Additional signal types will be added in the future based on these floating levels.
What is the Fractal Dimension Index?
The goal of the fractal dimension index is to determine whether the market is trending or in a trading range. It does not measure the direction of the trend. A value less than 1.5 indicates that the price series is persistent or that the market is trending. Lower values of the FDI indicate a stronger trend. A value greater than 1.5 indicates that the market is in a trading range and is acting in a more random fashion.
What is the Supertrend?
Supertrend indicator was created by Olivier Seban to work on different time frames. It works for futures , forex, and equities. It is used in 15 minutes, hourly, weekly, and daily charts . Based on the parameters of multiplier and period, the indicator normally uses 3 for multiplier and 7 for the ATR period as default values. Average True Range is represented by the number of days while the multiplier is the value by which the range is multiplied.
Included:
Bar coloring
Alerts
Signals

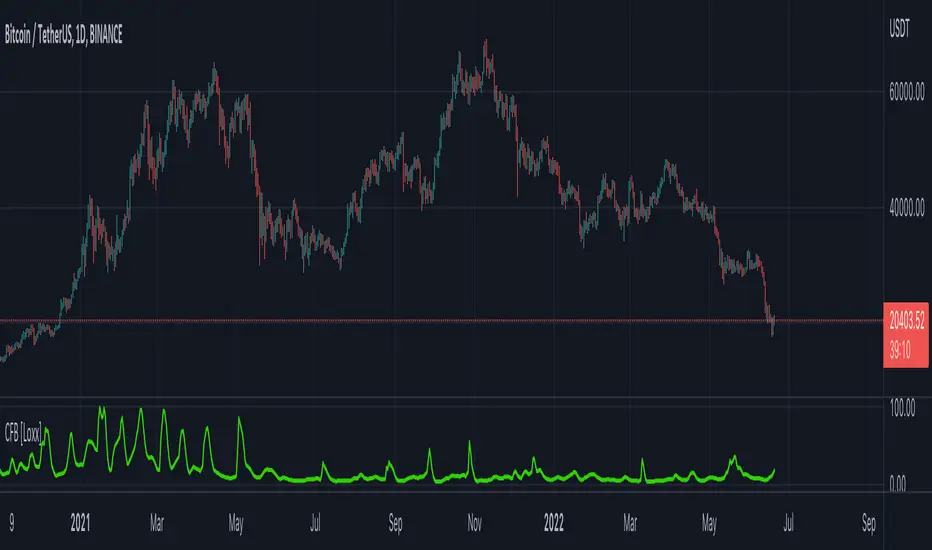
Composite Fractal Behavior (CFB) [Loxx]Composite Fractal Behavior (CFB) is a supplementary indicator used to provide inputs into other indicators in your toolkit. The output of the CFB is price trend duration inputs. This output can be injected into standard indicators for the length inputs in order to make your indicators price trend adaptive. The raw calculation of CFB is doubly smoothed using a Jurik-Filter and then standardized to be greater than or equal to 1.
What is Composite Fractal Behavior ( CFB )?
All around you mechanisms adjust themselves to their environment. From simple thermostats that react to air temperature to computer chips in modern cars that respond to changes in engine temperature, r.p.m.'s, torque, and throttle position. It was only a matter of time before fast desktop computers applied the mathematics of self-adjustment to systems that trade the financial markets.
Unlike basic systems with fixed formulas, an adaptive system adjusts its own equations. For example, start with a basic channel breakout system that uses the highest closing price of the last N bars as a threshold for detecting breakouts on the up side. An adaptive and improved version of this system would adjust N according to market conditions, such as momentum, price volatility or acceleration.
Since many systems are based directly or indirectly on cycles, another useful measure of market condition is the periodic length of a price chart's dominant cycle, (DC), that cycle with the greatest influence on price action.
The utility of this new DC measure was noted by author Murray Ruggiero in the January '96 issue of Futures Magazine. In it. Mr. Ruggiero used it to adaptive adjust the value of N in a channel breakout system. He then simulated trading 15 years of D-Mark futures in order to compare its performance to a similar system that had a fixed optimal value of N. The adaptive version produced 20% more profit!
This DC index utilized the popular MESA algorithm (a formulation by John Ehlers adapted from Burg's maximum entropy algorithm, MEM). Unfortunately, the DC approach is problematic when the market has no real dominant cycle momentum, because the mathematics will produce a value whether or not one actually exists! Therefore, we developed a proprietary indicator that does not presuppose the presence of market cycles. It's called CFB (Composite Fractal Behavior) and it works well whether or not the market is cyclic.
CFB examines price action for a particular fractal pattern, categorizes them by size, and then outputs a composite fractal size index. This index is smooth, timely and accurate
Essentially, CFB reveals the length of the market's trending action time frame. Long trending activity produces a large CFB index and short choppy action produces a small index value. Investors have found many applications for CFB which involve scaling other existing technical indicators adaptively, on a bar-to-bar basis.
What is Jurik Volty used in the Juirk Filter?
One of the lesser known qualities of Juirk smoothing is that the Jurik smoothing process is adaptive. "Jurik Volty" (a sort of market volatility ) is what makes Jurik smoothing adaptive. The Jurik Volty calculation can be used as both a standalone indicator and to smooth other indicators that you wish to make adaptive.
What is the Jurik Moving Average?
Have you noticed how moving averages add some lag (delay) to your signals? ... especially when price gaps up or down in a big move, and you are waiting for your moving average to catch up? Wait no more! JMA eliminates this problem forever and gives you the best of both worlds: low lag and smooth lines.
Ideally, you would like a filtered signal to be both smooth and lag-free. Lag causes delays in your trades, and increasing lag in your indicators typically result in lower profits. In other words, late comers get what's left on the table after the feast has already begun.
JC MAs: SMA, WMA, EMA, DEMA, TEMA, ALMA, Hull, Kaufman, FractalThe best collection of moving averages anywhere. I know, because I searched, couldn't find the right collection, and so wrote it myself!
-------------------------------------------------------------------------------
Notable features that either aren't found anywhere else...or at least in one place:
-------------------------------------------------------------------------------
• The "Triple Exponential Moving Average", is actually that mathematically - rather than "three seperate EMA graphs", as is commonly found on Trading View.
• Includes exotic moving averages: Hull Moving Average (HMA), Kaufman's Adaptive Moving Average (KAMA), and Fractal Apaptive Moving Average (FrAMA).
• Each moving average has its own user-definable averaging length in DAYS, rather than an abstract "length". This is respected even for different graphing resolutions, and different chart views - even for the more exotic MAs.
• Days can be fractional.
• A master time resolution ("Timeframe") is also user-definable. And unlike most other moving average charts, this won't affect the internal "length" variable (specified days are still respected), it only changes the graphing resolution. You can also specify to use chart's resolution - which, as you know, is not very useful for moving averages - yet so many moving average scripts on Trading View don't let you specify otherwise.
• If every CPU cycle counts, you can set "days" to 0 to prevent a particular unneeded moving average from being calculated at all.
• Includes a custom moving average that is unique, if you're looking for a tiny edge in TA to beat everyone else looking at the same stuff: a customizable weighted blend of SMA, TEMA, HMA, KAMA, and FrMA. (Note: The weights for these blends don't have to add up to 100, they will self-level no matter what they add up to.)
• By default, the averages are color-coded according to rainbow order of light spectrum frequency, relative to approximate responsiveness to current price: Red (SMA) is the laziest, violet (FrAMA) is the most hyper, and green is in the middle.
-------------------------------------------------------------------------------
Contains the following moving averages, in order of responsiveness:
-------------------------------------------------------------------------------
• Simple Moving Average (SMA)
• Arnaud Legoux Moving Average (ALMA)
• Exponential Moving Average (EMA)
• Weighted Moving Average (WMA)
• Blend average of SMA and TEMA (JCBMA)
• Double Exponential Moving Average (DEMA)
• Triple Exponential Moving Average (TEMA)
• Hull Moving Average (HMA)
• Kaufman's Adaptive Moving Average (KAMA)
• Fractal Apaptive Moving Average (FrAMA)
Note: There are a few extreme edge cases where the graphs won't render, which are obvious. (Because they won't render.) In which case, all you need to do is choose a more sane master resolution ("Timeframe") relative to the timeframe of the chart. This is more about the limits of Trading View, than specific script bugs.
-------------------------------------------------------------------------------
Includes reworked code snippets
-------------------------------------------------------------------------------
• "Kaufman Moving Average Adaptive (KAMA)" by HPotter
• "FRAMA (Ehlers true modified calculation)" by nemozny
• Which in turn was based on "Fractal Adaptive Moving Average (real one)" by Shizaru

Polarized Fractal EfficiencyPolarized Fractal Efficiency
Description:
Technically, Polarized Fractal Efficiency (PFE) is a measure of market choppiness. It is an indicator derived from fractal geometry, the mathematics that describes chaotic systems.
This technical indicator was developed by Hans Hannula to determine price efficiency over a user-defined period. This indicator fluctuates between -100 and +100, with 0 as the centerline. Securities with a PFE greater than zero are deemed to be trending up, while a reading of less than zero indicates the trend is down. Polarized Fractal Efficiency's signature characteristic is its use of fractal geometry in determining how efficiently a security's price is moving.
This script uses a customized version of PFE formula and generates a long entry signal when the Polarized Fractional Efficiency (PFE) value crosses over a signal line, and/or generates a short entry signal when the PFE value crosses under a signal line.
The Polarized Fractional Efficiency indicator can be used to determine price efficiency over a user-defined time period. Assets with a PFE greater than zero are deemed to be trending up, while a reading of less than zero indicates the trend is down. The strengh of the trend is measured by the position of the PFE relative to the zero line.
As a general rule, the further the PFE value is away from zero, the stronger and more efficient the given trend is. A PFE value that fluctuates around the zero line could indicate that the supply and demand for the security are in balance and price may trade sideways.

PpSignal Fractal Adaptive Moving AverageThe Fractal Adaptive Moving Average (FRAMA) is an intelligent, adaptive moving average that was developed by John Ehlers. It takes the importance of price changes into account and follows price closely with significant moves while remaining flat if price ranges. The FRAMA takes advantage of the fact that markets are fractal and dynamically adjusts the lookback period based on this fractal geometry. The actual calculation is very elaborate and complicated. The FRAMA is often used in combination with other signals and analysis techniques.
www.stockspotter.com
www.metatrader5.com

[AU] Fibonacci Fractal Regression ChannelFibonacci Fractal Regression Channel v01
Based upon:
Fractal Regression Channel V0 () by @RicardoSantos
Note: For use on 4H charts and lower intervals/timeframes
CryptoVN - Price Action Bars and Fractal v2*Mod version from "CM_Price-Action-Bars by ChrisMoody" and "Fractal Support Resistance (Fixed Volume) 2" by synapticEx.
v2:
- Fix some bug
- Allow On/Off Fractal Support & Resistance Levels on chart.
(*)Price Action Bars:
- Yellow = Inside Bar – Breakout Patterns
- Orange = Outside Bar – Breakout Patterns
- Green/Red = Pin Bars
- Aqua/Fuchsia = Shaved Bars
(*) Fractal Support/Resistance on current chart.
(*)My Advice to You:
- The Trend Is Your Friend. TRADE WHAT YOU SEE, NOT WHAT YOU THINK.
Good luck. Happy Trading Life ^^!
-- Notes: for this indicator work, you must set the Candles color look like this:

RSD Fractal Dimension Moving AverageHere is a Fractal Dimension Moving Average , that include a trend follow/divergence based on RSI , Stoch ,and ADX. Combineted this algo with the FDMA algo , we have a MA reactive without following the yo-yo during high volatility period. Can set the range from a min and max bars you want to have your MA , the value are powered , so the min can set 1 to 10 that s is 1 to 60 bars and the Max 13 to 24 range 100 to 300. Period length and RSD len-0.37% are use to calculate Fractal Dimen and Trend parameter
If you need more info how to set go here
etfhq.com

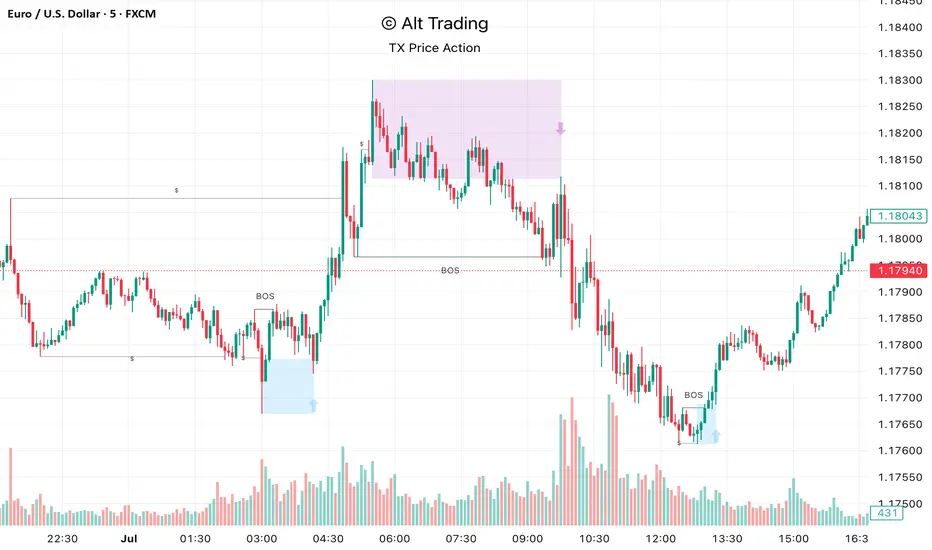
Alt Trading: TX Price Action
The Alt Trading: TX Price Action Indicator is a multi-layered market-structure and liquidity engine built for intraday and swing traders who want a clean, rules-based map of how price is actually moving through liquidity. It runs a fractal-based swing engine in the background to define objective structure, then derives Break-of-Structure (BOS) legs, inducement sweeps, and execution zones from that single model so nothing on the chart is contradictory or “bolted on.” Asian-session profiling builds a dynamic liquidity range that anchors the QuickStrikes filter, allowing you to require BOS and/or entry zones to sit in specific relation to session highs/lows before a setup is even allowed to print. Displacement legs are converted into Fibonacci- and POI-based retracement zones with configurable frequency (High/Medium/Low), automatically projecting forward in time with transparent, non-intrusive boxes for both long and short scenarios. A tiered inducement engine tracks minor (current day), medium (previous day), and major (weekly) highs and lows, promoting levels to permanent lines once they’ve been meaningfully swept, and labeling them directly on the chart for instant context. As sweeps form and BOS confirms, the indicator constructs entry zones, optional risk/reward panels, and live-updating TP/SL visualization boxes that track active long or short scenarios until completion. All elements—zones, BOS lines, inducement levels, fractal structure, arrows, and risk blocks—are fully style-able so the tool can be tuned to any chart theme without losing clarity. TX Price Action doesn’t attempt to “predict” price; instead, it translates complex liquidity behavior into a consistent, visual playbook that makes it easier to systematize premium/discount entries and manage trades with discipline.
Mandelbrot Fractal DimensionThe Mandelbrot Fractal Dimension (D) measures the information density and path complexity of price movements. It quantifies how much a price path fills the space between its starting and ending points:
D ≈ 1.0 : Strong trending behavior (minimal complexity, high predictability)
D ≈ 1.5 : Random walk behavior (maximum complexity, no structure)
D > 1.5 : Mean-reverting behavior (high complexity, bounded movement)
Reference the given link for documentation .

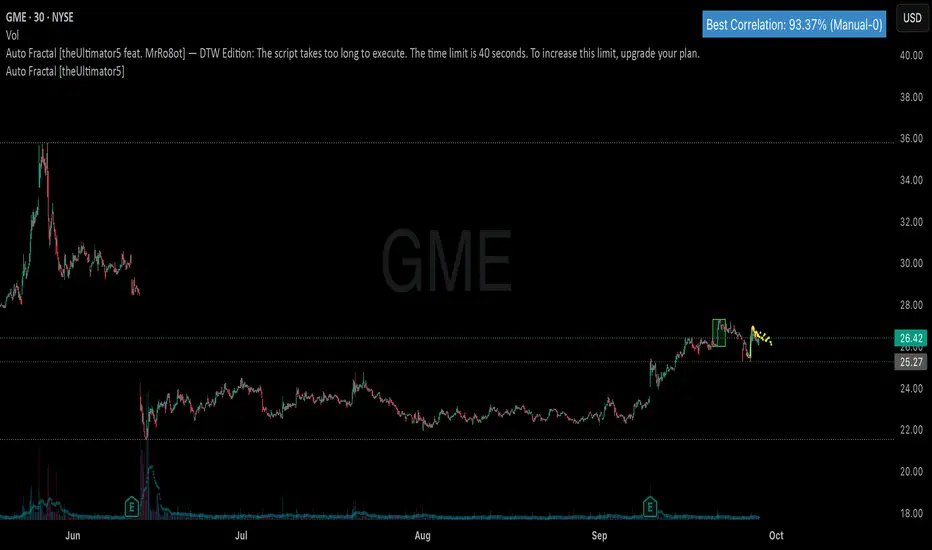
Auto Fractal [theUltimator5 feat. MrRo8ot] — DTW EditionAuto Fractal — DTW Edition
What it does
This tool searches the past for a price pattern that best matches your most recent price action, then maps that pattern onto today’s scale and draws:
an orange line for the matched historical segment, and
a fuchsia dotted line projecting how that pattern continued right after the match.
Under the hood it can use either DTW (Dynamic Time Warping) or Pearson correlation to score matches. DTW is more flexible for wobbly markets; Pearson is faster and stricter.
Be aware, this is not a buy/sell signal generator but a visual context/road-map tool to explore “what the market did last time this shape appeared.”
How to use (quick start)
Add to chart and keep defaults.
Watch the orange line: that’s the historical pattern remapped to today’s scale.
The fuchsia dots show the immediate continuation from that old pattern (a projection, not a promise).
Optional: switch 📊 Analysis Mode to explore different behaviors (see below).
If you want to “freeze time” and check what would’ve been seen at a past moment, enable 📍 Legacy: Manual Point Selection, pick a date/time, and the tool will search from that point back in history.
Reading the on-chart table
Best Match — DTW sim: Similarity score (0–1). Higher ≈ better shape match.
Best Match — Corr: If using Pearson, shows correlation % (closer to 100% ≈ better).
(Live) / (Frozen-X): Live runs on the last bar; Frozen indicates a manual selection and how many bars back the endpoint is.
Configuration options
📊 Analysis Mode
Auto Fractal (default): Finds the best-matching past window and maps it onto today’s recent window.
MOASS / BBBYQ: Same search engine, but the projection is exaggerated deliberately:
MOASS: amplifies bearish impulse in the projection (downside excursion).
BBBYQ: amplifies bullish impulse (upside excursion). Use the multipliers below to tune how “loud” the projection is.
📍 Legacy: Manual Point Selection
Enable Manual Point Selection: When ON, choose date/time to “freeze” the endpoint. The tool then asks: Given price up to that time, what past pattern best matched it?
Great for lightweight backtesting and validating behavior.
🔧 Core parameters
Correlation/DTW Window Length (l): How many recent bars define the shape to match. (Typical 20–60.)
Lookback Range (lb): How far back to search for candidates. Larger = more options, slower.
Future Projection Length (future): How many bars of continuation to draw from the matched pattern.
🎨 Visuals
Show Match Table / Draw Lines/Box: Turn UI and drawing on/off (disabling drawings speeds things up).
Render every k-th point: Skip points for speed (1 = draw every point).
Best Fit / Projection colors: Style the orange (match) and fuchsia (projection) lines.
📐 Autoscale behavior
Autoscale pattern fit (autoscaleDraw): When ON, the matched pattern is linearly mapped to your recent window.
Autoscale style:
Min-Max fit: Stretch the pattern so its min/max aligns with your recent min/max. Preserves shape extremes.
Anchor base: Keep the pattern’s first point anchored to the current endpoint; scale by ranges.
Endpoint fit: Fit the first/last points to the recent first/last.
Least-squares fit (default): Regression fit across the whole window; smooth and robust.
🧱 Clamp (range-cap) controls
These prevent “flat-topping” or clipping by letting you choose where clamping applies.
Clamp mapped lines to recent range (clipToWindow): Master ON/OFF.
Clamp future only: If ON, the orange match is free; only the fuchsia projection is range-limited.
Clamp mode:
None: No clamping.
Hi/Lo recent: Clamp to the recent window’s high/low ± padding.
Hi/Lo wide: Clamp to a wider high/low (X × window length) ± padding.
ATR × N: Clamp around the endpoint price using ATR bands (ATR length & multiplier below).
Clamp padding (fraction): Extra headroom above/below the clamp range (e.g., 0.12 = 12%).
Hi/Lo wide lookback: Multiplier for the wide window.
ATR length / ATR multiplier: For ATR × N clamping.
Tip: If you see the pattern “flat on top,” try Clamp mode = None or Clamp future only = ON, or increase Clamp padding.
📈 Matching engine (DTW / Pearson)
Use DTW: ON = Dynamic Time Warping (flexible shape matching). OFF = Pearson correlation (fast/strict).
DTW Warping Band: 0–0.5; higher allows more time-stretch/bend (0.10–0.20 is common).
Normalization:
zscore (default): Standardize level/volatility; focuses on shape.
returns: Use percent changes; shape from returns.
none: Raw prices (scale sensitive).
DTW Early-Abandon Pruning: Speed optimization; stop bad rows early.
Prune multiplier: How aggressive the pruning is (1.0 = strict; raise if you miss matches).
(Pearson) Minimum Correlation Threshold: If using Pearson, stop early once correlation ≥ threshold.
⚙️ Compute throttles
Compute only on bar close: Save CPU by updating only when bars close.
Recompute every N bars: Further throttle; e.g., 5 updates every 5 bars.
Lookback Candidate Step: Skip candidate starts (e.g., 3 = check every 3rd start) to speed up big lookbacks.
Practical tips
Choose window sizes thoughtfully:
Shorter l captures “micro” swings; longer l captures larger structures.
DTW vs Pearson:
If you want speed and clean, rigid matches → Pearson (Use DTW = OFF).
If you want tolerant shape matching in choppy markets → DTW.
Performance: If it feels heavy, try: lower lb, increase candidateStride, set computeOnBarClose = ON, raise computeEveryN, or disable drawings while testing.
Manual rewind: Enable Manual Point Selection, pick a past time, and the tool shows exactly what would’ve been projected then.
MOASS/BBBYQ multipliers: Tune MOASS projection multiplier / BBBYQ projection multiplier to adjust how strong the dotted projection swings.
What the green box means
A green, semi-transparent box highlights the historical segment that was chosen (in its original location). It’s just a visual cue showing where the orange line came from.
Disclaimer
Past patterns don’t guarantee future outcomes. Use this as a research/visualization aid, not as a standalone trading system. Always combine with risk management and your own analysis.
CANX Supply and Demand - Order Block - Candle Identification© CanxStixTrader
CANX Supply and Demand - Order Block - Candle Identification
Description
Designed as a visual aid, to highlight the last up or down candle before a fractal break. We can assume these candles where the point of origin that generated enough strength to break recent structure. By using them as reference points, traders are expected to follow their own set of rules and mark higher probability supply and demand zones in the area.
How to use:
Expect price to retest in these areas, and if they fail, a potential retest in the opposite direction . The greater the number of times a zone is tested, the more likely it is to break. A fresh zone that has not yet been tested will have a higher probability of a bounce.
Fractal period and candle break type can be customized in the settings. This works on all time frames.
**The indicator is set to my optimal settings for the 5 minute or 15 minute time frame** Please mess around to find your comfort zone and back test the results.
The lower the period number the more noise this creates on the market. The higher the number the less noise and more potential for a stronger zone.
Keep it simple
BTC Markup/Markdown Zones by Koenigsegg📈 BTC Markup/Markdown Zones
A handcrafted indicator designed to mark Bitcoin's most critical High Time Frame (HTF) structure shifts. This tool overlays true institutional-level Markup and Markdown Zones, selected manually after deep market review. Whether you're testing strategies or actively trading, this tool gives you the bigger picture at all times.
🔍 Key Features:
✅ HTF Markup & Markdown Zones
Every zone is manually selected — no indicators, no repainting. Just raw market history and real structure.
✅ Two Display Modes
• Background Zones — soft overlays with low opacity for visual context — with the option to increase opacity manually if desired.
• Start Candle Highlight — sharply highlighted candle marking the final pivot before a macro reversal.
✅ Custom Color Controls (Style Tab)
All visual styling lives in the Style tab, with clearly labeled fields:
• Markup Zone
• Markdown Zone
• Start Candle Highlight Markup
• Start Candle Highlight Markdown
✅ Minimal Input Section
Just one toggle: display mode. Everything else is kept clean and intuitive.
🧠 Purpose:
This script is made for any timeframe:
• Zoom into lower timeframes to know whether you're trading inside a Markup or Markdown
• Use it during strategy testing for true structural awareness
📅 Handpicked Macro Turning Points:
Each zone originates from a manually confirmed candle — the last meaningful candle before a shift in control between bulls and bears:
• FRI 19 AUG 2011 12PM – MARK DOWN
• THU 20 OCT 2011 12AM – MARK UP
• WED 10 APR 2013 12PM – MARK DOWN
• FRI 12 APR 2013 12PM – MARK UP
• SAT 30 NOV 2013 12AM – MARK DOWN
• WED 14 JAN 2015 12PM – MARK UP
• SUN 17 DEC 2017 12PM – MARK DOWN
• SAT 15 DEC 2018 12PM – MARK UP
• WED 14 APR 2021 4AM – MARK DOWN
• TUE 22 JUN 2021 12PM – MARK UP
• WED 10 NOV 2021 12PM – MARK DOWN
• MON 21 NOV 2022 8PM – MARK UP
• THU 14 MAR 2024 4AM – MARK DOWN
• MON 5 AUG 2024 12PM – MARK UP
• MON 20 JAN 2025 4AM – MARK DOWN
💡 Zones are manually updated by me after each new confirmed Markup or Markdown.
🧬 Fractal Structure for MTF Systems
Price is fractal — meaning the same principles of structure repeat across all timeframes. In Version 2, this tool evolves by introducing manually selected sub-zones inside each High Time Frame (HTF) Markup or Markdown. These sub-zones reflect Medium Timeframe (MTF) structure shifts, offering precision for traders who operate on both intraday and swing levels.
This makes the indicator ideal for low timeframe (LTF) Markup/Markdown awareness — whether you're managing 15m entries or building multi-timeframe confluence systems.
No auto-zones. No guesswork. Just clean, intentional structure division within the broader trend, handpicked for maximum clarity and edge.
💡 Pro Tip:
When price is inside a Markup Zone, shorting becomes riskier — you're trading against a macro bullish structure.
When inside a Markdown Zone, longing becomes riskier — you're fighting against confirmed bearish momentum.
Use this tool to stay aligned with the broader move, especially when zoomed into smaller timeframes or managing entries/exits during intraday setups.
📈 Markup Phase – Bullish Sentiment
Definition: A period where price makes higher highs and higher lows — the uptrend is in full force.
Why sentiment is bullish:
- Institutions and smart money are already positioned long.
- Public/institutional demand drives prices up.
- Momentum is supported by positive news, breakouts, and FOMO.
- Higher highs confirm buyers are in control.
📉 Markdown Phase – Bearish Sentiment
Definition: A period where price makes lower lows and lower highs — clear downtrend.
Why sentiment is bearish:
- Distribution has already occurred, and supply outweighs demand.
- Smart money is short or sidelined, waiting for deeper prices.
- Panic selling or trend-following traders add downside momentum.
- Lower lows confirm sellers are in control.
❌ Trading Against the Trend — Consequences:
-Reduced Probability of Success
-You’re fighting the dominant flow. Most participants are pushing in the opposite direction.
-Drawdowns & Stop-Outs
-Countertrend trades often get wicked or flushed before any meaningful move, especially without structure-based entries.
-Low Risk-Reward Ratio
-Trends offer sustained moves. Countertrend trades may have small take-profit zones or chop.
-Mental Drain & Doubt
-Fighting momentum causes anxiety, second-guessing, and emotional reactions.
-Missed Opportunities
-Focusing on fighting the trend makes you blind to the high-probability setups with the trend.
-Increased Transaction Costs
-More stop-outs and re-entries mean more fees, more friction.
-FOMO from Watching the Trend Run
-Entering countertrend means you might watch the trend explode without you.
-Confirmation Bias & Stubbornness
-Countertrend traders often look for reasons to justify staying in the wrong direction — leading to bigger losses.
🧠 Summary
In markup = bulls dominate → you swim with the current.
In markdown = bears dominate → going long is like pushing a rock uphill.
Trading with the trend is not just safer, it's smarter. The edge lives in momentum — not ego.
⚠️ Disclaimer
This indicator is for educational and analytical use only. It is not financial advice and should not be relied on for decision-making without personal analysis.
This is not a predictive tool. No indicator can forecast upcoming price movements.
What you see here is based purely on past market behavior — specifically, historical tops and bottoms that marked the start of confirmed reversals.
This script does not know where the next reversal begins, nor can it determine where a new Markup or Markdown starts or ends. It is designed to provide context, not prediction.
Always trade with responsibility and perform your own due diligence.

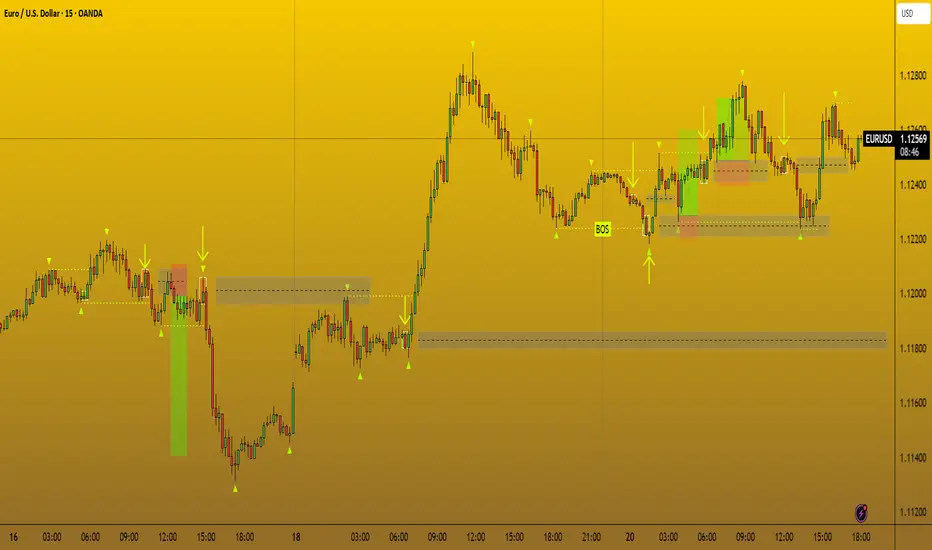
Scalper's Fractal Cloud with RSI + VWAP + MACD (Fixed)Scalper’s Fractal Confluence Dashboard
1. Purpose of the Indicator
This TradingView indicator script provides a high-confluence setup for scalping and day trading. It blends momentum indicators (RSI, MACD), trend bias tools (EMA Cloud, VWAP), and structure (fractal swings, gap zones) to help confirm precise entries and exits.
2. Components of the Indicator
- EMA Cloud (50 & 200 EMA): Trend bias – green means bullish, red means bearish. Avoid longs under red cloud.
- VWAP: Institutional volume anchor. Ideal entries are pullbacks to VWAP in direction of trend.
- Gap Zones: Shows open-air zones (white space) where price can move fast. Used to anticipate momentum moves.
- ZigZag Swings: Marks structural pivots (highs/lows) – useful for stop placement and range anticipation.
- MACD Histogram: Shows bullish or bearish momentum via background color.
- RSI: Overbought (>70) or oversold (<30) warnings. Good for exits or countertrend reversion plays.
- EMA Spread Label: Quick view of momentum strength. Wide spread = strong trend.
3. Scalping Entry Checklist
Before entering a trade, confirm these conditions:
• • Bias: EMA cloud color supports trade direction
• • Price is above/below VWAP (confirming institutional flow)
• • MACD histogram matches direction (green for long, red for short)
• • RSI not at extreme (unless you’re fading trend)
• • If entering gap zone, expect fast move
• • Recent swing high/low nearby for target or stop
4. Risk & Sizing Guidelines
Risk 1–2% of account per trade. Place stop below recent swing low (for longs) or high (for shorts). Use fractional sizing near VWAP or white space zones for scalping reversals.
5. Daily Trade Journal Template
- Date:
- Ticker:
- Setup Type (VWAP pullback, Gap Break, EMA reversion):
- Entry Time:
- Bias (Green/Red Cloud):
- RSI Level / MACD Reading:
- Stop Loss:
- Target:
- Result (P/L):
- What I Did Well:
- What Needs Work:

Bitcoin Logarithmic Fractal Growth Model By ARUDDThis model, which I'm calling the Logarithmic Fractal Growth Mode (L.F.G) , uses Bitcoin's mathematical monetary policy to evaluate the future possible price valuation.
It takes into account fractal (and logarithmic) growth as well as how those who hold bitcoins might react to certain events such as changes in supply and demand. It also shows that it is mathematically logical that someday it must become stable.
The information gained from knowing this helps people make more informed decisions when buying bitcoin and thinking of its future possibilities.
The model can serve as some type of general guideline for determining how much bitcoins should be worth in the future if it follows a certain path from its current price.
Modeling Bitcoin's money supply mathematically, and knowing that there is a finite number of them, makes this whole process much more rational than just thinking about the possibilities in pure subjective terms.
Before going any further I want to say that no one can know with absolute certainty what will happen to bitcoins price in the future, but using mathematics gives us an idea of where things are headed.
The results presented here are based on very reasonable assumptions for how bitcoin might continue to grow (and then level out) once there are over 21 million bitcoins in existence.
The model shows that bitcoin's price can never go down to zero (thus creating the "death spiral" phenomenon), and as such, bitcoin has an extremely high probability of becoming stable as it approaches infinity.
Conversely, this model also shows that at some point there is a high probability that bitcoin will not continue to grow exponentially forever.
Credit goes to Quantadelic for the awesome original script.
ARUDD
