Quantify [Trading Model] | FractalystNote: In this description, "TM" refers to Trading Model (not trademark) and "EM" refers to Entry Model
What’s the indicator’s purpose and functionality?
You know how to identify market bias but always struggle with figuring out the best exit method, or even hesitating to take your trades?
I've been there. That's why I built this solution—once and for all—to help traders who know the market bias but need a systematic and quantitative approach for their entries and trade management.
A model that shows you real-time market probabilities and insights, so you can focus on execution with confidence—not doubt or FOMO.
How does this Quantify differentiate from Quantify ?
Have you managed to code or even found an indicator that identifies the market bias for you, so you don’t have to manually spend time analyzing the market and trend?
Then that’s exactly why you might need the Quantify Trading Model.
With the Trading Model (TM) version, the script automatically uses your given bias identification method to determine the trend (bull vs bear and neutral), detect the bias, and provide instant insight into the trades you could’ve taken.
To avoid complications from consecutive signals, it uses a kNN machine learning algorithm that processes market structure and probabilities to predict the best future patterns.
(You don’t have to deal with any complexity—it’s all taken care of for you.)
Quantify TM uses the k-Nearest Neighbors (kNN) machine learning algorithm to learn from historical market patterns and adapt to changing market structures. This means it can recognize similar market conditions from the past and apply those lessons to current trading decisions.
On the other hand, Quantify EM requires you to manually select your directional bias. It then focuses solely on generating entry signals based on that pre-determined bias.
While the entry model version (EM) uses your manual bias selection to determine the trend, it then provides insights into trades you could’ve taken and should be taking.
Trading Model (TM)
- Uses `input.source()` to incorporate your personal methodology for identifying market bias
- Automates everything—from bias detection to entry and exit decisions
- Adapts to market bias changes through kNN machine learning optimization
- Reduces human intervention in trading decisions, limiting emotional interference
Entry Model (EM)
- Focuses specifically on optimizing entry points within your pre-selected directional bias
- Requires manual input for determining market bias
- Provides entry signals without automating alerts or bias rules
Can the indicator be applied to any market approach/trading strategy?
Yes, if you have clear rules for identifying the market bias, then you can code your bias detection and then use the input.source() user input to retrieve the direction from your own indicator, then the Quantify uses machine-learning identify the best setups for you.
Here's an example:
//@version=6
indicator('Moving Averages Bias', overlay = true)
// Input lengths for moving averages
ma10_length = input.int(10, title = 'MA 10 Length')
ma20_length = input.int(20, title = 'MA 20 Length')
ma50_length = input.int(50, title = 'MA 50 Length')
// Calculate moving averages
ma10 = ta.sma(close, ma10_length)
ma20 = ta.sma(close, ma20_length)
ma50 = ta.sma(close, ma50_length)
// Identify bias
var bias = 0
if close > ma10 and close > ma20 and close > ma50 and ma10 > ma20 and ma20 > ma50
bias := 1 // Bullish
bias
else if close < ma10 and close < ma20 and close < ma50 and ma10 < ma20 and ma20 < ma50
bias := -1 // Bearish
bias
else
bias := 0 // Neutral
bias
// Plot the bias
plot(bias, title = 'Identified Bias', color = color.blue,display = display.none)
Once you've created your custom bias indicator, you can integrate it with Quantify :
- Add your bias indicator to your chart
- Open the Quantify settings
- Set the Bias option to "Auto"
- Select your custom indicator as the bias source
The machine learning algorithms will then analyze historical price action and identify optimal setups based on your defined bias parameters. Performance statistics are displayed in summary tables, allowing you to evaluate effectiveness across different timeframes.
Can the indicator be used for different timeframes or trading styles?
Yes, regardless of the timeframe you’d like to take your entries, the indicator adapts to your trading style.
Whether you’re a swing trader, scalper, or even a position trader, the algorithm dynamically evaluates market conditions across your chosen timeframe.
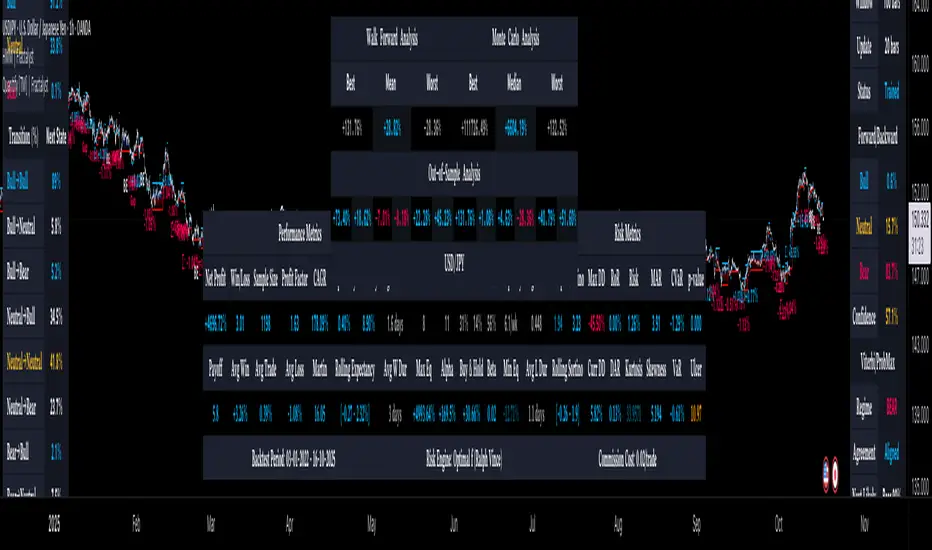
How Quantify Helps You Trade Profitably?
The Quantify Trading Model offers several powerful features that can significantly improve your trading profitability when used correctly:
Real-Time Edge Assessment
It displays real-time probability of price moving in your favor versus hitting your stoploss
This gives you immediate insight into risk/reward dynamics before entering trades
You can make more informed decisions by knowing the statistical likelihood of success
Historical Edge Validation
Instantly shows whether your trading approach has demonstrated an edge in historical data
Prevents you from trading setups that historically haven't performed well
Gives confidence when entering trades that have proven statistical advantages
Optimized Position Sizing
Analyzes each setup's success rate to determine the adjusted Kelly criterion formula
Customizes position sizing based on your selected maximum drawdown tolerance
Helps prevent account-destroying losses while maximizing growth potential
Advanced Exit Management
Utilizes market structure-based trailing stop-loss mechanisms
Maximizes the average risk-reward ratio profit per winning trade
Helps capture larger moves while protecting gains during market reversals
Emotional Discipline Enforcement
Eliminates emotional bias by adhering to your pre-defined rules for market direction
Prevents impulsive decisions by providing objective entry and exit signals
Creates psychological distance between your emotions and trading decisions
Overtrading Prevention
Highlights only setups that demonstrate positive expectancy
Reduces frequency of low-probability trades
Conserves capital for higher-quality opportunities
Systematic Approach Benefits
By combining machine learning algorithms with your personal bias identification methods, Quantify helps transform discretionary trading approaches into more systematic, probability-based strategies.
What Entry Models are used in Quantify Trading Model version?
The Quantify Trading Model utilizes two primary entry models to identify high-probability trade setups:
Breakout Entry Model
- Identifies potential trade entries when price breaks through significant swing highs and swing lows
- Captures momentum as price moves beyond established trading ranges
- Particularly effective in trending markets when combined with the appropriate bias detection
- Optimized by machine learning to filter false breakouts based on historical performance
Fractals Entry Model
- Utilizes fractal patterns to identify potential reversal or continuation points
- Also uses swing levels to determine optimal entry locations
- Based on the concept that market structure repeats across different timeframes
- Identifies local highs and lows that form natural entry points
- Enhanced by machine learning to recognize the most profitable fractal formations
- These entry models work in conjunction with your custom bias indicator to ensure trades are taken in the direction of the overall market trend. The machine learning component analyzes historical performance of these entry types across different market conditions to optimize entry timing and signal quality.
How Does This Indicator Identify Market Structure?
1. Swing Detection
• The indicator identifies key swing points on the chart. These are local highs or lows where the price reverses direction, forming the foundation of market structure.
2. Structural Break Validation
• A structural break is flagged when a candle closes above a previous swing high (bullish) or below a previous swing low (bearish).
• Break Confirmation Process:
To confirm the break, the indicator applies the following rules:
• Valid Swing Preceding the Break: There must be at least one valid swing point before the break.
3. Numeric Labeling
• Each confirmed structural break is assigned a unique numeric ID starting from 1.
• This helps traders track breaks sequentially and analyze how the market structure evolves over time.
4. Liquidity and Invalidation Zones
• For every confirmed structural break, the indicator highlights two critical zones:
1. Liquidity Zone (LIQ): Represents the structural liquidity level.
2. Invalidation Zone (INV): Acts as Invalidation point if the structure fails to hold.
How does the trailing stop-loss work? what are the underlying calculations?
A trailing stoploss is a dynamic risk management tool that moves with the price as the market trend continues in the trader’s favor. Unlike a fixed take profit, which stays at a set level, the trailing stoploss automatically adjusts itself as the market moves, locking in profits as the price advances.
In Quantify, the trailing stoploss is enhanced by incorporating market structure liquidity levels (explain above). This ensures that the stoploss adjusts intelligently based on key price levels, allowing the trader to stay in the trade as long as the trend remains intact, while also protecting profits if the market reverses.
What is the Kelly Criterion, and how does it work in Quantify?
The Kelly Criterion is a mathematical formula used to determine the optimal position size for each trade, maximizing long-term growth while minimizing the risk of large drawdowns. It calculates the percentage of your portfolio to risk on a trade based on the probability of winning and the expected payoff.
Quantify integrates this with user-defined inputs to dynamically calculate the most effective position size in percentage, aligning with the trader’s risk tolerance and desired exposure.
How does Quantify use the Kelly Criterion in practice?
Quantify uses the Kelly Criterion to optimize position sizing based on the following factors:
1. Confidence Level: The model assesses the confidence level in the trade setup based on historical data and sample size. A higher confidence level increases the suggested position size because the trade has a higher probability of success.
2. Max Allowed Drawdown (User-Defined): Traders can set their preferred maximum allowed drawdown, which dictates how much loss is acceptable before reducing position size or stopping trading. Quantify uses this input to ensure that risk exposure aligns with the trader’s risk tolerance.
3. Probabilities: Quantify calculates the probabilities of success for each trade setup. The higher the probability of a successful trade (based on historical price action and liquidity levels), the larger the position size suggested by the Kelly Criterion.
How can I get started to use the indicator?
1. Set Your Market Bias
• Choose Auto.
• Select the source you want Quantify to use as for bias identification method (explained above)
2. Choose Your Entry Timeframes
• Specify the timeframes you want to focus on for trade entries.
• The indicator will dynamically analyze these timeframes to provide optimal setups.
3. Choose Your Entry Model and BE/TP Levels
• Choose a model that suits your personality
• Choose a level where you'd like the script to take profit or move stop-loss to BE
4. Set and activate the alerts
What tables are used in the Quantify?
• Quarterly
• Monthly
• Weekly
Terms and Conditions | Disclaimer
Our charting tools are provided for informational and educational purposes only and should not be construed as financial, investment, or trading advice. They are not intended to forecast market movements or offer specific recommendations. Users should understand that past performance does not guarantee future results and should not base financial decisions solely on historical data.
Built-in components, features, and functionalities of our charting tools are the intellectual property of @Fractalyst Unauthorized use, reproduction, or distribution of these proprietary elements is prohibited.
- By continuing to use our charting tools, the user acknowledges and accepts the Terms and Conditions outlined in this legal disclaimer and agrees to respect our intellectual property rights and comply with all applicable laws and regulations.
Wyszukaj w skryptach "Fractal"
Fractal Dimension Index Adaptive Period [Loxx]Fractal Dimension Index Adaptive Period is the adaptive period out of Fractal Dimension Index Adaptivity. This isn't an indicator that shows a signal, instead, it's to be used as auxiliary support and an educational tool to create other indicators. This value can be injected into other indicators to make those indicators Fractal Dimension Index Adaptive.
What is the Fractal Dimension Index?
The goal of the fractal dimension index is to determine whether the market is trending or in a trading range. It does not measure the direction of the trend. A value less than 1.5 indicates that the price series is persistent or that the market is trending. Lower values of the FDI indicate a stronger trend. A value greater than 1.5 indicates that the market is in a trading range and is acting in a more random fashion.
Included
Loxx's Expanded Source Types

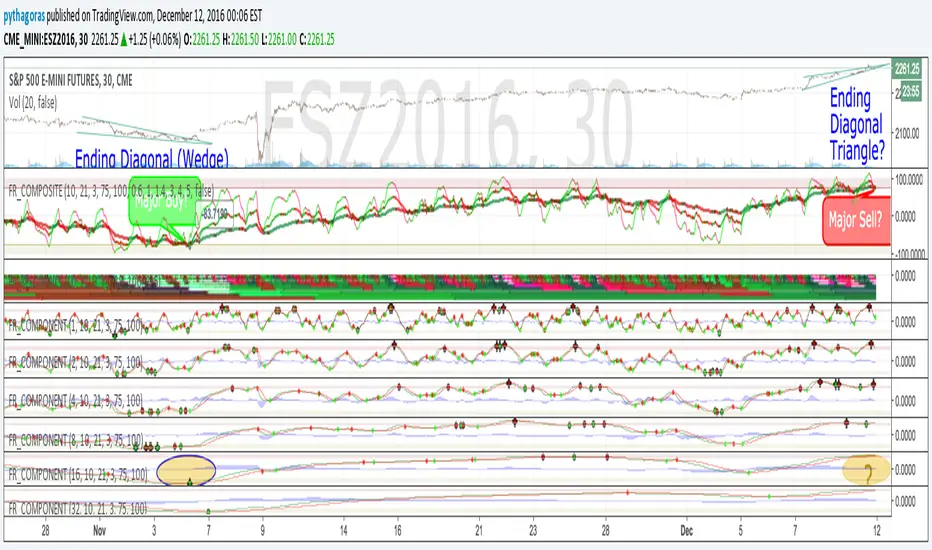
Fractal Resonance CompositeFractal Resonance Composite compresses 8 timescales of stochastic oscillators into just 3 color-coded composite lines: fast, medium and slow. Fast emphasizes the shorter timescale oscillators, medium considers all 8 timescales evenly, and slow emphasizes the longer timeframe oscillators. The composite lines indicate how overbought/sold the market is relative to the size of its recent movements. Major buys occur when all three composites enter the Oversold (green shaded) range and turn up, and major sells when all three reach the Overbought (red shaded) range and turn down. The fast line's quicker reversals and exaggerated alternations on smaller price moves makes it more fit for scalping. Notice the fast and medium lines tend to snap back toward the slow line like stretched rubber bands.
As is particularly apparent in the slow line, the nifty mathematics of the compositing process reconstruct the topology (peaks and valleys) of the underlying price curve in a smoothly distorted "cartoon" form that has a very useful property: the composite lines are confined to +-100% Extreme Overbought/sold oscillatory ranges. (By definition, only extremely rare "parabolic" moves can push all 3 composites beyond +-100%). If we knew that price would always stay confined to a certain range, trading would be much easier, no? Always buy the bottom of the range and sell the top!
How it works
To understand what's behind this nifty property, consider the mathematics of LazyBear's WaveTrend port .
The formula is fairly simple as indicators go yet statistically fundamental in a way that suggests it should have been the grandfather of all market stochastic oscillators. It's just a running average of the ratio:
(price's current deviation from it's mean)
-----------------------------------------------------------
(running average of absolute |price deviation from the mean| )
In formal statistics notation this is written:
E{ (X - E{X}) / E{|X-E{X}|} }
Where X is the price random variable and E{} the averaging or Expectation operator, implemented in this oscillator as exponential moving averages.
Conceptually, the denominator measures and normalizes by the typical size of recent price moves. This normalization process is what stretches or compresses the local price movements such that the whole composite curve can stay within the oscillatory range.
Attributes
The default fast=.6, medium=1, slow=1.4 compositing factors give each line visually distinct behavior, but can be tweaked to emphasize different oscillator "speeds".
Particular lines can be disabled by setting their line width to 0.
Fractals by KaraTradeFractals by KaraTrade
OVERVIEW
This indicator identifies fractal patterns on the chart, which are key reversal points in price action. Fractals help traders identify potential support and resistance levels, as well as trend reversal zones.
WHAT IS A FRACTAL?
A fractal is a pattern where a central candle's high or low is surrounded by lower highs or higher lows on both sides. Fractals indicate where the market has made a local extreme and potentially reversed direction.
FEATURES
5-Candle Fractals (Dark Gray X marks)
Stronger signals with strict pattern validation
Requires a clear sequence where each candle progressively moves toward the center and then away
Bearish fractal: high < high < high > high > high
Bullish fractal: low > low > low < low < low
The central candle must be the highest high (bearish) or lowest low (bullish)
Displayed with offset=-2 on the central candle
3-Candle Fractals (Light Gray Triangles)
Weaker signals for more frequent patterns
Simpler pattern: central candle must be higher or lower than both neighbors
Bearish fractal: high < high > high
Bullish fractal: low > low < low
Displayed with offset=-1 on the central candle
SETTINGS
Show 5-Candle Fractals: Toggle 5-candle fractal display
Show 3-Candle Fractals: Toggle 3-candle fractal display
HOW TO USE
Bearish Fractals (top): Potential resistance levels or sell zones
Bullish Fractals (bottom): Potential support levels or buy zones
Use in combination with other indicators for confirmation
5-candle fractals are more reliable but less frequent
3-candle fractals provide more signals but require additional confirmation
TECHNICAL DETAILS
Uses strict sequential logic (no equal values allowed)
Based on high/low prices (including wicks/shadows)
Displays with a delay for pattern confirmation
Compatible with all timeframes
Created by KaraTrade

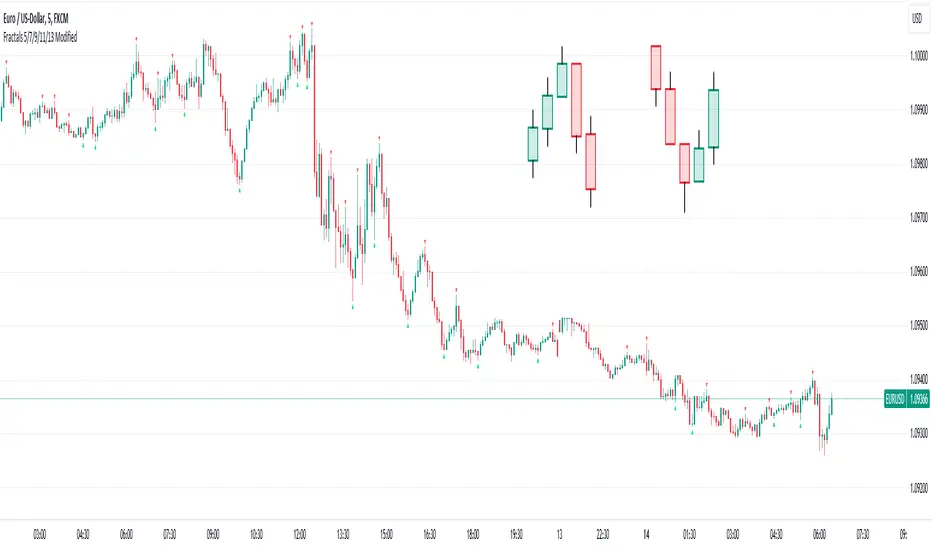
Fractals 5/7/9/11/13 ModifiedDescription:
The Modified Fractals Indicator is designed to help traders identify specific fractal patterns on a chart. Unlike traditional Williams Fractals, this indicator focuses on highlighting two distinct types of fractals:
- UpFractals: These fractals are identified when each preceding candle has a higher high than the one before it, and each succeeding candle has a higher high than the one following it.
- DownFractals: Conversely, DownFractals are detected when each preceding candle has a lower low than the one before it, and each succeeding candle has a lower low than the one following it.
This unique approach sets it apart from standard Fractal indicators.
Features:
1. Originality and Uniqueness: This indicator employs a distinctive algorithm to detect and display modified fractals, providing a fresh perspective on price reversals.
2. Customizable Parameters: Users can fine-tune the indicator to their trading strategy by adjusting the candle count and arrow size.
3. Easy-to-Understand Chart: The Modified Fractals Indicator is designed to provide clear and easily identifiable signals on your chart, enhancing your trading experience.
4. User-Friendly Interface: This indicator is user-friendly and can be easily integrated into your TradingView setup.
How it Works:
The Modified Fractals Indicator scans the price action on your chart and identifies specific fractal patterns based on the criteria mentioned above for both UpFractals and DownFractals.
Usage:
- Add the Modified Fractals Indicator to your TradingView chart.
- Customize the settings, including the candle count and arrow size, to align with your trading strategy.
- Observe the chart for the appearance of UpFractals and DownFractals as marked by the indicator's arrows.
- Use the signals provided by the indicator to inform your trading decisions, such as potential entry or exit points.
Please note that this Modified Fractals Indicator offers a unique approach to fractal analysis, focusing on specific price patterns that differ from traditional Williams Fractals. It provides traders with an additional tool for identifying potential trend reversals and market opportunities.
Fractals + FVG [Combined]Звісно, ось варіант опису англійською, який можна використати для публікації індикатора в TradingView.
Description
This script combines two powerful and widely-used trading concepts into a single, comprehensive indicator: Bill Williams Fractals with dynamic support/resistance lines and Fair Value Gaps (FVG) based on the popular logic from LuxAlgo.
The goal is to provide a cleaner chart by merging two essential tools, allowing traders to analyze market structure and imbalances simultaneously.
Features
1. Williams Fractals with Invalidation Lines
This part of the indicator identifies classic Bill Williams fractals and enhances them with a unique visualization feature.
Fractal Detection: Automatically identifies both bullish (bottom) and bearish (top) fractals. You can choose between a 3-bar or 5-bar pattern in the settings.
Dynamic S/R Lines: A horizontal line is automatically drawn from every confirmed fractal, acting as a potential support or resistance level.
Automatic Invalidation: A line is considered "invalidated" or breached when the body of a candle closes past it. When this happens, the line stops extending, changes its color to the "invalidated" color, and remains on the chart as a historical reference. This provides a clear, objective signal that a level has been broken.
Customization: You can fully customize the colors for the support, resistance, and invalidated lines to match your chart theme.
2. Fair Value Gaps (FVG) / Imbalance
This module incorporates the robust FVG detection logic from LuxAlgo to automatically identify and display market imbalances.
FVG Detection: Highlights bullish and bearish Fair Value Gaps on the chart with colored boxes, representing inefficiencies in price delivery.
Automatic Mitigation: The FVG boxes are automatically removed from the chart once the price has "mitigated" or filled the gap, keeping your workspace clean and focused on active imbalances.
Multi-Timeframe (MTF): You can set the indicator to find and display FVGs from a higher timeframe directly on your current chart.
Dashboard: An optional on-screen dashboard provides a quick summary of the total count of bullish/bearish FVGs and the percentage that have been mitigated.
Full Customization: Control the colors of FVG boxes, extend their length, and configure other visual style settings.
How to Use
Fractal Lines: Use the active support and resistance lines as key levels for potential bounces or breaks. A line's invalidation can serve as confirmation of a shift in market structure.
FVG Zones: Fair Value Gaps often act as "magnets" for price. Use these zones as potential targets for your trades or as areas of interest for entries when price retraces to fill the imbalance.
Combined Strategy: The true power of this indicator comes from combining both concepts. For example, a bullish FVG forming near a key fractal support level can create a high-probability confluence zone for a long entry. Similarly, a break and invalidation of a fractal resistance line might signal that price is heading towards the next bearish FVG above.
This indicator is a tool for analysis and should be used in conjunction with your own trading strategy and risk management rules.

Fractal_Trend_MTFFractal_Trend_MTF - 3 fractal trend time frames in 1
Ability to view the fractal trend of 3 times frames in one indicator
Time frames are user configurable
Turn on/off agreement highlights
Specify if a candles needs to close above/below a fractal level to consider it broken - or just break it with its high/low
Alerts enabled for each time-frame and for when all time frames are all in agreement
Usage Note: To accurately display the fractal trends the chart must be opened on a time-frame that is equal to or less than the lowest time-frame specified in the indicator. Tradingview can accurately display higher time frame information on a lower time frame chart but not vice-versa. e.g If the lowest time frame selected is the H1 then view the indicator on the H1 chart or below.

Fractalyst Moving Average [Adaptive] | FractalystWhat's the indicator purpose and functionality?
Moving averages are widely used technical indicators in trading.
Typically, they provide reliable entry signals in trending markets but can falter during consolidation periods.
Now, imagine a moving average that adjusts to market conditions.
The Fractalyst Moving Average does just that by adapting to the market's noise level, which is the erratic price movement within trends or consolidation phases.
This indicator incorporates market structure into moving averages to more effectively identify potential market trends.
By dynamically calculating moving averages based on external swing highs and lows, it offers robust trend identification and adapts to different market conditions, giving traders valuable insights into current market condition.
------
How does FRMA react in a trending and consolidating market?
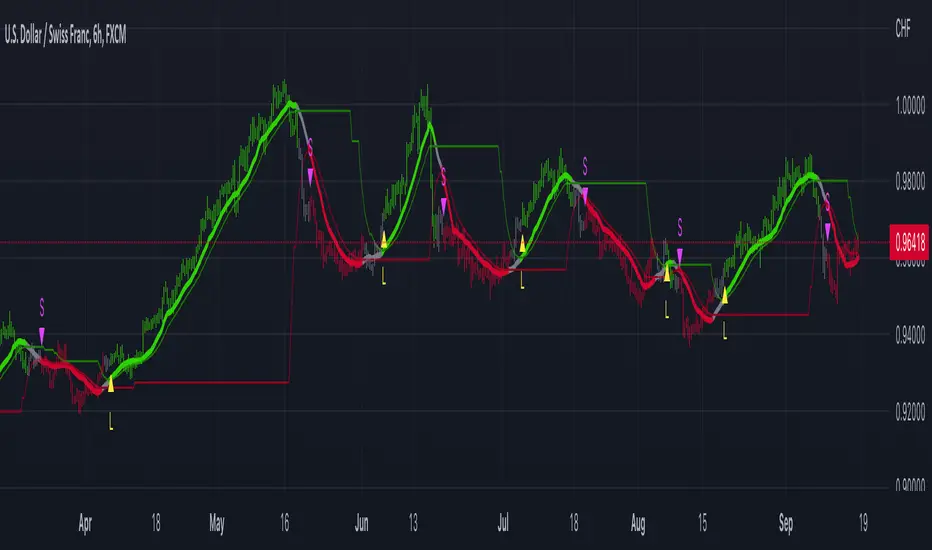
When the market trends, the FRMA adjusts quickly to price movements, closely tracking the trend and positioning itself close to prices. This responsiveness allows it to provide timely signals and effectively capture trends.
However, in consolidating markets where there is little net change in price over time, the FRMA reacts slowly. As consolidation prolongs, the FRMA may even cease to move significantly, appearing non-reactive. This characteristic helps minimize false signals and unnecessary trades during periods of market indecision.
Notice how the FRMA tracks prices closely when the market is trending. When the market begins to consolidate, however, the FRMA becomes relatively unresponsive and stays horizontal.
------
What are the underlying calculations behind FRMA?
Identifying Swing Highs and Lows: FRMA begins by identifying the most recent external swing highs and lows, which are key pivot points in the market's price structure.
Defining Market Structure: It calculates the distance between these external swing levels. When price remains confined between these levels, indicating a horizontal market, it signifies minor intermediate ranges or a lack of clear trend direction.
Adapting to Breaks of Structure: When a new break of structure occurs—such as a significant price movement above a previous swing high or below a swing low—the FRMA updates dynamically.
It adjusts its values to reflect the midpoint (50%) of the distance between the external swing highs and lows.
This adjustment helps the FRMA react promptly to changes in different market environments.
------
How to use the FRMA in trading?
In a trend-following context, the FRMA provides clear signals for trading:
Buying Signal: Look to buy when the FRMA is rising. This indicates that the market is in an uptrend, with prices consistently moving higher. Buying at these points aligns with the trend momentum and increases the likelihood of capturing profitable movements.
Selling Signal: Consider selling when the FRMA is falling. A declining FRMA suggests that the market is in a downtrend, where prices are consistently decreasing. Selling during these periods helps capitalize on downward movements and potential profit-taking opportunities.
Avoiding Trades: Avoid trading when the FRMA appears horizontal and the market is consolidating. This indicates a lack of clear trend direction or significant price movement, which can lead to choppy price action and increased risk of false signals. Waiting for the FRMA to resume a clear trend direction can help avoid unnecessary losses in consolidating markets.
Note: These rules are just examples and may generate numerous false signals. Even when the FRMA is less responsive, it can exhibit frequent changes in direction.
Traders should apply additional filters or confirmatory indicators to refine their trading decisions and mitigate the impact of false signals.
Depending on whether they're employing mean-reversion or trend-following trading styles, traders need to adjust other market filters accordingly.
It's crucial to conduct thorough backtesting using various market conditions and filters to validate and optimize their trading strategies effectively.
This process helps traders identify the settings that best align with their trading goals and market conditions.
------
What makes this moving average unique compared to others?
Yes, it's another moving average, but the Fractalyst Adaptive Moving Average stands out for a compelling reason.
Its calculation is more sophisticated, leveraging market structure to identify potential consolidation and trending environments, similar to conventional moving averages such as SMA and EMA.
------
How does the FRMA's stack up against the other moving averages?
Since markets are always evolving, using adaptive strategy elements like the FRMA certainly makes a whole lot of sense.
However, from a practical standpoint, the only way to find out would be to exhaustively backtest the various moving averages across all markets of interest.
Establishing equivalency between the FRMA and other moving averages may be a little challenging, since the FRMA does not use a single integer value for its lookback period.
Assuming the backtests produced roughly equal results, I’d personally prefer to use the FRMA. Its adaptive qualities give me confidence that the strategy can weather changing market conditions.
------
User-inputs and customizations
------
Terms and Conditions | Disclaimer
Our charting tools are provided for informational and educational purposes only and should not be construed as financial, investment, or trading advice. They are not intended to forecast market movements or offer specific recommendations. Users should understand that past performance does not guarantee future results and should not base financial decisions solely on historical data.
Built-in components, features, and functionalities of our charting tools are the intellectual property of @Fractalyst Unauthorized use, reproduction, or distribution of these proprietary elements is prohibited.
By continuing to use our charting tools, the user acknowledges and accepts the Terms and Conditions outlined in this legal disclaimer and agrees to respect our intellectual property rights and comply with all applicable laws and regulations.

Fractal Chaos & Kalman Trajectory Overview: The Fractal Chaos & Kalman Trajectory is a professional-grade market regime detection tool designed to distinguish between efficient trends and random market noise. Unlike traditional moving averages that suffer from significant lag, this script utilizes a Kalman Filter to estimate the price's true trajectory in real-time.
Core Methodology:
Kalman Filter Engine: An iterative mathematical process that minimizes the mean square error of the price data, providing a smooth line that reacts faster than EMA/SMA.
Hurst Exponent (Fractal Dynamics): This script calculates the fractal dimension of the market.
H > 0.5 (Trend): Indicates persistent market memory; the trend is likely to continue.
H < 0.5 (Mean Reversion): Indicates anti-persistent behavior; the price is likely to revert to the mean.
H = 0.5 (Chaos): Represents Brownian motion; the market is purely random.
How to Use:
AWAKE Signals: Occur when the market breaks out of a chaotic state (Hurst > 0.5) and aligns with the Kalman Trajectory.
Trend Zones: Highlighted backgrounds indicate high-conviction trend environments.
Bar Coloring: Grey bars indicate a "Wait" zone where the market is either random or mean-reverting.
This script is closed-source to protect the proprietary integration of these two quantitative methods.
--

Fractal levels Gold [AstroHub]This indicator detects key fractal points on a price chart and visually marks them with shapes and levels. It helps traders identify potential reversal zones and dynamic support/resistance levels, enhancing market analysis.
Key Features:
Fractal Detection:
The indicator identifies top and bottom fractals using a 5-bar pattern.
A top fractal forms when the middle bar has a higher high compared to the two bars on either side.
A bottom fractal forms when the middle bar has a lower low compared to the two bars on either side.
Fractal Filtering:
The indicator can filter out "pristine" fractals (uninterrupted fractal patterns) based on custom conditions, making it more selective and reducing false signals.
Fractal Plotting:
are plotted as downward triangles.
are plotted as upward triangles.
Users can choose to display or hide fractal points and their corresponding labels.
Fractal Levels:
The indicator automatically plots fractals' levels on the chart, marking potential resistance and support zones.
Fractal levels change dynamically as new fractals are identified.
Customizable Display Options:
Show or hide fractals and levels with adjustable settings.
Choose whether to apply filtering for pristine fractals.
Display the pivot labels to easily track fractal positions.
How It Works:
The indicator uses a simple approach to recognize top and bottom fractals . When a valid fractal is detected, it highlights it on the chart and plots the corresponding price level.
By default, top fractals are shown above the bars (red color), and bottom fractals are shown below the bars (green color).
Fractal levels represent potential reversal points and can act as dynamic support and resistance zones.
Best Use:
The indicator is particularly useful in identifying reversal points and trend changes, helping traders to spot key price levels.
It can be used across various timeframes and markets, particularly for trend-following or reversal strategies.
Customizable Settings:
Show Pivots: Toggle the display of pivot points.
Show Pivot Labels: Display labels for pivot levels.
Show Fractals: Toggle fractal points on the chart.
Show Fractal Levels: Show or hide the levels corresponding to the detected fractals.
Filter for Pristine Fractals: Enable this option to filter out non-pristine fractals for higher accuracy.
Conclusion:
This indicator provides clear, actionable fractal signals, helping traders easily identify critical levels for entry and exit. With customizable settings and visual cues, it's suitable for both novice and expe

Fractals & SweepThe Fractals & Sweep indicator is designed to identify key market structure points (fractals) and detect potential liquidity sweeps around those areas. It visually highlights both Bill Williams fractals and regular fractals, and alerts the user when the market sweeps liquidity above or below the most recent fractal levels.
Fractal Recognition:
Detects both bullish (low) and bearish (high) fractals on the price chart.
Users can choose between:
Bill Williams fractal logic (default), or
Regular fractal logic (when the “Filter Bill Williams Fractals” option is enabled).
Fractals are plotted directly on the chart as red downward triangles for highs and green upward triangles for lows.
Fractal Tracking:
The indicator stores the most recent high and low fractal levels to serve as reference points for potential sweep detection.
Sweep Detection:
A bearish sweep is triggered when the price wicks above the last fractal high but closes below it — suggesting a liquidity grab above resistance.
A bullish sweep is triggered when the price wicks below the last fractal low but closes above it — suggesting a liquidity grab below support.
When a sweep occurs, the indicator draws a horizontal line from the previous fractal point to the current bar.
Alert System:
Custom alerts notify the trader when a bearish sweep or bullish sweep occurs, allowing for timely reactions to potential reversals or liquidity traps.


Fractal Reversal Stage 2Fractal Reversal Stage - is a high-precision trend-following and reversal indicator designed to capture market exhaustion points with mathematical accuracy. It utilizes a multi-timeframe analysis approach, combining momentum filtering with price action confirmation.
The indicator is built on a Non-Repainting Algorithm. Once a candle closes and a signal (BUY/SELL) is printed, it is fixed and will not disappear or shift. This makes it a reliable tool for both manual trading and alert-based strategies. The system includes a built-in state machine to manage trades, trailing trend lines, and a re-entry (averaging) system to optimize positions during deep pullbacks.
Main Features
Anti-Repaint Shield: Signals are confirmed only after the candle closes.
MTF Momentum Filter: Uses a higher timeframe RSI to filter out market noise.
State Machine Logic: Automatically tracks your trade from entry to exit.
Dynamic Re-entry: Provides signals to add to a position during extreme volatility.
Manual: Arguments & Settings
1. Timeframes / Таймфреймы
Working TF (Candles): The timeframe where you look for entry patterns and where the trend line is drawn.
RSI Filter TF: The timeframe for the momentum filter. Usually set higher than the Working TF to identify the global trend.
2. RSI Settings / Настройки RSI
RSI Length: The period for RSI calculation. Lower values are more sensitive; higher values are smoother.
Auto-Adjust Levels: When enabled, the script automatically tightens or loosens entry levels based on the RSI period.
Manual OB/OS Levels: Manually set the "Pale Zone" levels where the indicator starts looking for a trade.
3. Logic & Filters / Логика
Re-entry Dist (ATR Mult): Controls how far the price must move against you before an "Add" (▲/▼) signal appears. Uses ATR for volatility adjustment.
ATR Period: The lookback period for volatility calculation.
Min. Body %: A filter for candle strength. It requires the candle body to be a certain percentage of the total candle range to validate a signal.
4. Visuals / Визуал
Trend Line Width: Adjusts the thickness of the tracking line.
Colors: Customizable colors for exit dots and overbought/oversold background zones.
BUY/SELL Labels: Primary entry signals confirmed at the close of the candle.
Chevrons (▲/▼): Averaging points (Re-entry). These appear when the price moves against the initial trade into extreme zones, signaling an opportunity to optimize the position.
Black Dots: Trade Closure. These dots at the end of the trend lines mark the final exit point where the position should be fully closed.
Trend Lines: Visual tracking of the current active trade.
💡 Recommended Settings for Ethereum (ETH/USDT)
This specific configuration is optimized for the cyclical nature of Ethereum, aiming for "peak-to-peak" trade management:
Working TF: 15 min
RSI Filter TF: 2 hours
RSI Length: 10
Re-entry Dist: 1.5
ATR Period: 14
Min. Body %: 0.6
Note: Markets are diverse. You MUST adjust these settings for each specific coin or asset to account for different volatility and liquidity levels.
For questions regarding setup or optimization, please send a private message.
//______________________________________________________________________________//
Fractal Reversal Stage — это высокоточный трендовый и разворотный индикатор, разработанный для фиксации точек истощения рынка с математической точностью. Он использует мультифрактальный анализ, сочетая импульсную фильтрацию с подтверждением ценового действия.
Алгоритм индикатора не перерисовывает график. Как только свеча закрывается и появляется сигнал (BUY/SELL), он фиксируется и больше не исчезает. Это делает его надежным инструментом как для ручной торговли, так и для стратегий на основе алертов. Система включает в себя встроенную логику управления состоянием сделки, линии сопровождения тренда и систему усреднения (Re-entry).
Основные характеристики
Защита от перерисовки: Сигналы подтверждаются только после закрытия свечи.
MTF Фильтр: Использование старшего таймфрейма RSI для фильтрации рыночного шума.
Логика состояний: Автоматическое ведение сделки от входа до выхода.
Динамическое усреднение: Сигналы для добора позиции при экстремальной волатильности.
Мануал: Аргументы и Настройки
1. Timeframes / Таймфреймы
Working TF (Candles): Рабочий таймфрейм свечей, на котором ищутся паттерны и строится линия тренда.
RSI Filter TF: Таймфрейм для RSI фильтра. Обычно ставится выше рабочего для определения глобального тренда.
2. RSI Settings / Настройки RSI
RSI Length: Период расчета RSI. Меньшие значения более чувствительны, большие — более плавные.
Auto-Adjust Levels: При включении скрипт сам корректирует уровни входа в зависимости от периода RSI.
Manual OB/OS Levels: Ручная настройка уровней «бледной зоны», где начинается поиск сделки.
3. Logic & Filters / Логика
Re-entry Dist (ATR Mult): Определяет, как далеко цена должна уйти против вас, чтобы появился сигнал «Add» (▲/▼). Использует ATR для подстройки под волатильность.
ATR Period: Период усреднения волатильности.
Min. Body %: Фильтр силы свечи. Требует, чтобы тело свечи составляло определенный % от всего диапазона свечи.
4. Visuals / Визуал
Метки BUY/SELL: Основные сигналы на вход, подтвержденные закрытием свечи.
Шевроны (▲/▼): Точки для усреднения (Re-entry). Появляются, когда цена идет против сделки в экстремальные зоны, давая сигнал на добор позиции.
Чёрные точки: Закрытие сделки. Эти точки на концах линий тренда обозначают место выхода, где позиция должна быть полностью закрыта.
Линии тренда: Визуальное сопровождение активной сделки.
💡 Пример настройки для Ethereum (ETH/USDT)
Данная конфигурация оптимизирована для цикличного движения Эфира и нацелена на максимально точный выход на пиках:
Рабочий ТФ: 15 мин
ТФ Фильтра RSI: 2 часа
Период RSI: 10
Dist. Re-entry: 1.5
ATR Period: 14
Мин. тело свечи: 0.6
Важно: Рынки различаются. Вы ДОЛЖНЫ подбирать индивидуальные настройки для каждой монеты или актива, учитывая их волатильность и ликвидность.
По вопросам настройки и оптимизации пишите в личные сообщения.

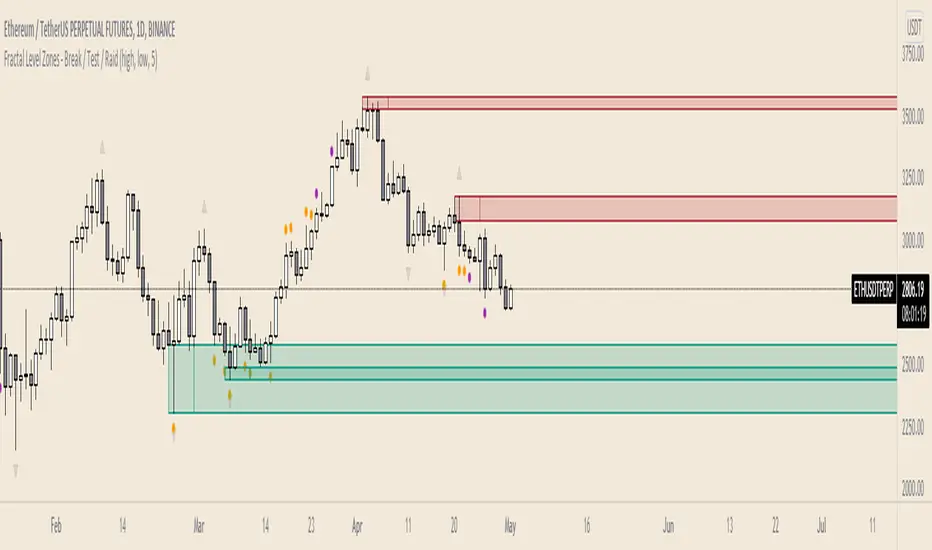
Fractal Level Zones - Break / Test / RaidFractal Level Zones - Break / Test / Raid
An experimental script that marks out the last two unbroken fractal high and low zones. The aim of the script is to focus on the type of candles that form and close in a zone. They can either tap into the zone or break them.
There are a number of outcomes:
- Break
- Break and retest
- Reversal
- Raid
When a zone is broken, the next untested fractal zone is printed.
How to use:
The indicator is to be used on higher time frames (M,W,D/4H). Monitor the type of candles that in form a zone (Daily TF recommended)
Default icon colours
Orange - Test of Zone
Purple - Break of fractal (can also be a raid)
Alert function included
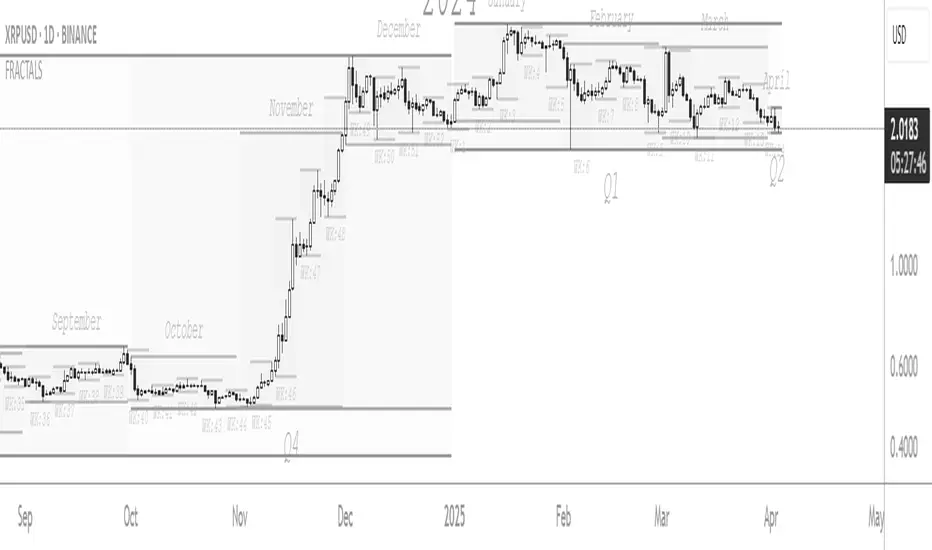
Indicator in Use
Fractals by Aza fractals that show exactly those fractals that are intended for the 3-touch strategy and structure breakdown

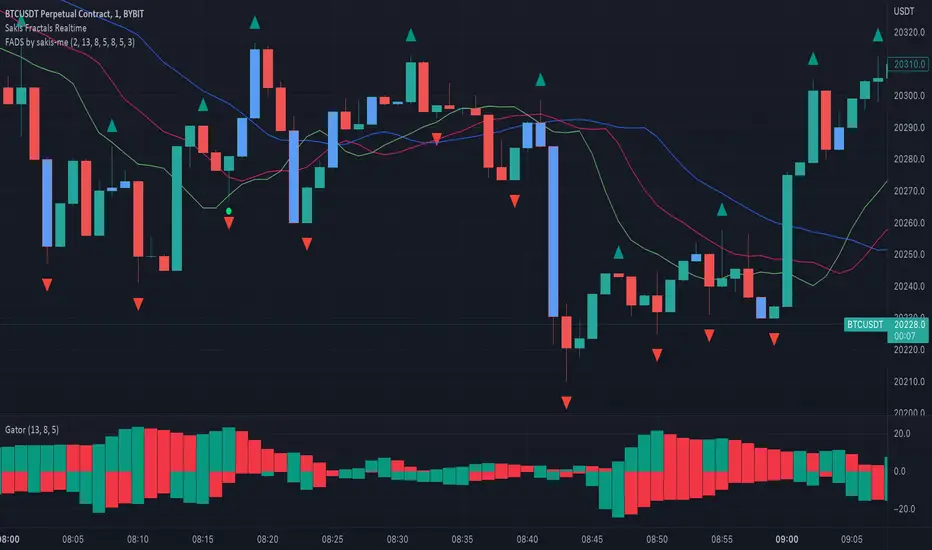
Fractals + Alligator + Divergent Bars + Squat BarsFractals + Alligator + Divergent Bars + Squat Bars Williams Indicators
All combined in one
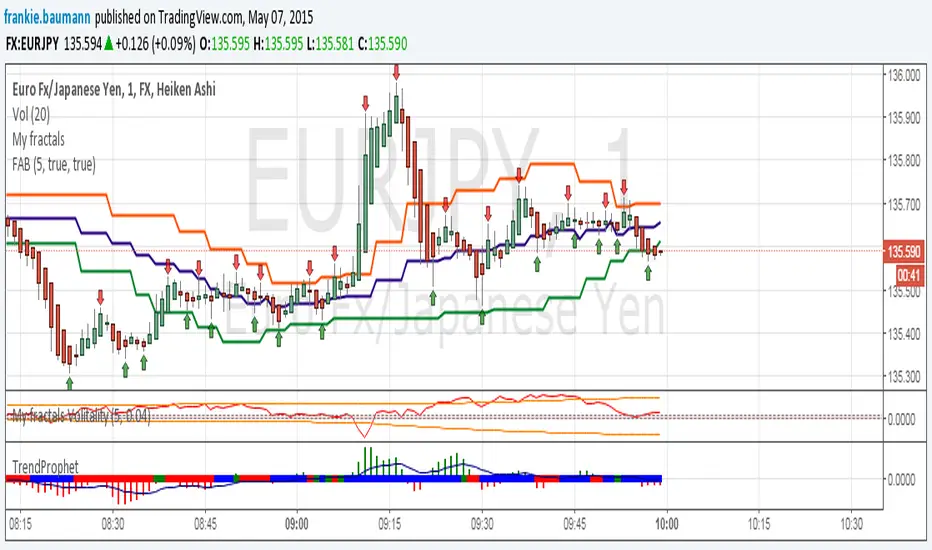
Fractals average breakout [FB]My first indicator.
A simple average of last 1 to 10 fractals (top and bottom)
Trade breakouts of top or bottom lines.
Feel free to use and experiment with.
Frank Baumann
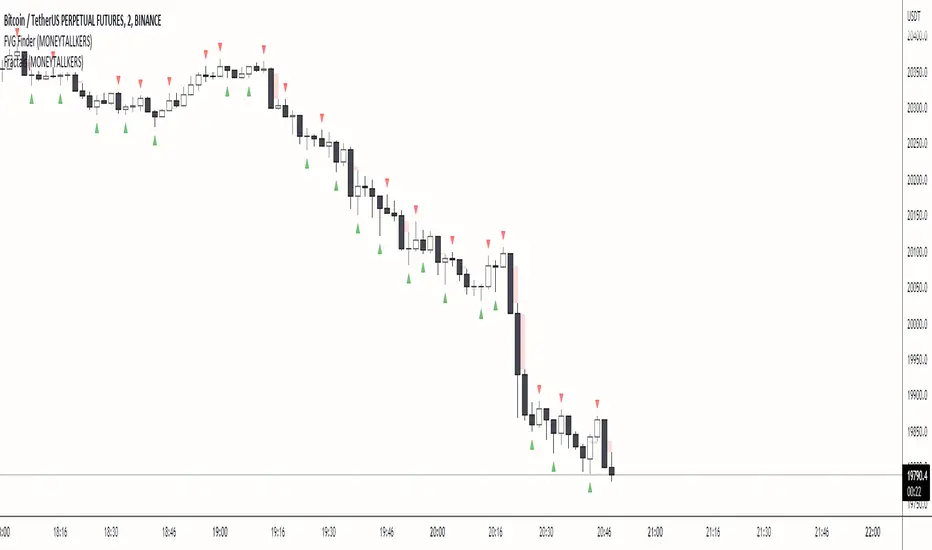
Fractals (MONEYTALLKERS)An indicator to identify fractal highs and lows. It will help you to identify important highs and lows, which contributes to a productive and correct analysis of the chart.
Fractal-Dimension-Adaptive SMA (FDASMA) w/ DSL [Loxx]Fractal-Dimension-Adaptive SMA (FDASMA) w/ DSL is a fractal-dimension-index-adaptive SMA. The SMA is accelerated during a trend and slowed down during a sideways market, so as to avoid false signals. This indicator uses the fractal dimension to compute an ingest period length into the SMA to output the FDASMA.
What is the Fractal Dimension Index?
The goal of the fractal dimension index is to determine whether the market is trending or in a trading range. It does not measure the direction of the trend. A value less than 1.5 indicates that the price series is persistent or that the market is trending. Lower values of the FDI indicate a stronger trend. A value greater than 1.5 indicates that the market is in a trading range and is acting in a more random fashion.
What are DSL Discontinued Signal Line?
A lot of indicators are using signal lines in order to determine the trend (or some desired state of the indicator) easier. The idea of the signal line is easy : comparing the value to it's smoothed (slightly lagging) state, the idea of current momentum/state is made.
Discontinued signal line is inheriting that simple signal line idea and it is extending it : instead of having one signal line, more lines depending on the current value of the indicator.
"Signal" line is calculated the following way :
When a certain level is crossed into the desired direction, the EMA of that value is calculated for the desired signal line
When that level is crossed into the opposite direction, the previous "signal" line value is simply "inherited" and it becomes a kind of a level
This way it becomes a combination of signal lines and levels that are trying to combine both the good from both methods.
In simple terms, DSL uses the concept of a signal line and betters it by inheriting the previous signal line's value & makes it a level.
Included
2 Signal types
Alerts
Loxx's Expanded Source Types
Bar coloring
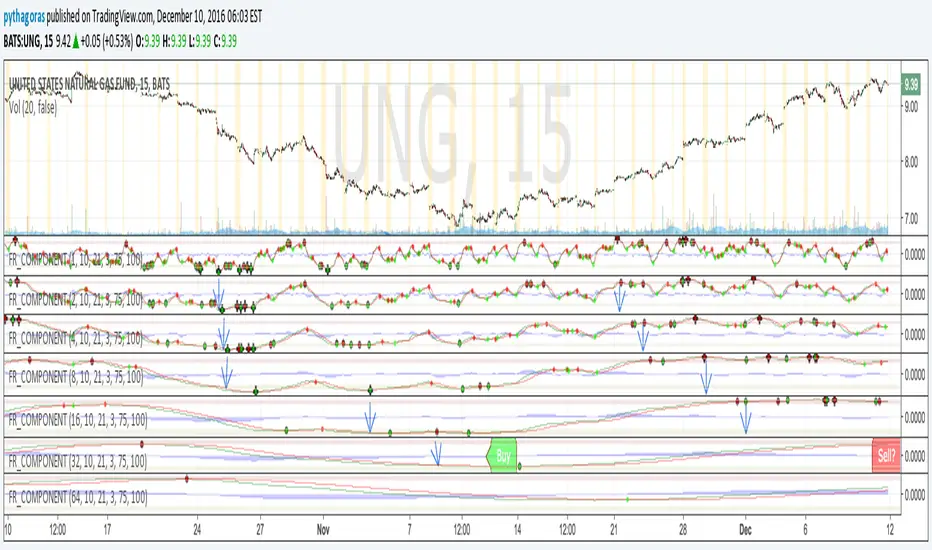
Fractal Composites Ribbon (V2)Compresses 8 fractal oscillator timescales into a ribbon of up to 5 composite lines.
This is a smoother version of the original Fractal Composite with alerts on reversals in the overbought/oversold zones.
Fractal Composites normalize and 'cartoonize' the price chart to fit and bounce between statistically-defined overbought and oversold zones. Each lines resembles the shape of the price wave on a different time/size scale, with some distortion as the size of price movement fluctuates. Conceptually, reaching the overbought/oversold zone corresponds to price reaching a ribbon of Bollinger bands, though our 'band statistics' are much smoother and more mathematically sophisticated than standard Bollinger.
Because markets have similar fractal behavior across all timescales, this indicator applies to any timescale, from 1 minute to 1 hour or 1 day. You shouldn't really need to futz with the numerical parameters -- the most important choice is your chart timescale for how fast you want to trade. A faster timescale will show you more dotted reversals in the overbought/oversold zones to trade. The 'Show...' checkboxes let you choose how many composite lines, lag lines, and crosses to see. Information overload? Or a reminder that any single indicator embeds many assumptions about time and price scale in its signal...

Fractal Resonance ComponentLazyBear's WaveTrend port has been praised for highlighting trend reversals with precision and punctuality (minimal lag). But strong "3rd Wave" trends can "embed" or saturate any oscillator flashing several premature crosses while stuck overbought/oversold. This happens when the trend stretches over a longer timescale than the oscillator's averaging window or filter time constant. Our solution: simultaneously monitor many oscillator timescales. Watch for fresh crossovers in "dominant" timescales alternating most smoothly between the overbought (red shade) and oversold (green shade) range.
Fractal Resonance Component facilitates simultaneous viewing of eight timescales that are power of 2 multiples of the chart timescale. Each timescale shows lead line, lag line, lead-lag difference, and crossover marks. Add 4 to 8 copies to your chart for a good multi-fractal read. Format * the "Timescale Multiplier" attribute of each row to be twice that of the row above for a sequence like 1, 2, 4, 8, 16, 32, 64, 128...
Fractal Resonance Component shifts its timescales along with your choice of main chart timescale:
1 minute chart: 1 minute through 128 minute (~2 hour) oscillators.
1 hour chart: 1 hour through 128 hour (~2 week) oscillators.
Daily chart: 1 day through 128 day (~4 month) oscillators.
Crossovers in different oscillator ranges tend to have different meanings:
Minor (< 75%) crossovers: small green/red dot
usually noise
Overbought/Sold crossovers (shaded 75 to 100%): black outlined dot (o)
reliable reversal indicators (when they appear alone)
Extreme Overbought (> 100%) crossovers: black outlined plus (+).
Can be a major reversal in fast markets, but usually portend the end of Elliot 3rd waves with just a small corrective (4th wave) retrace before the larger impulsive (5-wave) sequence resumes in original direction.
The final 5th-wave terminus should appear later as a lone non-extreme (black outlined circle) crossover on a slower timescale coincident with weaker (non-extreme) dot crosses on this timescale.
Careful examination of historical charts leads to many useful observations such as:
Dominant crossovers punctuating true reversals are usually in the green/red shaded ranges with black outlined dots (o) rather than minor or Extreme (+) ranges.
Due to market's fractal nature, two well-separated timescales like 1 minute and 1 hour can show dominant crosses simultaneously in opposite directions, e.g. the 1 minute showing a very short term high and the 1 hour a medium term low nearby.
Staying Nimble
Watch out for embedding on your supposedly dominant timescale -- a second cross while stuck in the overbought/oversold region suggests a stronger, longer trend than expected. Drop your eyes to a slower timescale below for the real dominant whose crossover will validate main trend reversal.
Embedding can often be predicted even at the first cross mark by checking whether the green lead line of the next slower timescale (one row below) has already hit the Overbought or especially the Extreme Overbought range but isn't close to rolling over. Fractal Resonance Bar (to be published) uses this principle to mark embedded timescales with white stripes, warning of a powerful trend wave on longer timescales you shouldn't fight until the white stripes subside.
Overnight gaps surge all timescales in ways that obscure the dominant timescale, so for shorter than daily charts, these methods work best on Futures contracts that only suffer weekend gaps.
FRACTAL DIMENSIONSFRACTAL DIMENSIONS was created to allow us to properly visualize
the higher time frame dimensional data, While remaining on a lower
time frame. The Fractal dimensions are basically the higher time frames.
Remaining on a lower time frame allows us to get tighter entries and exits.
Each dimension is set in a wave degree formation. From primary to sub-minute,
depending on the time frame being utilized.
These multidimensional wave degrees will be utilized later in the strategy.
This indicator was broken off of the whole for the sake of drawing lines.
The data here is just for debugging purposes and is not used in the strategy,
but yet remains pretty awesome by itself.
Fractal dimensions is the foundation of the main strategy to come.
Now that we have this data, what are we going to do with it?
Fractal-Dimension-Index-Adaptive Trend Cipher Candles [Loxx]Fractal-Dimension-Index-Adaptive Trend Cipher Candles is a candle coloring indicator that shows both trend and trend exhaustion using Fractal Dimension Index Adaptivity. To do this, we first calculate the dynamic period outputs from the FDI algorithm and then we injection those period inputs into a correlation function that correlates price input price to the candle index. The closer the correlation is to 1, the lighter the green color until the color turns yellow, sometimes, indicating upward price exhaustion. The closer the correlation is to -1, the lighter the red color until it reaches Fuchsia color indicating downward price exhaustion. Green means uptrend, red means downtrend, yellow means reversal from uptrend to downtrend, fuchsia means reversal from downtrend to uptrend.
What is the Fractal Dimension Index?
The goal of the fractal dimension index is to determine whether the market is trending or in a trading range. It does not measure the direction of the trend. A value less than 1.5 indicates that the price series is persistent or that the market is trending. Lower values of the FDI indicate a stronger trend. A value greater than 1.5 indicates that the market is in a trading range and is acting in a more random fashion.
Included
Loxx's Expanded Source Types
Related indicators:
Adaptive Trend Cipher loxx]
CFB-Adaptive Trend Cipher Candles
Dynamic Zones Polychromatic Momentum Candles
RSI Precision Trend Candles