Exponential Smoothing FilterThe digital exponential filter, in finance known as Exponential Moving Average (EMA) , can be used as a technical indicator for chart analysis to visualize uptrends and downtrends in the market. Unlike the classic simple moving average, the EMA requires only two values for its calculation: the last calculated exponential average price and the current price. This is a simple and fast calculation - even for wide smoothing windows. For further details and the math please refer to the "exponential smoothing" article on Wikipedia.
Here are some additional key points about the exponential moving average:
The EMA can react more quickly to price changes because it can give more weight to current prices - depending on your parameter settings.
Short-term, disruptive price fluctuations are smoothed out well, making prevailing trends more visible.
Despite good smoothing properties, it delays the input values slightly, so it can follow sudden trend changes well.
The EMA is well suited to dynamic markets and trading strategies.
The filter is a good basis for further processing such as gradient analysis.
How to use
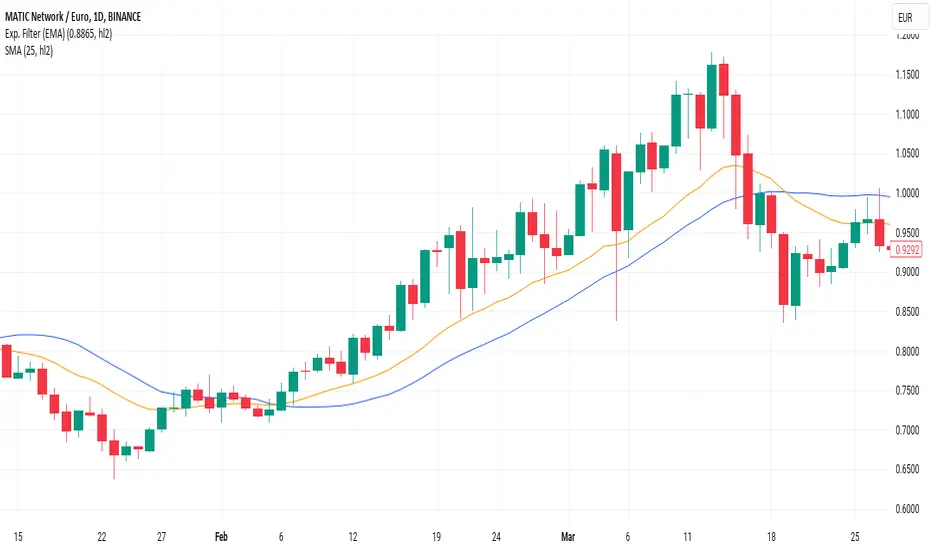
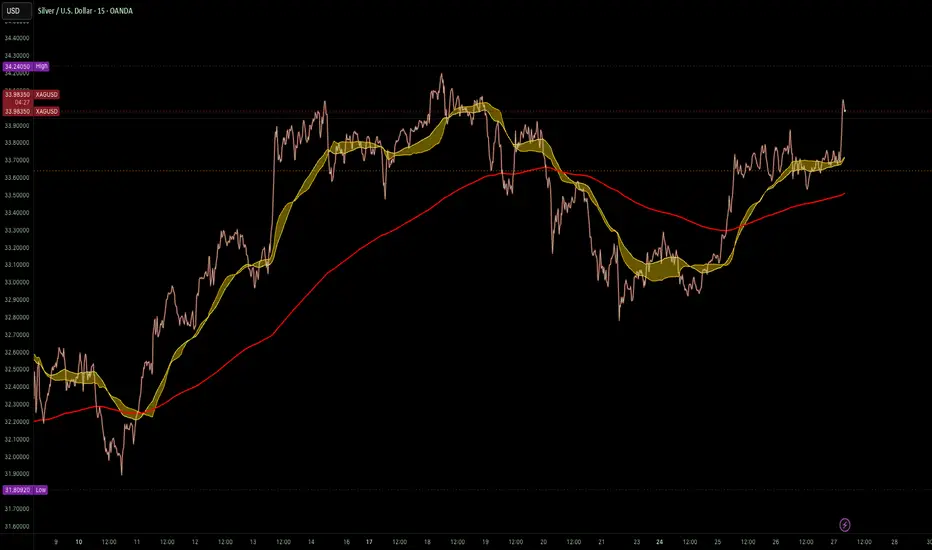
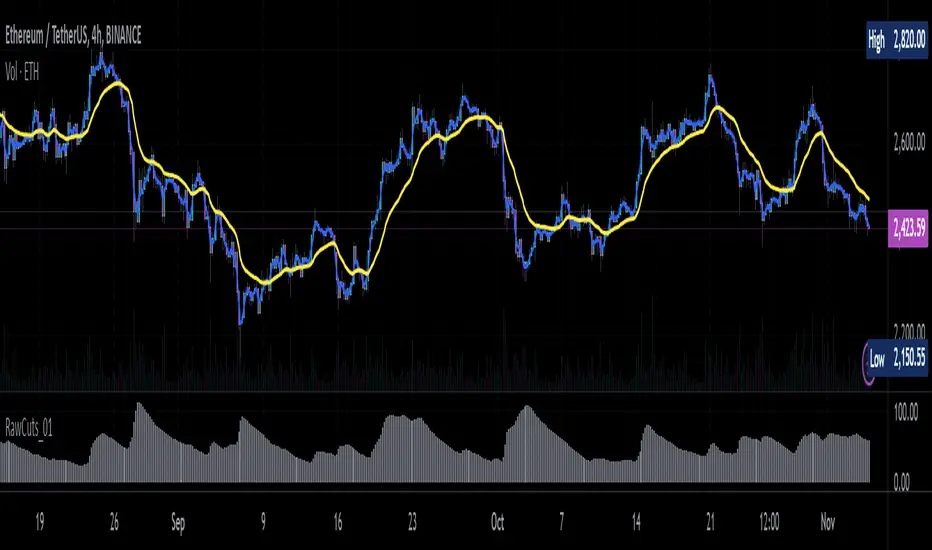
When you add the script to your charts, you'll immediately see a thin orange line across your time series, smoothing out price fluctuations.
There are only two parameters to set
smoothing factor between 0.0000 = no smoothing and 0.9999 = strong smoothing
input source : open, high, low, close hl2, etc.
Chart output
In the example chart above, you can see that the orange line follows the highs and lows better than the blue line , which is a simple moving average (SMA).
Additionally, the orange line has a shorter lag, or reacts faster when the trend of the original price data suddenly changes. These characteristics are critical for buying and selling decisions: quickly reacting and tracking highs and lows while providing a smooth line that filters out distracting noise.
Wskaźnik Pine Script®