Divergence Macro Sentiment Indicator (DMSI)The Divergence Macro Sentiment Indicator (DMSI)
Think of DMSI as your daily “mood ring” for the markets. It boils down the tug-of-war between growth assets (S&P 500, copper, oil) and safe havens (gold, VIX) into one clear histogram—so you instantly know if the bulls have broad backing or are charging ahead with one foot tied behind.
🔍 What You’re Seeing
Green bars (above zero): Risk-on conviction.
Equities and commodities are rallying while gold and volatility retreat.
Red bars (below zero): Risk-off caution.
Gold or VIX are climbing even as stocks rise—or stocks aren’t fully joined by oil/copper.
Zero line: The line in the sand between “full-steam ahead” and “proceed with care.”
📈 How to Read It
Cross-Zero Signals
Bullish trigger: DMSI flips up through zero after a red stretch → fresh long entries.
Bearish trigger: DMSI tumbles below zero from green territory → tighten stops or go defensive.
Divergence Warnings
If SPX makes new highs but DMSI is rolling over (lower green bars or red), that’s your early red flag—rallies may fizzle.
Strength Confirmation
On pullbacks, only buy dips when DMSI ≥ 0. When DMSI is deeply positive, you can be more aggressive on position size or add leverage.
💡 Trade Guidance & Use Cases
Trend Filter: Only take your S&P or sector-ETF long setups when DMSI is non-negative—avoids hollow rallies.
Macro Pair Trades:
Deep red DMSI: go long gold or gold miners (GLD, GDX).
Strong green DMSI: lean into cyclicals, industrials, even energy names.
Risk Management:
Scale out as DMSI fades into negative territory mid-trade.
Scale in or add to winners when it stays bullish.
Swing Confirmation: Overlay on any oscillator or price-pattern system—accept signals only when the macro tide is flowing in your favour.
🚀 Why It Works
Markets don’t move in a vacuum. When stocks rally but the “real-economy” metals and volatility aren’t cooperating, something’s off under the hood. DMSI catches those cross-asset cracks before price alone can—and gives you an early warning system for smarter entries, tighter risk, and bigger gains when the macro trend really kicks in.
Wyszukaj w skryptach "Divergence"

Divergence Backtester - V2Further attempts to study divergence impact on price in shorter terms.
Previous study can be found here:
In this script, we are trying to gather the stats based on last two pivot state together. For example, Individual table of Pivot High Projection is as explained below:
But, by looking at the bigger picture, we can further estimate following things regarding the current unconfirmed pivot and the new pivot which is yet to be formed.

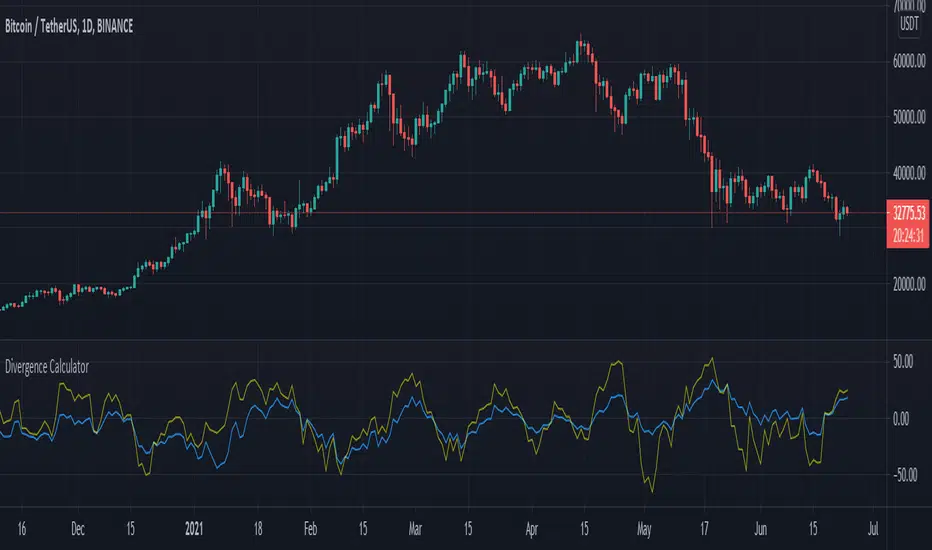
Divergence CalculatorThis is a brand new concept of indicator that calculates the divergence in the behavior of price and the RSI. The yellow line indicates the change over the RSI and the blue line is for the changes of closing price.
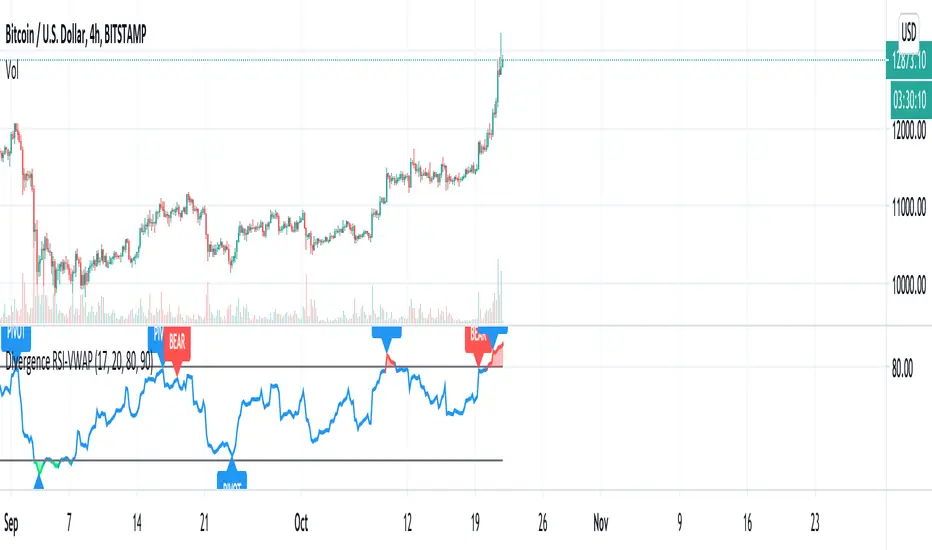
Divergence RSI-VWAPCombination of the script from XaviZ of RSI-VWAP and divergence detector from Libertus.
Divergence of Market Breadth & Price deduction indicatorHow it begin?
Traders and investors use market breadth in order to assess the index’s overall health. Market breadth can be a reliable, if not an accurate, indicator of an upcoming price rise in the index. Similarly, it can also provide early warning signs for a future price decline.
What is it?
market breadth in this case refer to percentage of stocks above 20 Simple Moving Average,which could be used as a barometer for the market.
How it works?
This paticular indicator compare the divergence of Nasdaq 100 and Russell 2000 percentage of stocks above 20 Simple Moving Average.
This indicator also include a deduction price method ,which is inspired from LEI & LoneCapital


Price/OBV divergenceShows agreement or disagreement between the direction of the the price and the on-balance volume. When they disagree, the price is supposed to follow the OBV (or so they say.)

High & Low Oscillator 13x8 CrossOscillator for various uses, divergence versus price action and "0" crossing of trend/move change among others. Use with caution

LX Rsi Divergence BarsThis script colours the bars when they are below or boyond a specified RSI threshold

Turbo Oscillator [RunRox]Introducing Turbo Oscillator by RunRox, our new indicator that combines a multitude of useful and unique features, which we will detail in this post.
List of Advanced Technologies:
Real-Time Divergences: Detects discrepancies between price movements and oscillator indicators to forecast potential price reversals.
Real-Time Hidden Divergences: We identify hidden divergences in real-time. These are not the standard type of divergences; they are opposite to regular divergences, providing unique insights into potential market movements.
Overbought and Oversold Zones: Identifies areas where the market is potentially overextended, suggesting possible entry and exit points.
Signal Line: Indicates the market direction, helping traders to quickly understand current trends.
Money Flow Histogram: Shows the flow of money into and out of the market, providing insights into buying and selling pressure.
Predicted Reversal Zones: Pinpoints areas where the market might experience reversals, aiding in strategic planning and risk management. These zones also serve as potential areas for taking profits, enhancing their utility for exit strategy planning.
Customizable Alerts: You can flexibly set up alerts for any events detected by our indicator, ensuring you stay informed about critical market movements.
To begin with, I would like to describe the difference between classic divergences and hidden divergences.
As you can see, these are opposite situations. Our oscillator identifies both types of divergences and displays them in real-time.
Divergences can serve as points where the price might reverse in the opposite direction, making both classic and hidden divergences powerful tools for spotting reversal points. I'll show a few examples of how divergences are used in our oscillator.
Classic Divergences - which we identify in real-time. As you can see, the price often reacts strongly to the formation of these divergences, frequently changing its direction.
Hidden Divergences - we also observe frequent movement in the opposite direction on the chart. The advantage of our indicator is that we show divergences in real-time without delays, allowing you to react immediately to trend changes.
Overbought and Oversold Zones - These zones allow you to see trend changes when the price is clearly overbought or oversold. When the color changes from a contrasting shade to a neutral one, you can observe the trend shift. The lines work by combining the positivity/negativity of the histogram, the positivity/negativity of the signal line, and the direction of the signal line (red/green). This sophisticated interaction provides precise insights into market conditions, making it an invaluable tool for traders.
Signal Line - This provides insights into trend changes and price reversals. The points on the line better indicate the beginning of a trend shift. These points can vary in size, offering a clearer understanding of the strength of the emerging trend. This feature works in combination with RSI, Stochastic, and MFI. RSI and MFI are top-tier indicators, while Stochastic adds responsiveness and sensitivity to trend changes, ensuring you capture every market movement accurately and promptly.
Money Flow Histogram - As shown in the example, our histogram displays the divergence between money flow and the actual price. You can see that while the price is rising, the money flow is decreasing, indicating insufficient demand for the asset and an imminent trend change. This feature uses MFI with an extended period, providing a more comprehensive and accurate analysis of market conditions. The extended period enhances the reliability of the Money Flow Index, making it an essential tool for identifying subtle shifts in market dynamics.
Predicted Reversal Zones - We automatically identify potential price reversal zones and display them above our overbought and oversold zones. In cases of strong overbought or oversold conditions, we detect potential price pullbacks and mark the beginning of a trend change. This helps you better identify trend shifts. We recommend considering these zones as potential take profit points for your trades.
Customizable Alerts - Our flexible alert system allows you to receive notifications only for the events you are interested in. These can include:
1. Classic Divergences
2. Hidden Divergences
3. Overbought or Oversold conditions on the status line
4. Strong Overbought or Oversold conditions on the status line
5. Signals from the signal line
6. Reversal zones in any direction
Our oscillator is a unique indicator that provides a comprehensive understanding of price movements. It can be used as a standalone tool for analyzing price action.
Here are a few examples of using our Oscillator in practice:
In the example above, you can see three conditions that have formed for a potential trade:
1. Clear overbought condition with a formed reversal point.
2. Decreasing Money Flow Index diverging from the rising price.
3. Formed classic divergence.
The entry point could be the formed divergence, while the exit point could be the overbought condition at the bottom of the oscillator along with the reversal points.
Here's another example of using hidden divergence, where you can see three conditions for a potential trade:
1. Overbought zone
2. Formed hidden divergence
3. Start of bearish movement indicated by the signal line
You can enter the trade either when the hidden divergence forms or wait for confirmation of the trend change by the signal line and enter the trade when the corresponding signal forms on the signal line. The exit point could be the opposite reversal point or the formation of a new hidden divergence.
We have demonstrated a few examples of how you can use our indicator, but we are confident that you will find many more applications in your own strategies.
Oscillator offers a variety of customizable parameters to tailor the indicator to your trading preferences. Here’s what our settings include:
Signal Line
Turn On/Off: Enable or disable the signal line.
Length: Set the length period for the signal line calculation.
Smooth: Adjust the smoothing level of the signal line for more accurate display.
Histogram
Turn On/Off: Enable or disable the histogram.
Length: Set the length period for the histogram calculation.
Smooth: Adjust the smoothing level of the histogram.
Other
Show Divergence Line: Display divergence lines on the chart.
Show Hidden Divergence: Display hidden divergences.
Show Status Line: Show the status line indicating overbought or oversold conditions.
Show TP Signal: Display signals for take profit.
Show Reversal Points: Display potential trend reversal points.
Delete Broken Divergence Lines: Remove broken divergence lines from the chart.
Alerts Customization
Signal Line Bull/Bear: Set alerts for bullish or bearish signals from the signal line.
TP Bull/Bear: Set alerts for take profit signals.
Status Bull/Bear: Set alerts for bullish or bearish status conditions.
Status Bull+/Bear+: Set enhanced alerts for stronger bullish or bearish status conditions.
Divergence Bull/Bear: Set alerts for bullish or bearish divergences.
Hidden Divergence Bull/Bear: Set alerts for hidden bullish or bearish divergences.
With these comprehensive settings, you can fine-tune the Oscillator to perfectly fit your trading strategy and preferences.
Our indicator utilizes technologies such as RSI, Stochastic, and Money Flow Index, with numerous enhancements from our team. It includes exclusive features such as real-time detection of hidden and classic divergences, identification of reversal points using our unique methodology, and much more.
Disclaimer:
While we consider our Turbo Oscillator to be an excellent tool, it is important to understand that past performance is not indicative of future results. We recommend approaching market analysis comprehensively, using a combination of tools and techniques to make well-informed trading decisions. Always consider the full range of market data and risks when using any trading indicator.

Overheat Oscillator with DivergenceIndicator Description
The Overheat Oscillator with Divergence is an advanced technical indicator designed for the TradingView platform, assisting traders in identifying potential market reversal points by analyzing price momentum and volume, as well as detecting divergences. The indicator combines trend strength assessment with signal smoothing to provide clear indications of market overheat or oversold conditions. An optional divergence detection feature allows for the identification of discrepancies between price movement and the oscillator's value, which may signal upcoming trend changes.
The indicator is displayed in a separate panel below the price chart and offers visual cues through a color gradient, horizontal reference lines, and a dynamic market sentiment table. Users can customize numerous parameters, such as calculation periods, sentiment thresholds, line colors, and visualization styles, making the indicator a versatile tool for various trading strategies.
How the Indicator Works
The indicator is based on the following key components:
Oscillator Calculations
The indicator analyzes price candles, assigning a score based on their nature. A bullish candle (when the closing price is higher than the opening price) receives a score of +1.0, while a bearish candle (when the closing price is lower than the opening price) receives a score of -1.0. This scoring reflects the strength of price movement over a given period.
The score is modified by a volume multiplier (default: 2.0) if the candle's volume exceeds the volume's simple moving average (SMA, default: calculated over 20 candles). This ensures that candles with higher volume have a greater impact on the oscillator's value, better capturing significant market movements driven by increased trading activity. For example, a bullish candle with high volume may receive a score of +2.0 instead of +1.0, amplifying the bullish signal.
The scores are summed over a specified number of candles (default: 20), normalized to a 0–100 range, and then smoothed using a simple moving average (SMA, default: 5 periods) to reduce noise and improve signal clarity.
Color Gradient
The oscillator's values are visualized using a color gradient that changes based on the oscillator's level:
Green: Market cooldown (values below the Gradient Min threshold).
Yellow: Neutral sentiment (values between Gradient Min and Gradient Yellow).
Orange: Elevated activity (values between Gradient Yellow and Gradient Orange).
Red: Market overheat (values above Gradient Orange).
The color gradient is applied as the background in the oscillator panel, facilitating quick assessment of market sentiment.
Reference Levels
The indicator displays customizable horizontal lines for key thresholds (e.g., Overheat Threshold, Oversold Threshold, Gradient Min, Yellow, Orange, Max). These lines are visible only at the height of the last few oscillator candles, preventing chart clutter and helping users focus on current values.
Users can also define three custom horizontal lines with selectable styles (solid, dotted, dashed) and colors. These lines serve as auxiliary tools, e.g., for marking personal support/resistance levels, but do not affect the oscillator's signals or background colors.
Market Sentiment
The indicator displays sentiment labels in a table located in the top-right corner of the panel, dynamically updating based on the oscillator's value:
Cooled: Values below Gradient Yellow (default: 35).
Neutral: Values between Gradient Yellow and Gradient Orange (default: 60).
Excited: Values between Gradient Orange and Overheat Threshold (default: 70).
Overheated: Values above Overheat Threshold (default: 70).
The Overheat Threshold and Oversold Threshold are critical for displaying the "Overheated" and "Cooled" labels in the sentiment table, enabling users to quickly identify extreme market conditions. The labels update when key thresholds are crossed, and their colors match the oscillator's gradient.
Divergence Detection
The indicator offers optional detection of regular bullish and bearish divergences:
Bullish Divergence: Occurs when the price forms a lower low, but the oscillator forms a higher low, suggesting a weakening downtrend.
Bearish Divergence: Occurs when the price forms a higher high, but the oscillator forms a lower high, suggesting a weakening uptrend.
Divergences are marked on the chart with labels ("Bull" for bullish, "Bear" for bearish) and lines indicating pivot points. They are calculated with a delay equal to the Lookback Right setting (default: 5 candles), meaning signals appear after pivot confirmation in the specified lookback period. The indicator also generates alerts for users when a divergence is detected.
Indicator Settings
Main Settings (SETTINGS)
Period Length: Specifies the number of candles used for oscillator calculations (default: 20).
Volume SMA Period: The period for the volume's simple moving average (default: 20).
Volume Multiplier: Multiplier applied to candle scores when volume exceeds the average (default: 2.0).
SMA Length: The period for smoothing the oscillator with a simple moving average (default: 5).
Thresholds (THRESHOLDS)
Overheat Threshold: Level indicating market overheat (default: 70). This value determines when the sentiment table displays the "Overheated" label, signaling a potential peak in an uptrend.
Oversold Threshold: Level indicating market cooldown (default: 30). This value determines when the sentiment table displays the "Cooled" label, signaling a potential bottom in a downtrend.
Gradient Min (Green): Lower threshold for the green gradient (default: 20).
Gradient Yellow Threshold: Threshold for the yellow gradient (default: 35).
Gradient Orange Threshold: Threshold for the orange gradient (default: 60).
Gradient Max (Red): Upper threshold for the red gradient (default: 70).
Visualization (VISUALIZATION)
Signal Line Color: Color of the oscillator line (default: dark red, RGB(5, 0, 0)).
Show Reference Lines: Enables/disables the display of threshold lines (default: enabled).
Divergence Settings (DIVERGENCE SETTINGS)
Calculate Divergence: Enables/disables divergence detection (default: disabled).
Lookback Right: Number of candles back for pivot analysis (default: 5).
Lookback Left: Number of candles to the left for pivot analysis (default: 5).
Line Style (STYLE)
Custom Line 1, 2, 3 Value: Levels for custom horizontal lines (default: 70, 50, 30).
Custom Line 1, 2, 3 Color: Colors for custom lines (default: black, RGB(0, 0, 0)).
Custom Line 1, 2, 3 Style: Line styles (solid, dotted, dashed; default: dashed, dotted, dashed).
How to Use the Indicator
Adding to the Chart
Add the indicator to your TradingView chart by searching for "Overheat Oscillator with Divergence."
Configure the settings according to your trading strategy.
Signal Interpretation
Overheated: Values above the Overheat Threshold (default: 70) in the sentiment table may indicate a potential uptrend peak.
Cooled: Values below the Oversold Threshold (default: 30) in the sentiment table may suggest a potential downtrend bottom.
Divergences:
Bullish: Look for "Bull" labels on the chart, indicating potential upward reversals (calculated with a Lookback Right delay).
Bearish: Look for "Bear" labels, indicating potential downward reversals (calculated with a Lookback Right delay).
Customization
Experiment with settings such as period length, volume multiplier, or gradient thresholds to tailor the indicator to your trading style (e.g., scalping, medium-term trading).
Usage Examples
Scalping: Set a shorter period (e.g., Period Length = 10, SMA Length = 3) and monitor rapid sentiment changes and divergences on lower timeframes (e.g., 5-minute charts).
Medium-Term Trading: Use default settings or increase Period Length (e.g., 30) and SMA Length (e.g., 7) for more stable signals on hourly or daily charts.
Reversal Detection: Enable divergence detection and observe "Bull" or "Bear" labels in conjunction with overheat/cooled levels in the sentiment table.
Notes
The indicator performs best when used in conjunction with other technical analysis tools, such as support/resistance lines, moving averages, or Fibonacci levels.
Divergences may serve as early signals but do not always guarantee immediate trend reversals—confirmation with other indicators is recommended.
Test different settings on historical data to find the optimal configuration for your chosen market and timeframe.

RSI Divergence ProjectionRSI Divergence Projection
Go beyond traditional, lagging indicators with this advanced RSI Divergence tool. It not only identifies four types of confirmed RSI divergence but also introduces a unique, forward-looking engine. This engine spots potential divergences as they form on the current candle and then projects the exact price threshold required to validate them.
Our core innovation is the Divergence Projection Line, a clean, clutter-free visualization that extends this calculated price target into the future, providing a clear and actionable level for your trading decisions.
The Core Logic: Understanding RSI Divergence
For those new to the concept, RSI Divergence is a powerful tool used to spot potential market reversals or continuations. It occurs when the price of an asset is moving in the opposite direction of the Relative Strength Index (RSI). This indicator automatically detects and plots four key types:
Regular Bullish Divergence: Price prints a lower low, but the RSI prints a higher low. This often signals that bearish momentum is fading and a potential reversal to the upside is near.
Hidden Bullish Divergence: Price prints a higher low, but the RSI prints a lower low. This is often seen in an uptrend and can signal a continuation of the bullish move.
Regular Bearish Divergence: Price prints a higher high, but the RSI prints a lower high. This suggests that bullish momentum is weakening and a potential reversal to the downside is coming.
Hidden Bearish Divergence: Price prints a lower high, but the RSI prints a higher high. This is often seen in a downtrend and can signal a continuation of the bearish move.
Confirmed divergences are plotted with solid-colored lines on the price chart and marked with a "B" (Bearish/Bullish) or "HB" (Hidden Bearish/Hidden Bullish) label.
The Core Innovation: The Divergence Projection
This is where the indicator truly shines and sets itself apart. Instead of waiting for a pivot point to be confirmed, our engine analyzes the current, unclosed candle.
Potential Divergence Detection: When the indicator notices that the current price and RSI are setting up for a potential divergence against the last confirmed pivot, it will draw a dashed line on the chart. This gives you a critical head-start before the signal is confirmed.
The Projection Line (Our Innovation): This is the game-changer. Rather than cluttering your chart with messy labels, the indicator calculates the exact closing price the next candle needs to achieve to make the current RSI level equal to the RSI of the last pivot.
It then projects a clean, horizontal dashed line at this price level into the future.
Attached to the end of this line is a single, consolidated label that tells you the type of potential divergence and the exact threshold price.
This unique visualization transforms a vague concept into a precise, actionable price target, completely free of chart clutter.
How to Use This Indicator
1. Trading Confirmed Divergences:
Look for the solid lines and the "B" or "HB" labels that appear after a candle has closed and a pivot is confirmed.
A Regular Bullish divergence can be an entry signal for a long position, often placed after the confirmation candle closes.
A Regular Bearish divergence can be an entry signal for a short position.
Hidden Divergences can be used as confirmation to stay in a trade or to enter a trade in the direction of the prevailing trend.
2. Using the Divergence Projection for a Tactical Advantage:
When a dashed line appears on the current price action, you are seeing a potential divergence in real-time.
Look to the right of the current candle for the Projection Line. The price level of this line is your key level to watch.
Example (Potential Bullish Divergence): You see a dashed green line forming from a previous low to the current lower low. To the right, you see a horizontal line projected with a label: "Potential Bull Div | Thresh: 10,750.50".
Interpretation: This means that if the next candle closes below 10,750.50, the RSI will not be high enough to form a divergence. However, if the price pushes up and the next candle closes above 10,750.50, the bullish divergence remains intact and is more likely to be confirmed. This gives you a concrete price level to monitor for entry or exit decisions.
How the Projection Engine Works: A Deeper Dive
To fully trust this tool, it's helpful to understand the logic behind it. The projection engine is not based on guesswork or repainting; it's based on a precise mathematical reverse-engineering of the RSI formula.
The Concept: The engine calculates the "tipping point." The Threshold Price is the exact closing price at which the new RSI value would be identical to the RSI value of the previous pivot point. It answers the question: "For this potential divergence to remain valid, where does the next candle need to close?"
The Technicals: The script takes the target RSI from the last pivot, reverse-engineers the formula to find the required average gain/loss ratio, and then solves for the one unknown variable: the gain or loss needed on the next candle. This required price change is then added to or subtracted from the previous close to determine the exact threshold price.
This calculation provides the precise closing price needed to hit our target, which is then plotted as the clean and simple Projection Line on your chart.
Features and Customization
- RSI Settings: Adjust the RSI period and source.
- Divergence Detection: Fine-tune the pivot lookback periods and the min/max range for detecting divergences.
- Price Source: Choose whether to detect divergences using candle Wicks or Bodies.
- Display Toggles: Enable or disable any of the four divergence types, as well as the entire projection engine, to keep your chart as clean as you need it.
Summary of Advantages
- Proactive Signals: Get ahead of the market by seeing potential divergences before they are confirmed.
- Unprecedented Clarity: Our unique Projection Line eliminates chart clutter from overlapping labels.
- Actionable Data: The threshold price provides a specific, objective level to watch, removing guesswork.
- Fully Customizable: Tailor the indicator's settings to match any timeframe or trading strategy.
- All-in-One Tool: No need for a separate RSI indicator; everything you need is displayed directly and cleanly on the price action.
We hope this tool empowers you to make more informed and timely trading decisions. Happy trading

Dual Volume Divergence LineDual Volume Divergence Line (DVD/Line)
🔹 Overview
The Dual Volume Divergence Line (DVD/Line) is a custom Pine Script™ indicator designed to identify potential trend reversals and continuations by analyzing volume and price divergences. This script is inspired by the original concept of the Dual Volume Divergence Index (DVDI) by DonovanWall and has been modified and enhanced by keremertem. Special thanks to DonovanWall for the original concept. The indicator combines volume-based calculations with price action to generate signals for bullish and bearish divergences, both normal and hidden. Below is a detailed breakdown of its components and functionality.
🔹 Key Features of the DVD/Line Indicator
1. Dual Volume Divergence Calculation:
- The indicator calculates two primary volume-based indices: the Positive Volume Index (PVI) and the Negative Volume Index (NVI).
- PVI measures the impact of volume on price when the price increases, while NVI measures the impact when the price decreases.
- These indices are used to detect divergences between volume and price, which can signal potential reversals or continuations.
2. Customizable Inputs:
- DVD Sampling Period: Adjusts the sensitivity of the indicator by controlling the lookback period for calculating the volume-weighted moving averages (VWMA) of PVI and NVI.
- Band Width: Defines the range for calculating the upper and lower bands, which act as dynamic support and resistance levels.
- Source: Allows users to select the price source (e.g., `hlc3`, `close`, etc.) for calculations.
3. Volume-Weighted Moving Averages (VWMA):
- Instead of using traditional moving averages, the script employs VWMA to smooth the PVI and NVI signals. This ensures that the indicator is more responsive to changes in volume.
4. Upper and Lower Bands:
- The upper and lower bands are calculated using the Root Mean Square (RMS) of the highest and lowest values of the DVD line over a user-defined period. These bands help identify overbought and oversold conditions.
5. Divergence Detection:
- The script identifies four types of divergences:
- Normal Bullish Divergence: Occurs when price makes a lower low, but the DVD line makes a higher low.
- Hidden Bullish Divergence: Occurs when price makes a higher low, but the DVD line makes a lower low.
- Normal Bearish Divergence: Occurs when price makes a higher high, but the DVD line makes a lower high.
- Hidden Bearish Divergence: Occurs when price makes a lower high, but the DVD line makes a higher high.
- These divergences are visually highlighted on the chart using labels.
6. Customizable Divergence Selection:
- Users can choose between two types of divergence calculations:
- DVDI: Based on the raw divergence values.
- DVD Line: Based on the smoothed DVD line.
7. Visual Enhancements:
- The DVD line is plotted with a color-coded scheme: blue when the DVD line is above its signal line (bullish) and pink when it is below (bearish).
- The upper and lower bands are displayed as step lines, making it easier to identify key levels.
🔹 How the Indicator Works
1. Volume-Based Calculations:
- The script starts by calculating the PVI and NVI based on the selected price source and volume data.
- PVI increases when the price rises, while NVI decreases when the price falls. These indices are then smoothed using VWMA to generate signals.
2. DVD Line Calculation:
- The DVD line is derived by combining the divergences of PVI and NVI. It is further smoothed using a Weighted Moving Average (WMA) and a linear regression line for trend analysis.
3. Divergence Detection:
- The script identifies pivot points in the DVD line and compares them with price action to detect divergences.
- Normal divergences indicate potential reversals, while hidden divergences suggest trend continuations.
4. Dynamic Bands:
- The upper and lower bands are calculated using RMS, which provides a more accurate representation of volatility compared to standard deviation or fixed-width bands.
5. Labeling:
- Divergences are labeled directly on the chart with clear text and color coding:
🟢 Bullish Divergence: Green label with "Bull".
🟩 Bearish Divergence: Red label with "Bear".
🔴 Hidden Bullish Divergence: Lime label with "hid.".
🟧 Hidden Bearish Divergence: Orange label with "hid.".
🔹 Unique Aspects of This Script
1. Volume-Weighted Smoothing:
- Unlike traditional divergence indicators that rely on simple moving averages, this script uses VWMA and WMA to ensure that volume plays a significant role in signal generation.
2. Dynamic Bands with RMS:
- The use of RMS for calculating bands provides a more adaptive and accurate representation of market conditions, especially in volatile markets.
3. Flexible Divergence Selection:
- Users can choose between raw divergence values (DVDI) or smoothed values (DVD Line), allowing for greater customization based on trading style.
4. Comprehensive Divergence Detection:
- The script detects both normal and hidden divergences, providing a complete picture of potential trend reversals and continuations.
5. User-Friendly Visuals:
- The color-coded DVD line and cross-style bands make it easy to interpret the indicator at a glance.
🔹 How to Use the Indicator
1. Trend Identification:
- Use the Middle Band and its color to identify the current trend. A green line suggests bullish momentum, while a red line indicates bearish momentum. Additionally, a bullish momentum may be indicated when the DVD line crosses up, and a bearish momentum may be indicated when it crosses down the Middle Band.
2. Divergence Trading:
- Look for divergences between the DVD line and price action. Normal divergences can be used for counter-trend trades, while hidden divergences can confirm trend continuations.
3. Band Breakouts:
- Monitor the upper and lower bands for potential breakout or reversal signals. A break above the upper band may indicate overbought conditions, while a break below the lower band may suggest oversold conditions.
4. Customization:
- Adjust the sampling period and band width to suit different timeframes and trading strategies. Shorter periods are more sensitive, while longer periods provide smoother signals.
🔹 Conclusion
The Dual Volume Divergence Line (DVD/Line) is a powerful and versatile indicator that combines volume analysis with price action to generate actionable trading signals. Its unique use of volume-weighted smoothing, dynamic bands, and comprehensive divergence detection sets it apart from traditional divergence indicators. Whether you're a day trader or a long-term investor, this tool can help you identify high-probability trading opportunities with greater accuracy and confidence.
📌 Disclaimer: This script is for educational purposes only and does not constitute financial advice. Always conduct your own analysis before making trading decisions.

RSI Trendlines and Divergences█OVERVIEW
The "RSI Trendlines and Divergences" indicator is an advanced technical analysis tool that leverages the Relative Strength Index (RSI) to draw trendlines and detect divergences. Designed for traders seeking precise market signals, the indicator identifies key pivot points on the RSI chart, draws trendlines between pivots, and detects bullish and bearish divergences. It offers flexible settings, background coloring for breakout signals, and divergence labels, supported by alerts for key events. The indicator is universal and works across all markets (stocks, forex, cryptocurrencies) and timeframes.
█CONCEPTS
The indicator was developed to provide an alternative signal source for the RSI oscillator. Trendline breakouts and bounces off trendlines offer a broader perspective on potential price behavior. Combining these with traditional RSI signal interpretation can serve as a foundation for creating various trading strategies.
█FEATURES
- RSI and Pivot Calculation: Calculates RSI based on the selected source price (default: close) with a customizable period (default: 14). Identifies pivot points on RSI and price for trendlines and divergences.
- RSI Trendlines: Draws trendlines connecting RSI pivots (upper for downtrends, lower for uptrends) with optional extension (default: 30 bars). The trendline appears and generates a signal only after the first RSI crossover. Lines are colored (red for upper, green for lower).
- Trendline Fill: Widens the trendline with a tolerance margin expressed in RSI points, reducing signal noise and visually highlighting trend zones. Breaking this zone is a condition for generating signals, minimizing false signals. The tolerance margin can be increased or decreased.
- Divergence Detection: Identifies bullish and bearish divergences based on RSI and price pivots, displaying labels (“Bull” for bullish, “Bear” for bearish) with adjustable transparency. Divergence labels appear with a delay equal to the specified pivot length (default: 5). Higher values yield stronger signals but with greater delay.
- Breakout Signals: Generates signals when RSI crosses the trendline (bullish for upper lines, bearish for lower lines), with background coloring for signal confirmation.
- Alerts: Built-in alerts for:
Detection of bullish and bearish divergences.
Upper trendline crossover (bullish signal).
Lower trendline crossover (bearish signal).
- Customization: Allows adjustment of RSI length, pivot settings, line colors, fills, labels, and transparency of signals and background.
█HOW TO USE
Add the indicator to your TradingView chart via the Pine Editor or Indicators menu.
Configuring Settings.
RSI Settings
- RSI Length: Period for RSI calculation (default: 14).
- SMA Length: Period for RSI moving average (default: 9).
- Source: Source price for RSI (default: close).
Pivot Settings for Trend
- Left Bars for Pivot: Number of bars back for detecting pivots (default: 10).
- Right Bars for Pivot: Number of bars forward for confirming pivots (default: 10).
- Extension after Second Pivot: Number of bars to extend the trendline (default: 30, 0 = none). Extension increases the number of signals, while shortening reduces them.
- Tolerance: Deviation in RSI points to widen the breakout margin, reducing signal noise (default: 3.0).
Divergence Settings
- Enable Divergence Detection: Enables/disables divergence detection (default: enabled).
- Pivot Length for Divergence: Pivot period for divergences (default: 5).
Style Settings
- Upper Trendline Color: Color for downtrend lines (default: red).
- Upper Fill Color: Fill color for upper lines (default: red, transparency 70).
- Lower Trendline Color: Color for uptrend lines (default: green).
- Lower Fill Color: Fill color for lower lines (default: green, transparency 70).
- SMA Color: Color for RSI moving average (default: yellow).
- Bullish Divergence Color: Color for bullish labels (default: green).
- Bearish Divergence Color: Color for bearish labels (default: red).
- Text Color: Color for label text (default: white).
- Divergence Label Transparency: Transparency of labels (0-100, default: 40).
- Signal Background Transparency: Transparency of breakout signal background (0-100, default: 80).
Interpreting Signals
- Trendlines: Upper lines (red) indicate RSI downtrends, lower lines (green) indicate uptrends. The trendline appears and generates a signal only after the first RSI crossover. Trendline breakouts suggest potential trend reversals.
- Divergences: “Bull” labels indicate bullish divergence (potential rise), “Bear” labels indicate bearish divergence (potential decline), with a delay based on pivot length (default: 5). Divergences serve as confirmation or warning of trend reversal, not as standalone signals.
- Signal Background: Green background signals bullish breakouts, red background signals bearish breakouts.
- RSI Levels: Horizontal lines at 70 (overbought), 50 (midline), and 30 (oversold) help assess market zones.
- Alerts: Set up alerts in TradingView for divergences or trendline breakouts.
Combining with Other Tools: Use with support/resistance levels, Fibonacci levels, or other indicators for signal confirmation.
█APPLICATIONS
The "RSI Trendlines and Divergence" indicator is designed to identify trends and potential reversal points, supporting both trend-following and reversal strategies:
- Trend Confirmation: Trendlines indicate the RSI trend direction, with breakouts signaling potential reversals. The indicator is functional in traditional RSI usage, allowing classic RSI interpretation (e.g., returning from overbought/oversold zones). Combining trendline breakouts with RSI signal levels, such as a return from overbought or oversold zones paired with a trendline breakout, strengthens the signal.
- Divergence Detection: Divergences serve as confirmation or warning of trend reversal, not as standalone signals.
█NOTES
- Adjust settings (e.g., RSI length, pivots, tolerance) to suit your trading style and timeframe.
- Combine with other technical analysis tools to enhance signal accuracy.

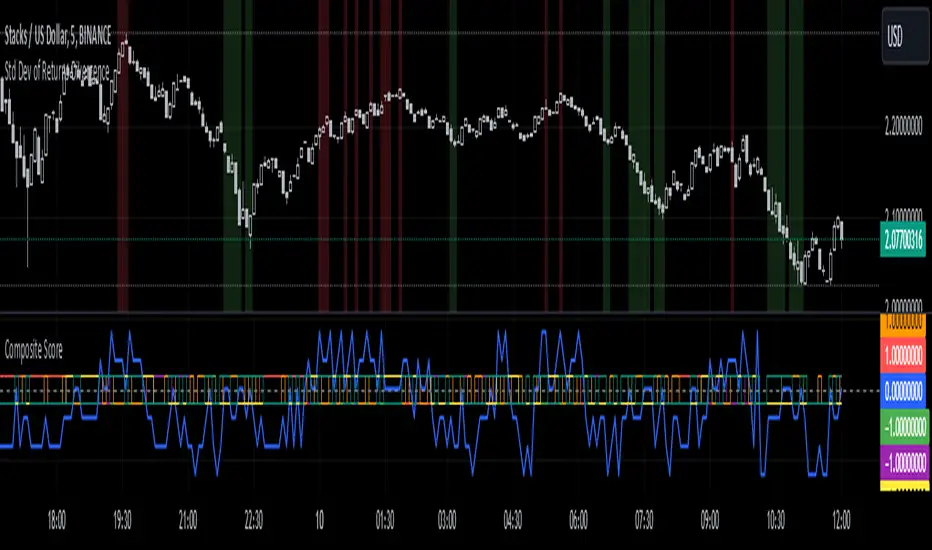
Standard Deviation of Returns: DivergencePurpose:
The "Standard Deviation of Returns: Divergence" indicator is designed to help traders identify potential trend reversals or continuation signals by analyzing divergences between price action and the statistical volatility of returns. Divergences can signal weakening momentum in the prevailing trend, offering insight into potential buying or selling opportunities.
Key Components
1. Returns Calculation:
* The indicator uses logarithmic returns (log(close / close )) to measure relative price changes in a normalized manner.
* Log returns are more effective than simple price differences when analyzing data across varying price levels, as they account for percentage-based changes.
2. Standard Deviation of Returns:
* The script computes the standard deviation of returns over a user-defined lookback period (ta.stdev(returns, lookback)).
* Standard deviation measures the dispersion of returns around their average, effectively quantifying market volatility.
* A higher standard deviation indicates increased volatility, while lower standard deviation reflects a calmer market.
3. Price Action:
* Detects higher highs (new peaks in price) and lower lows (new troughs in price) over the lookback period.
* Price trends are compared to the behavior of the standard deviation.
4. Divergence Detection:
A divergence occurs when price action (higher highs or lower lows) is not confirmed by a corresponding movement in standard deviation:
Bullish Divergence: Price makes a lower low, but the standard deviation does not, signaling potential upward momentum.
Bearish Divergence: Price makes a higher high, but the standard deviation does not, signaling potential downward momentum.
5. Visual Cues:
The script highlights divergence regions directly on the chart:
Green Background: Indicates a bullish divergence (potential buy signal).
Red Background: Indicates a bearish divergence (potential sell signal).
How It Works
Inputs:
* The user specifies the lookback period (lookback) for calculating the standard deviation and detecting divergences.
Calculation:
* Each bar’s returns are computed and used to calculate the standard deviation over the specified lookback period.
* The indicator evaluates price highs/lows and compares these with the highest and lowest values of the standard deviation within the same lookback period.
Highlight of Divergences:
When divergences are detected:
Bullish Divergence: The background of the chart is shaded green.
Bearish Divergence: The background of the chart is shaded red.
Trading Application
Bullish Divergence:
* Occurs when the market is oversold, or downward momentum is weakening.
* Suggests a potential reversal to an uptrend, signaling a buying opportunity.
Bearish Divergence:
* Occurs when the market is overbought, or upward momentum is weakening.
* Suggests a potential reversal to a downtrend, signaling a selling opportunity.
Contextual Use:
* Use this indicator in conjunction with other technical tools like RSI, MACD, or moving averages to confirm signals.
* Effective in volatile or ranging markets to help anticipate shifts in momentum.
Summary
The "Standard Deviation of Returns: Divergence" indicator is a robust tool for spotting divergences that can signal weakening market trends. It combines statistical volatility with price action analysis to highlight key areas of potential reversals. By integrating this tool into your trading strategy, you can gain additional confirmation for entries or exits while keeping a close watch on momentum shifts.
Disclaimer: This is not a financial advise; please consult your financial advisor for personalized advice.
Chaikin DivergenceOverview
The Chaikin Divergence is a powerful technical indicator designed to enhance the traditional Chaikin Oscillator by incorporating divergence detection between the oscillator and price action. This advanced tool not only plots the Chaikin Oscillator but also identifies and highlights bullish and bearish divergences, providing traders with valuable insights into potential trend reversals and momentum shifts.
Key Features
Chaikin Oscillator Plotting: Visual representation of the Chaikin Oscillator, aiding in the analysis of market momentum based on volume and price.
Divergence Detection:
Bullish Divergence: Indicates potential upward reversals when price forms lower lows while the oscillator forms higher lows.
Bearish Divergence: Signals possible downward reversals when price creates higher highs while the oscillator forms lower highs.
Customizable Settings:
Fast Length & Slow Length: Adjust the periods for the Exponential Moving Averages (EMA) used in the oscillator calculation.
Pivot Detection Parameters: Define the sensitivity of pivot high and pivot low detection with adjustable left and right bars.
Bars Lookback for Divergence: Set the number of bars to look back for identifying divergences.
Color Customization: Choose distinct colors for bullish and bearish divergence labels to match your trading preferences.
Visual Indicators:
Divergence Labels: Clear and distinct labels (arrows or dots) on the chart indicating the type and location of divergences.
Zero Line: A dashed zero line to reference the oscillator’s crossing points.
Chaikin Oscillator Calculation:
The indicator calculates the Chaikin Oscillator by subtracting the slow EMA of the Accumulation/Distribution Line (ta.accdist) from the fast EMA.
This oscillates around the zero line, indicating buying and selling pressure.
Pivot Detection:
Utilizes ta.pivothigh and ta.pivotlow functions to identify significant pivot points in price action. These pivot points serve as reference points for divergence analysis.
Divergence Identification:
Bullish Divergence: Detected when a recent pivot low in price is lower than the previous pivot low, while the corresponding oscillator value is higher than the previous oscillator pivot.
Bearish Divergence: Identified when a recent pivot high in price is higher than the previous pivot high, but the oscillator value is lower than the previous oscillator pivot.
Label Plotting:
When a divergence is detected, the indicator plots a label (arrow or dot) on the chart at the pivot point, signaling the type of divergence.
Adding the Indicator:
Open TradingView and navigate to the chart where you want to apply the indicator.
Open the Pine Editor, paste the Chaikin Oscillator with Divergences script, and add it to your chart.
Configuring Settings:
Fast Length & Slow Length: Adjust these to modify the sensitivity of the Chaikin Oscillator. Shorter periods make the oscillator more responsive to price changes.
Left Bars for Pivots & Right Bars for Pivots: Define how many bars to the left and right are considered when identifying pivot points. Increasing these values makes pivot detection less sensitive.
Bars Lookback for Divergence: Set how far back the indicator should search for previous pivot points when identifying divergences. A higher value allows detection over a longer timeframe.
Bullish/Bearish Divergence Colors: Choose colors that stand out against your chart background for easy identification of divergence signals.
Interpreting Signals:
Bullish Divergence Labels: Appear when there's a potential upward reversal, signaling a possible buying opportunity.
Bearish Divergence Labels: Show up when a downward reversal might be imminent, indicating a possible selling opportunity.
Oscillator Crosses Zero: Pay attention to when the oscillator crosses the zero line, as this can also signal changes in momentum.
Combining with Other Indicators:
For enhanced trading strategies, combine divergence signals with other technical indicators or chart patterns to confirm potential trade setups.

Ergodic Market Divergence (EMD)Ergodic Market Divergence (EMD)
Bridging Statistical Physics and Market Dynamics Through Ensemble Analysis
The Revolutionary Concept: When Physics Meets Trading
After months of research into ergodic theory—a fundamental principle in statistical mechanics—I've developed a trading system that identifies when markets transition between predictable and unpredictable states. This indicator doesn't just follow price; it analyzes whether current market behavior will persist or revert, giving traders a scientific edge in timing entries and exits.
The Core Innovation: Ergodic Theory Applied to Markets
What Makes Markets Ergodic or Non-Ergodic?
In statistical physics, ergodicity determines whether a system's future resembles its past. Applied to trading:
Ergodic Markets (Mean-Reverting)
- Time averages equal ensemble averages
- Historical patterns repeat reliably
- Price oscillates around equilibrium
- Traditional indicators work well
Non-Ergodic Markets (Trending)
- Path dependency dominates
- History doesn't predict future
- Price creates new equilibrium levels
- Momentum strategies excel
The Mathematical Framework
The Ergodic Score combines three critical divergences:
Ergodic Score = (Price Divergence × Market Stress + Return Divergence × 1000 + Volatility Divergence × 50) / 3
Where:
Price Divergence: How far current price deviates from market consensus
Return Divergence: Momentum differential between instrument and market
Volatility Divergence: Volatility regime misalignment
Market Stress: Adaptive multiplier based on current conditions
The Ensemble Analysis Revolution
Beyond Single-Instrument Analysis
Traditional indicators analyze one chart in isolation. EMD monitors multiple correlated markets simultaneously (SPY, QQQ, IWM, DIA) to detect systemic regime changes. This ensemble approach:
Reveals Hidden Divergences: Individual stocks may diverge from market consensus before major moves
Filters False Signals: Requires broader market confirmation
Identifies Regime Shifts: Detects when entire market structure changes
Provides Context: Shows if moves are isolated or systemic
Dynamic Threshold Adaptation
Unlike fixed-threshold systems, EMD's boundaries evolve with market conditions:
Base Threshold = SMA(Ergodic Score, Lookback × 3)
Adaptive Component = StDev(Ergodic Score, Lookback × 2) × Sensitivity
Final Threshold = Smoothed(Base + Adaptive)
This creates context-aware signals that remain effective across different market environments.
The Confidence Engine: Know Your Signal Quality
Multi-Factor Confidence Scoring
Every signal receives a confidence score based on:
Signal Clarity (0-35%): How decisively the ergodic threshold is crossed
Momentum Strength (0-25%): Rate of ergodic change
Volatility Alignment (0-20%): Whether volatility supports the signal
Market Quality (0-20%): Price convergence and path dependency factors
Real-Time Confidence Updates
The Live Confidence metric continuously updates, showing:
- Current opportunity quality
- Market state clarity
- Historical performance influence
- Signal recency boost
- Visual Intelligence System
Adaptive Ergodic Field Bands
Dynamic bands that expand and contract based on market state:
Primary Color: Ergodic state (mean-reverting)
Danger Color: Non-ergodic state (trending)
Band Width: Expected price movement range
Squeeze Indicators: Volatility compression warnings
Quantum Wave Ribbons
Triple EMA system (8, 21, 55) revealing market flow:
Compressed Ribbons: Consolidation imminent
Expanding Ribbons: Directional move developing
Color Coding: Matches current ergodic state
Phase Transition Signals
Clear entry/exit markers at regime changes:
Bull Signals: Ergodic restoration (mean reversion opportunity)
Bear Signals: Ergodic break (trend following opportunity)
Confidence Labels: Percentage showing signal quality
Visual Intensity: Stronger signals = deeper colors
Professional Dashboard Suite
Main Analytics Panel (Top Right)
Market State Monitor
- Current regime (Ergodic/Non-Ergodic)
- Ergodic score with threshold
- Path dependency strength
- Quantum coherence percentage
Divergence Metrics
- Price divergence with severity
- Volatility regime classification
- Strategy mode recommendation
- Signal strength indicator
Live Intelligence
- Real-time confidence score
- Color-coded risk levels
- Dynamic strategy suggestions
Performance Tracking (Left Panel)
Signal Analytics
- Total historical signals
- Win rate with W/L breakdown
- Current streak tracking
- Closed trade counter
Regime Analysis
- Current market behavior
- Bars since last signal
- Recommended actions
- Average confidence trends
Strategy Command Center (Bottom Right)
Adaptive Recommendations
- Active strategy mode
- Primary approach (mean reversion/momentum)
- Suggested indicators ("weapons")
- Entry/exit methodology
- Risk management guidance
- Comprehensive Input Guide
Core Algorithm Parameters
Analysis Period (10-100 bars)
Scalping (10-15): Ultra-responsive, more signals, higher noise
Day Trading (20-30): Balanced sensitivity and stability
Swing Trading (40-100): Smooth signals, major moves only Default: 20 - optimal for most timeframes
Divergence Threshold (0.5-5.0)
Hair Trigger (0.5-1.0): Catches every wiggle, many false signals
Balanced (1.5-2.5): Good signal-to-noise ratio
Conservative (3.0-5.0): Only extreme divergences Default: 1.5 - best risk/reward balance
Path Memory (20-200 bars)
Short Memory (20-50): Recent behavior focus, quick adaptation
Medium Memory (50-100): Balanced historical context
Long Memory (100-200): Emphasizes established patterns Default: 50 - captures sufficient history without lag
Signal Spacing (5-50 bars)
Aggressive (5-10): Allows rapid-fire signals
Normal (15-25): Prevents clustering, maintains flow
Conservative (30-50): Major setups only Default: 15 - optimal trade frequency
Ensemble Configuration
Select markets for consensus analysis:
SPY: Broad market sentiment
QQQ: Technology leadership
IWM: Small-cap risk appetite
DIA: Blue-chip stability
More instruments = stronger consensus but potentially diluted signals
Visual Customization
Color Themes (6 professional options):
Quantum: Cyan/Pink - Modern trading aesthetic
Matrix: Green/Red - Classic terminal look
Heat: Blue/Red - Temperature metaphor
Neon: Cyan/Magenta - High contrast
Ocean: Turquoise/Coral - Calming palette
Sunset: Red-orange/Teal - Warm gradients
Display Controls:
- Toggle each visual component
- Adjust transparency levels
- Scale dashboard text
- Show/hide confidence scores
- Trading Strategies by Market State
- Ergodic State Strategy (Primary Color Bands)
Market Characteristics
- Price oscillates predictably
- Support/resistance hold
- Volume patterns repeat
- Mean reversion dominates
Optimal Approach
Entry: Fade moves at band extremes
Target: Middle band (equilibrium)
Stop: Just beyond outer bands
Size: Full confidence-based position
Recommended Tools
- RSI for oversold/overbought
- Bollinger Bands for extremes
- Volume profile for levels
- Non-Ergodic State Strategy (Danger Color Bands)
Market Characteristics
- Price trends persistently
- Levels break decisively
- Volume confirms direction
- Momentum accelerates
Optimal Approach
Entry: Breakout from bands
Target: Trail with expanding bands
Stop: Inside opposite band
Size: Scale in with trend
Recommended Tools
- Moving average alignment
- ADX for trend strength
- MACD for momentum
- Advanced Features Explained
Quantum Coherence Metric
Measures phase alignment between individual and ensemble behavior:
80-100%: Perfect sync - strong mean reversion setup
50-80%: Moderate alignment - mixed signals
0-50%: Decoherence - trending behavior likely
Path Dependency Analysis
Quantifies how much history influences current price:
Low (<30%): Technical patterns reliable
Medium (30-50%): Mixed influences
High (>50%): Fundamental shift occurring
Volatility Regime Classification
Contextualizes current volatility:
Normal: Standard strategies apply
Elevated: Widen stops, reduce size
Extreme: Defensive mode required
Signal Strength Indicator
Real-time opportunity quality:
- Distance from threshold
- Momentum acceleration
- Cross-validation factors
Risk Management Framework
Position Sizing by Confidence
90%+ confidence = 100% position size
70-90% confidence = 75% position size
50-70% confidence = 50% position size
<50% confidence = 25% or skip
Dynamic Stop Placement
Ergodic State: ATR × 1.0 from entry
Non-Ergodic State: ATR × 2.0 from entry
Volatility Adjustment: Multiply by current regime
Multi-Timeframe Alignment
- Check higher timeframe regime
- Confirm ensemble consensus
- Verify volume participation
- Align with major levels
What Makes EMD Unique
Original Contributions
First Ergodic Theory Trading Application: Transforms abstract physics into practical signals
Ensemble Market Analysis: Revolutionary multi-market divergence system
Adaptive Confidence Engine: Institutional-grade signal quality metrics
Quantum Coherence: Novel market alignment measurement
Smart Signal Management: Prevents clustering while maintaining responsiveness
Technical Innovations
Dynamic Threshold Adaptation: Self-adjusting sensitivity
Path Memory Integration: Historical dependency weighting
Stress-Adjusted Scoring: Market condition normalization
Real-Time Performance Tracking: Built-in strategy analytics
Optimization Guidelines
By Timeframe
Scalping (1-5 min)
Period: 10-15
Threshold: 0.5-1.0
Memory: 20-30
Spacing: 5-10
Day Trading (5-60 min)
Period: 20-30
Threshold: 1.5-2.5
Memory: 40-60
Spacing: 15-20
Swing Trading (1H-1D)
Period: 40-60
Threshold: 2.0-3.0
Memory: 80-120
Spacing: 25-35
Position Trading (1D-1W)
Period: 60-100
Threshold: 3.0-5.0
Memory: 100-200
Spacing: 40-50
By Market Condition
Trending Markets
- Increase threshold
- Extend memory
- Focus on breaks
Ranging Markets
- Decrease threshold
- Shorten memory
- Focus on restores
Volatile Markets
- Increase spacing
- Raise confidence requirement
- Reduce position size
- Integration with Other Analysis
- Complementary Indicators
For Ergodic States
- RSI divergences
- Bollinger Band squeezes
- Volume profile nodes
- Support/resistance levels
For Non-Ergodic States
- Moving average ribbons
- Trend strength indicators
- Momentum oscillators
- Breakout patterns
- Fundamental Alignment
- Check economic calendar
- Monitor sector rotation
- Consider market themes
- Evaluate risk sentiment
Troubleshooting Guide
Too Many Signals:
- Increase threshold
- Extend signal spacing
- Raise confidence minimum
Missing Opportunities
- Decrease threshold
- Reduce signal spacing
- Check ensemble settings
Poor Win Rate
- Verify timeframe alignment
- Confirm volume participation
- Review risk management
Disclaimer
This indicator is for educational and informational purposes only. It does not constitute financial advice. Trading involves substantial risk of loss and is not suitable for all investors. Past performance does not guarantee future results.
The ergodic framework provides unique market insights but cannot predict future price movements with certainty. Always use proper risk management, conduct your own analysis, and never risk more than you can afford to lose.
This tool should complement, not replace, comprehensive trading strategies and sound judgment. Markets remain inherently unpredictable despite advanced analysis techniques.
Transform market chaos into trading clarity with Ergodic Market Divergence.
Created with passion for the TradingView community
Trade with insight. Trade with anticipation.
— Dskyz , for DAFE Trading Systems

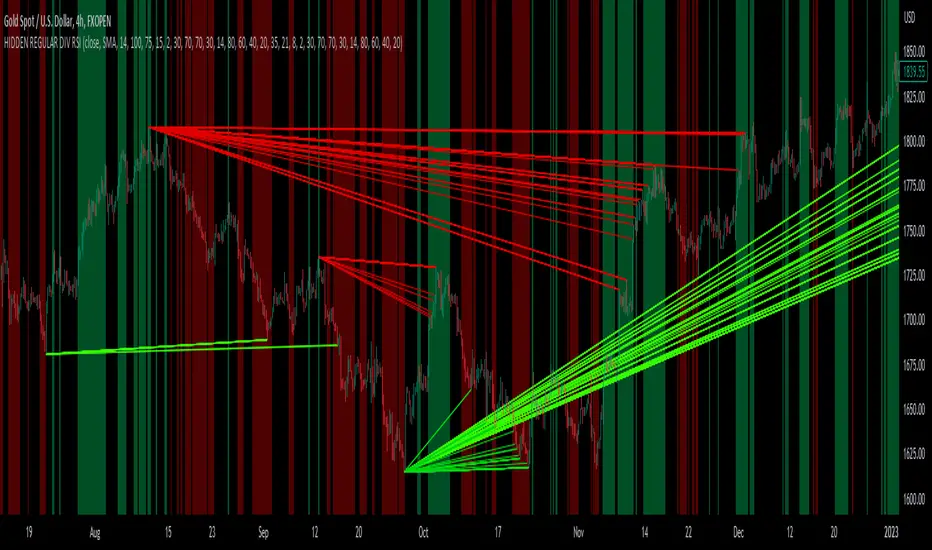
hidden & regular rsi divergenceThis is a divergence indicator that draws regular and hidden divergences based on the Zigzag indicator and RSI indicator. There are two degrees of Zigzag. So, in each Zigzag degree, there are two types of regular divergences and one type of hidden divergence.
👉(The logic is written in case of a bearish regular divergence. The opposite will apply for a bullish one.)
Type 1 of regular divergence (Logic 1):
Zigzag has to form a higher high. The highest RSI within both Zigzag legs must form lower highs, but the RSI values which are exactly at the Zigzag highs should not form lower highs.
Type 2 of regular divergence (Logic 2):
Zigzag has to form a higher high. The highest RSI within both Zigzag legs must form lower highs, and the RSI values which are exactly at the Zigzag highs should form lower highs.
👉(The logic is written in case of a bearish hidden divergence. The opposite will apply for a bullish one.)
Zigzag has to form a lower high. The highest RSI within both Zigzag legs must form higher highs.
👉There is also a filter that will be applied to all the divergences. It only shows the divergences whose corresponding RSI value was above/below a level (overbought level/oversold level).
Logic for regular divergences:
Bearish regular divergence's first high's (leftmost) RSI value should be greater than or equal to 70.
Bullish regular divergence's first low's (leftmost) RSI value should be less than or equal to 30.
Logic for hidden divergences:
Bearish hidden divergence's second high's (rightmost) RSI value should be greater than or equal to 70.
Bullish hidden divergence's second low's (rightmost) RSI value should be less than or equal to 30.
👉There is another feature also. This indicator colors the background based on whether the RSI is in a bullish or bearish range.
If it's within 80-60, the background will be colored green (this means that RSI is in a bullish range).
If it's within 40-20, the background will be colored red (this means that RSI is in a bearish range).
Adaptive Cycle Oscillator with EMADescription of the Adaptive Cycle Oscillator with EMA Pine Script
This Pine Script, titled "Adaptive Cycle Oscillator with EMA", is a custom technical indicator designed for TradingView to help traders analyze market cycles and identify potential buy or sell opportunities. It combines an Adaptive Cycle Oscillator (ACO) with multiple Exponential Moving Averages (EMAs), displayed as colorful, wavy lines, and includes features like buy/sell signals and divergence detection. Below is a beginner-friendly explanation of how the script works, adhering to TradingView's Script Publishing Rules.
What This Indicator Does
The Adaptive Cycle Oscillator with EMA helps you:
Visualize market cycles using an oscillator that adapts to price movements.
Track trends with seven EMAs of different lengths, plotted as a rainbow of wavy lines.
Identify potential buy or sell signals when the oscillator crosses predefined thresholds.
Spot divergences between the oscillator and price to anticipate reversals.
Use customizable settings to adjust the indicator to your trading style.
Note: This is a technical analysis tool and does not guarantee profits. Always combine it with other analysis methods and practice risk management.
Step-by-Step Explanation for New Users
1. Understanding the Indicator
Adaptive Cycle Oscillator (ACO): The ACO analyzes price data (based on high, low, and close prices, or HLC3) to detect market cycles. It smooths price movements to create an oscillator that swings between overbought and oversold levels.
EMAs: Seven EMAs of different lengths are applied to the ACO and scaled based on the market's dominant cycle. These EMAs are plotted as colorful, wavy lines to show trend direction.
Buy/Sell Signals: The script generates signals when the ACO crosses above or below user-defined thresholds, indicating potential entry or exit points.
Divergence Detection: The script identifies bullish or bearish divergences between the ACO and the fastest EMA, which may signal potential reversals.
Visual Style: The indicator uses a rainbow of seven colors (red, orange, yellow, green, blue, indigo, violet) for the EMAs, with wavy lines for a unique visual effect. Static levels (zero, overbought, oversold) are also wavy for consistency.
2. How to Add the Indicator to Your Chart
Open TradingView and load the chart of any asset (e.g., stock, forex, crypto).
Click on the Indicators button at the top of the chart.
Search for "Adaptive Cycle Oscillator with EMA" (or paste the script into TradingView’s Pine Editor if you have access to it).
Click to add the indicator to your chart. It will appear in a separate panel below the price chart.
3. Customizing the Indicator
The script offers several input options to tailor it to your needs:
Base Cycle Length (Default: 20): Sets the initial period for calculating the dominant cycle. Higher values make the indicator slower; lower values make it more sensitive.
Alpha Smoothing (Default: 0.07): Controls how much the ACO smooths price data. Smaller values produce smoother results.
Show Buy/Sell Signals (Default: True): Toggle to display green triangles (buy) and red triangles (sell) on the chart.
Threshold (Default: 0.0): Defines overbought (above threshold) and oversold (below threshold) levels. Adjust to widen or narrow signal zones.
EMA Base Length (Default: 10): Sets the starting length for the fastest EMA. Other EMAs are incrementally longer (12, 14, 16, etc.).
Divergence Lookback (Default: 14): Determines how far back the script looks to detect divergences.
To adjust these:
Right-click the indicator on your chart and select Settings.
Modify the inputs in the pop-up window.
Click OK to apply changes.
4. Reading the Indicator
Oscillator and EMAs: The ACO and seven EMAs are plotted in a separate panel. The EMAs (colored lines) move in a wavy pattern:
Red (fastest) to Violet (slowest) represent different response speeds.
When the faster EMAs (e.g., red, orange) are above slower ones (e.g., blue, violet), it suggests bullish momentum, and vice versa.
Zero Line: A gray wavy line at zero acts as a neutral level. The ACO above zero indicates bullish conditions; below zero indicates bearish conditions.
Overbought/Oversold Lines: Red (overbought) and green (oversold) wavy lines mark threshold levels. Extreme ACO values near these lines may suggest reversals.
Buy/Sell Signals:
Green Triangle (Bottom): Appears when the ACO crosses above the oversold threshold, suggesting a potential buy.
Red Triangle (Top): Appears when the ACO crosses below the overbought threshold, suggesting a potential sell.
Divergences:
Green Triangle (Bottom): Indicates a bullish divergence (price makes a lower low, but the EMA makes a higher low), hinting at a potential upward reversal.
Red Triangle (Top): Indicates a bearish divergence (price makes a higher high, but the EMA makes a lower high), hinting at a potential downward reversal.
5. Using Alerts
You can set alerts for key events:
Right-click the indicator and select Add Alert.
Choose a condition (e.g., "ACO Buy Signal", "Bullish Divergence").
Configure the alert settings (e.g., notify via email, app, or pop-up).
Click Create to activate the alert.
Available alert conditions:
ACO Buy Signal: When the ACO crosses above the oversold threshold.
ACO Sell Signal: When the ACO crosses below the overbought threshold.
Bullish Divergence: When a potential upward reversal is detected.
Bearish Divergence: When a potential downward reversal is detected.
6. Tips for Using the Indicator
Combine with Other Tools: Use the indicator alongside support/resistance levels, candlestick patterns, or other indicators (e.g., RSI, MACD) for confirmation.
Test on Different Timeframes: The indicator works on any timeframe (e.g., 1-minute, daily). Shorter timeframes may produce more signals but with more noise.
Practice Risk Management: Never rely solely on this indicator. Set stop-losses and position sizes to manage risk.
Backtest First: Use TradingView’s Strategy Tester (if you convert the script to a strategy) to evaluate performance on historical data.
Compliance with TradingView’s Script Publishing Rules
This description adheres to TradingView’s Script Publishing Rules (as outlined in the provided link):
No Performance Claims: The description avoids promising profits or specific results, emphasizing that the indicator is a tool for analysis.
Clear Instructions: It provides step-by-step guidance for adding, customizing, and using the indicator.
Risk Disclaimer: It notes that trading involves risks and the indicator should be used with other analysis methods.
No Misleading Terms: Terms like “buy” and “sell” are used to describe signals, not guaranteed actions.
Transparency: The description explains the indicator’s components (ACO, EMAs, signals, divergences) without exaggerating its capabilities.
No External Links: The description avoids linking to external resources or soliciting users.
Educational Tone: It focuses on educating users about the indicator’s functionality.
Limitations
Not a Standalone System: The indicator is not a complete trading strategy. It provides insights but requires additional analysis.
Lagging Nature: As with most oscillators and EMAs, signals may lag behind price movements, especially in fast markets.
False Signals: Signals and divergences may not always lead to successful trades, particularly in choppy markets.
Market Dependency: Performance varies across assets and market conditions (e.g., trending vs. ranging markets).

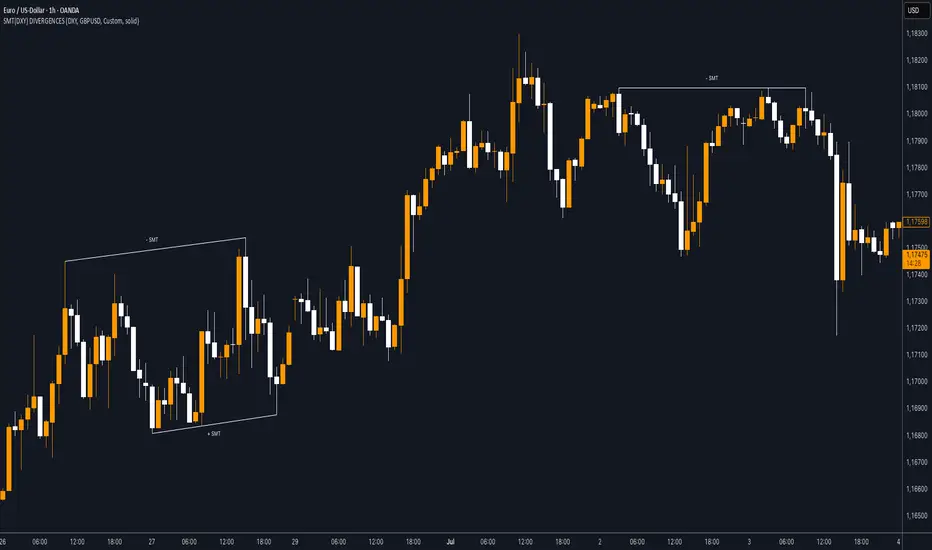
SMT (DXY) DIVERGENCESThis indicator detects Smart Money Technique (SMT) Divergences between the chart symbol and up to two comparison symbols defined in the settings.
It identifies swing highs and swing lows on correlated/uncorrelated instruments, compares their highs and lows, and determines possible divergences.
🔷 What It Detects
-Bullish SMT Divergence: When the lows of the chart symbol slope in the opposite direction of the comparison symbol’s lows.
-Bearish SMT Divergence: When the highs of the chart symbol slope in the opposite direction of the comparison symbol’s highs.
-Multi-Symbol Compatibility: Ability to compare the main symbol with one or two external tickers (default: DXY and GBPUSD).
-Negative Divergence Option: The inversion feature allows comparison with opposite-moving charts.
🔷 Calculation Logic
-Swing Detection: Swing highs and lows are confirmed using pivot-based logic.
-Comparison: Slopes of highs and lows are calculated for both the chart symbol and the comparison symbols.
-Divergence Identification: If slopes point in opposite directions, an SMT divergence (bullish or bearish) is marked.
-Visualization: Lines and labels (“+ SMT” or “– SMT”) are drawn on the chart. Historical lines can be kept or cleared depending on user settings.
🔷 Visual
Bearish SMT: Downward line with “– SMT” label.
Bullish SMT: Upward line with “+ SMT” label.
Style Options: Predefined color schemes (TLAB, standard, monochrome) or fully customizable colors.
Line Style: Solid, dashed, or dotted.
🔷 Customization Options
-Show Historical: Decide whether past divergences remain visible on the chart.
-Comparison Symbols: Define up to two external tickers, with optional inversion.
-Swing Lengths: Preconfigured pivot lengths automatically adapt to the selected timeframe (Daily, 4H, 1H, 5m/15m).
-Lines & Labels: Enable or disable bullish/bearish SMT divergences and their annotations.
🔷 Indicator Usage
Select the comparison symbol with positive or negative correlation.
Wait for the “+ SMT” or “– SMT” marker to appear on the chart.
Divergences can be used as contextual confluence when studying potential market shifts:
A + SMT marker may suggest bullish divergence.
A – SMT marker may suggest bearish divergence.
Ultimate MACD [captainua]Ultimate MACD - Comprehensive MACD Trading System
Overview
This indicator combines traditional MACD calculations with advanced features including divergence detection, volume analysis, histogram analysis tools, regression forecasting, strong top/bottom detection, and multi-timeframe confirmation to provide a comprehensive MACD-based trading system. The script calculates MACD using configurable moving average types (EMA, SMA, RMA, WMA) and applies various smoothing methods to reduce noise while maintaining responsiveness. The combination of these features creates a multi-layered confirmation system that reduces false signals by requiring alignment across multiple indicators and timeframes.
Core Calculations
MACD Calculation:
The script calculates MACD using the standard formula: MACD Line = Fast MA - Slow MA, Signal Line = Moving Average of MACD Line, Histogram = MACD Line - Signal Line. The default parameters are Fast=12, Slow=26, Signal=9, matching the traditional MACD settings. The script supports four moving average types:
- EMA (Exponential Moving Average): Standard and most responsive, default choice
- SMA (Simple Moving Average): Equal weight to all periods
- RMA (Wilder's Moving Average): Smoother, less responsive
- WMA (Weighted Moving Average): Recent prices weighted more heavily
The price source can be configured as Close (standard), Open, High, Low, HL2, HLC3, or OHLC4. Alternative sources provide different sensitivity characteristics for various trading strategies.
Configuration Presets:
The script includes trading style presets that automatically configure MACD parameters:
- Scalping: Fast/Responsive settings (8,18,6 with minimal smoothing)
- Day Trading: Balanced settings (10,22,7 with minimal smoothing)
- Swing Trading: Standard settings (12,26,9 with moderate smoothing)
- Position Trading: Smooth/Conservative settings (15,35,12 with higher smoothing)
- Custom: Full manual control over all parameters
Histogram Smoothing:
The histogram can be smoothed using EMA to reduce noise and filter minor fluctuations. Smoothing length of 1 = raw histogram (no smoothing), higher values (3-5) = smoother histogram. Increased smoothing reduces noise but may delay signals slightly.
Percentage Mode:
MACD values can be converted to percentage of price (MACD/Close*100) for cross-instrument comparison. This is useful when comparing MACD signals across instruments with different price levels (e.g., BTC vs ETH). The percentage mode normalizes MACD values, making them comparable regardless of instrument price.
MACD Scale Factor:
A scale factor multiplier (default 1.0) allows adjusting MACD display size for better visibility. Use 0.3-0.5 if MACD appears too compressed, or 2.0-3.0 if too small.
Dynamic Overbought/Oversold Levels:
Overbought and oversold levels are calculated dynamically based on MACD's mean and standard deviation over a lookback period. The formula: OB = MACD Mean + (StdDev × OB Multiplier), OS = MACD Mean - (StdDev × OS Multiplier). This adapts to current market conditions, widening in volatile markets and narrowing in calm markets. The lookback period (default 20) controls how quickly the levels adapt: longer periods (30-50) = more stable levels, shorter (10-15) = more responsive.
OB/OS Background Coloring:
Optional background coloring can highlight the entire panel when MACD enters overbought or oversold territory, providing prominent visual indication of extreme conditions. The background colors are drawn on top of the main background to ensure visibility.
Divergence Detection
Regular Divergence:
The script uses the MACD line (not histogram) for divergence detection, which provides more reliable signals. Bullish divergence: Price makes a lower low while MACD line makes a higher low. Bearish divergence: Price makes a higher high while MACD line makes a lower high. Divergences often precede reversals and are powerful reversal signals.
Pivot-Based Divergence:
The divergence detection uses actual pivot points (pivotlow/pivothigh) instead of simple lowest/highest comparisons. This provides more accurate divergence detection by identifying significant pivot lows/highs in both price and MACD line. The pivot-based method compares two recent pivot points: for bullish divergence, price makes a lower low while MACD makes a higher low at the pivot points. This method reduces false divergences by requiring actual pivot points rather than just any low/high within a period.
The pivot lookback parameters (left and right) control how many bars on each side of a pivot are required for confirmation. Higher values = more conservative pivot detection.
Hidden Divergence:
Continuation patterns that signal trend continuation rather than reversal. Bullish hidden divergence: Price makes a higher low but MACD makes a lower low. Bearish hidden divergence: Price makes a lower high but MACD makes a higher high. These patterns indicate the trend is likely to continue in the current direction.
Zero-Line Filter:
The "Don't Touch Zero Line" option ensures divergences occur in proper context: for bullish divergence, MACD must stay below zero; for bearish divergence, MACD must stay above zero. This filters out divergences that occur in neutral zones.
Range Filtering:
Minimum and maximum lookback ranges control the time window between pivots to consider for divergence. This helps filter out divergences that are too close together (noise) or too far apart (less relevant).
Volume Confirmation System
Volume threshold filtering requires current volume to exceed the volume SMA multiplied by the threshold factor. The formula: Volume Confirmed = Volume > (Volume SMA × Threshold). If the threshold is set to 1.0 or lower, volume confirmation is effectively disabled (always returns true). This allows you to use the indicator without volume filtering if desired. Volume confirmation significantly increases divergence and signal reliability.
Volume Climax and Dry-Up Detection:
The script can mark bars with extremely high volume (volume climax) or extremely low volume (volume dry-up). Volume climax indicates potential reversal points or strong momentum continuation. Volume dry-up indicates low participation and may produce unreliable signals. These markers use standard deviation multipliers to identify extreme volume conditions.
Zero-Line Cross Detection
MACD zero-line crosses indicate momentum shifts: above zero = bullish momentum, below zero = bearish momentum. The script includes alert conditions for zero-line crosses with cooldown protection to prevent alert spam. Zero-line crosses can provide early warning signals before MACD crosses the signal line.
Histogram Analysis Tools
Histogram Moving Average:
A moving average applied to the histogram itself helps identify histogram trend direction and acts as a signal line for histogram movements. Supports EMA, SMA, RMA, and WMA types. Useful for identifying when histogram momentum is strengthening or weakening.
Histogram Bollinger Bands:
Bollinger Bands are applied to the MACD histogram instead of price. The calculation: Basis = SMA(Histogram, Period), StdDev = stdev(Histogram, Period), Upper = Basis + (StdDev × Deviation Multiplier), Lower = Basis - (StdDev × Deviation Multiplier). This creates dynamic zones around the histogram that adapt to histogram volatility. When the histogram touches or exceeds the bands, it indicates extreme conditions relative to recent histogram behavior.
Stochastic MACD (StochMACD):
Stochastic MACD applies the Stochastic oscillator formula to the MACD histogram instead of price. This normalizes the histogram to a 0-100 scale, making it easier to identify overbought/oversold conditions on the histogram itself. The calculation: %K = ((Histogram - Lowest Histogram) / (Highest Histogram - Lowest Histogram)) × 100. %K is smoothed, and %D is calculated as the moving average of smoothed %K. Standard thresholds are 80 (overbought) and 20 (oversold).
Regression Forecasting
The script includes advanced regression forecasting that predicts future MACD values using mathematical models. This helps anticipate potential MACD movements and provides forward-looking context for trading decisions.
Regression Types:
- Linear: Simple trend line (y = mx + b) - fastest, works well for steady trends
- Polynomial: Quadratic curve (y = ax² + bx + c) - captures curvature in MACD movement
- Exponential Smoothing: Weighted average with more weight on recent values - responsive to recent changes
- Moving Average: Uses difference between short and long MA to estimate trend - stable and smooth
Forecast Horizon:
Number of bars to forecast ahead (default 5, max 50 for linear/MA, max 20 for polynomial due to performance). Longer horizons predict further ahead but may be less accurate.
Confidence Bands:
Optional upper/lower bands around forecast show prediction uncertainty based on forecast error (standard deviation of prediction vs actual). Wider bands = higher uncertainty. The confidence level multiplier (default 1.5) controls band width.
Forecast Display:
Forecast appears as dotted lines extending forward from current bar, with optional confidence bands. All forecast values respect percentage mode and scale factor settings.
Strong Top/Bottom Signals
The script detects strong recovery from extreme MACD levels, generating "sBottom" and "sTop" signals. These identify significant reversal potential when MACD recovers substantially from overbought/oversold extremes.
Strong Bottom (sBottom):
Triggered when:
1. MACD was at or near its lowest point in the bottom period (default 10 bars)
2. MACD was in or near the oversold zone
3. MACD has recovered by at least the threshold amount (default 0.5) from the lowest point
4. Recovery persists for confirmation bars (default 2 consecutive bars)
5. MACD has moved out of the oversold zone
6. Volume is above average
7. All enabled filters pass
8. Minimum bars have passed since last signal (reset period, default 5 bars)
Strong Top (sTop):
Triggered when:
1. MACD was at or near its highest point in the top period (default 7 bars)
2. MACD was in or near the overbought zone
3. MACD has declined by at least the threshold amount (default 0.5) from the highest point
4. Decline persists for confirmation bars (default 2 consecutive bars)
5. MACD has moved out of the overbought zone
6. Volume is above average
7. All enabled filters pass
8. Minimum bars have passed since last signal (reset period, default 5 bars)
Label Placement:
sTop/sBottom labels appear on the historical bar where the actual extreme occurred (not on current bar), showing the exact MACD value at that extreme. Labels respect the unified distance checking system to prevent overlaps with Buy/Sell Strength labels.
Signal Strength Calculation
The script calculates a composite signal strength score (0-100) based on multiple factors:
- MACD distance from signal line (0-50 points): Larger separation indicates stronger signal
- Volume confirmation (0-15 points): Volume above average adds points
- Secondary timeframe alignment (0-15 points): Higher timeframe agreement adds points
- Distance from zero line (0-20 points): Closer to zero can indicate stronger reversal potential
Higher scores (70+) indicate stronger, more reliable signals. The signal strength is displayed in the statistics table and can be used as a filter to only accept signals above a threshold.
Smart Label Placement System
The script includes an advanced label placement system that tracks MACD extremes and places Buy/Sell Strength labels at optimal locations:
Label Placement Algorithm:
- Labels appear on the current bar at confirmation (not on historical extreme bars), ensuring they're visible when the signal is confirmed
- The system tracks pending signals when MACD enters OB/OS zones or crosses the signal line
- During tracking, the system continuously searches for the true extreme (lowest MACD for buys, highest MACD for sells) within a configurable historical lookback period
- Labels are only finalized when: (1) MACD exits the OB/OS zone, (2) sufficient bars have passed (2x minimum distance), (3) MACD has recovered/declined by a configurable percentage from the extreme (default 15%), and (4) tracking has stopped (no better extreme found)
Label Spacing and Overlap Prevention:
- Minimum Bars Between Labels: Base distance requirement (default 5 bars)
- Label Spacing Multiplier: Scales the base distance (default 1.5x) for better distribution. Higher values = more spacing between labels
- Effective distance = Base Distance × Spacing Multiplier (e.g., 5 × 1.5 = 7.5 bars minimum)
- Unified distance checking prevents overlaps between all label types (Buy Strength, Sell Strength, sTop, sBottom)
Strength-Based Filtering:
- Label Strength Minimum (%): Only labels with strength at or above this threshold are displayed (default 75%)
- When multiple potential labels are close together, the system automatically compares strengths and keeps only the strongest one
- This ensures only the most significant signals are displayed, reducing chart clutter
Zero Line Polarity Enforcement:
- Enforce Zero Line Polarity (default enabled): Ensures labels follow traditional MACD interpretation
- Buy Strength labels only appear when the tracked extreme MACD value was below zero (negative territory)
- Sell Strength labels only appear when the tracked extreme MACD value was above zero (positive territory)
- This prevents counter-intuitive labels (e.g., Buy labels above zero line) and aligns with standard MACD trading principles
Recovery/Decline Confirmation:
- Recovery/Decline Confirm (%): Percent move away from the extreme required before finalizing (default 15%)
- For Buy labels: MACD must recover by at least this percentage from the tracked bottom
- For Sell labels: MACD must decline by at least this percentage from the tracked top
- Higher values = more confirmation required, fewer but more reliable labels
Historical Lookback:
- Historical Lookback for Label Placement: Number of bars to search for true extremes (default 20)
- The system searches within this period to find the actual lowest/highest MACD value
- Higher values analyze more history but may be slower; lower values are faster but may miss some extremes
Cross Quality Score
The script calculates a MACD cross quality score (0-100) that rates crossover quality based on:
- Cross angle (0-50 points): Steeper crosses = stronger signals
- Volume confirmation (0-25 points): Volume above average adds points
- Distance from zero line (0-25 points): Crosses near zero line are stronger
This score helps identify high-quality crossovers and can be used as a filter to only accept signals meeting minimum quality threshold.
Filtering System
Histogram Filter:
Requires histogram to be above zero for buy signals, below zero for sell signals. Ensures momentum alignment before generating signals.
Signal Strength Filter:
Requires minimum signal strength score for signals. Higher threshold = only strongest signals pass. This combines multiple confirmation factors into a single filter.
Cross Quality Filter:
Requires minimum cross quality score for signals. Rates crossover quality based on angle, volume, momentum, and distance from zero. Only signals meeting minimum quality threshold will be generated.
All filters use the pattern: filterResult = not filterEnabled OR conditionMet. This means if a filter is disabled, it always passes (returns true). Filters can be combined, and all must pass for a signal to fire.
Multi-Timeframe Analysis
The script can display MACD from a secondary (higher) timeframe and use it for confirmation. When secondary timeframe confirmation is enabled, signals require the higher timeframe MACD to align (bullish/bearish) with the signal direction. This ensures signals align with the larger trend context, reducing counter-trend trades.
Secondary Timeframe MACD:
The secondary timeframe MACD uses the same calculation parameters (fast, slow, signal, MA type) as the main MACD but from a higher timeframe. This provides context for the current timeframe's MACD position relative to the larger trend. The secondary MACD lines are displayed on the chart when enabled.
Noise Filtering
Noise filtering hides small histogram movements below a threshold. This helps focus on significant moves and reduces chart clutter. When enabled, only histogram movements above the threshold are displayed. Typical threshold values are 0.1-0.5 for most instruments, depending on the instrument's price range and volatility.
Signal Debounce
Signal debounce prevents duplicate MACD cross signals within a short time period. Useful when MACD crosses back and forth quickly, creating multiple signals. Debounce ensures only one signal per period, reducing signal spam during choppy markets. This is separate from alert cooldown, which applies to all alert types.
Background Color Modes
The script offers three background color modes:
- Dynamic: Full MACD heatmap based on OB/OS conditions, confidence, and momentum. Provides rich visual feedback.
- Monotone: Soft neutral background but still allows overlays (OB/OS zones). Keeps the chart clean without overpowering candles.
- Off: No MACD background (only overlays and plots). Maximum chart cleanliness.
When OB/OS background colors are enabled, they are drawn on top of the main background to ensure visibility.
Statistics Table
A real-time statistics table displays current MACD values, signal strength, distance from zero line, secondary timeframe alignment, volume confirmation status, and all active filter statuses. The table dynamically adjusts to show only enabled features, keeping it clean and relevant. The table position can be configured (Top Left, Top Right, Bottom Left, Bottom Right).
Performance Statistics Table
An optional performance statistics table shows comprehensive filter diagnostics:
- Total buy/sell signals (raw crossover count before filters)
- Filtered buy/sell signals (signals that passed all filters)
- Overall pass rates (percentage of signals that passed filters)
- Rejected signals count
- Filter-by-filter rejection diagnostics showing which filters rejected how many signals
This table helps optimize filter settings by showing which filters are most restrictive and how they impact signal frequency. The diagnostics format shows rejections as "X B / Y S" (X buy signals rejected, Y sell signals rejected) or "Disabled" if the filter is not active.
Alert System
The script includes separate alert conditions for each signal type:
- MACD Cross: MACD line crosses above/below Signal line (with or without secondary confirmation)
- Zero-Line Cross: MACD crosses above/below zero
- Divergence: Regular and hidden divergence detections
- Secondary Timeframe: Higher timeframe MACD crosses
- Histogram MA Cross: Histogram crosses above/below its moving average
- Histogram Zero Cross: Histogram crosses above/below zero
- StochMACD: StochMACD overbought/oversold entries and %K/%D crosses
- Histogram BB: Histogram touches/breaks Bollinger Bands
- Volume Events: Volume climax and dry-up detections
- OB/OS: MACD entry/exit from overbought/oversold zones
- Strong Top/Bottom: sTop and sBottom signal detections
Each alert type has its own cooldown system to prevent alert spam. The cooldown requires a minimum number of bars between alerts of the same type, reducing duplicate alerts during volatile periods. Alert types can be filtered to only evaluate specific alert types (All, MACD Cross, Zero Line, Divergence, Secondary Timeframe, Histogram MA, Histogram Zero, StochMACD, Histogram BB, Volume Events, OB/OS, Strong Top/Bottom).
How Components Work Together
MACD crossovers provide the primary signal when the MACD line crosses the Signal line. Zero-line crosses indicate momentum shifts and can provide early warning signals. Divergences identify potential reversals before they occur.
Volume confirmation ensures signals occur with sufficient market participation, filtering out low-volume false breakouts. Histogram analysis tools (MA, Bollinger Bands, StochMACD) provide additional context for signal reliability and identify significant histogram zones.
Signal strength combines multiple confirmation factors into a single score, making it easy to filter for only the strongest signals. Cross quality score rates crossover quality to identify high-quality setups. Multi-timeframe confirmation ensures signals align with higher timeframe trends, reducing counter-trend trades.
Usage Instructions
Getting Started:
The default configuration shows MACD(12,26,9) with standard EMA calculations. Start with default settings and observe behavior, then customize settings to match your trading style. You can use configuration presets for quick setup based on your trading style.
Customizing MACD Parameters:
Adjust Fast Length (default 12), Slow Length (default 26), and Signal Length (default 9) based on your trading timeframe. Shorter periods (8,17,7) for faster signals, longer (15,30,12) for smoother signals. You can change the moving average type: EMA for responsiveness, RMA for smoothness, WMA for recent price emphasis.
Price Source Selection:
Choose Close (standard), or alternative sources (HL2, HLC3, OHLC4) for different sensitivity. HL2 uses the midpoint of the high-low range, HLC3 and OHLC4 incorporate more price information.
Histogram Smoothing:
Set smoothing to 1 for raw histogram (no smoothing), or increase (3-5) for smoother histogram that reduces noise. Higher smoothing reduces false signals but may delay signals slightly.
Percentage Mode:
Enable percentage mode when comparing MACD across instruments with different price levels. This normalizes MACD values, making them directly comparable.
Dynamic OB/OS Levels:
The dynamic thresholds automatically adapt to volatility. Adjust the multipliers (default 1.5) to fine-tune sensitivity: higher values (2.0-3.0) = more extreme thresholds (fewer signals), lower (1.0-1.5) = more frequent signals. Adjust the lookback period to control how quickly levels adapt. Enable OB/OS background colors for visual indication of extreme conditions.
Volume Confirmation:
Set volume threshold to 1.0 (default, effectively disabled) or higher (1.2-1.5) for standard confirmation. Higher values require more volume for confirmation. Set to 0.1 to completely disable volume filtering.
Filters:
Enable filters gradually to find your preferred balance. Start with histogram filter for basic momentum alignment, then add signal strength filter (threshold 50+) for moderate signals, then cross quality filter (threshold 50+) for high-quality crossovers. Combine filters for highest-quality signals but expect fewer signals.
Divergence:
Enable divergence detection and adjust pivot lookback parameters. Pivot-based divergence provides more accurate detection using actual pivot points. Hidden divergence is useful for trend-following strategies. Adjust range parameters to filter divergences by time window.
Zero-Line Crosses:
Zero-line cross alerts are automatically available when alerts are enabled. These provide early warning signals for momentum shifts.
Histogram Analysis Tools:
Enable Histogram Moving Average to see histogram trend direction. Enable Histogram Bollinger Bands to identify extreme histogram zones. Enable Stochastic MACD to normalize histogram to 0-100 scale for overbought/oversold identification.
Multi-Timeframe:
Enable secondary timeframe MACD to see higher timeframe context. Enable secondary confirmation to require higher timeframe alignment for signals.
Signal Strength:
Signal strength is automatically calculated and displayed in the statistics table. Use signal strength filter to only accept signals above a threshold (e.g., 50 for moderate, 70+ for strong signals only).
Smart Label Placement:
Configure label placement settings to control label appearance and quality:
- Label Strength Minimum (%): Set threshold (default 75%) to show only strong signals. Higher = fewer, stronger labels
- Label Spacing Multiplier: Adjust spacing (default 1.5x) for better distribution. Higher = more spacing between labels
- Recovery/Decline Confirm (%): Set confirmation requirement (default 15%). Higher = more confirmation, fewer labels
- Enforce Zero Line Polarity: Enable (default) to ensure Buy labels only appear when tracked extreme was below zero, Sell labels only when above zero
- Historical Lookback: Adjust search period (default 20 bars) for finding true extremes. Higher = more history analyzed
Cross Quality:
Cross quality score is automatically calculated for crossovers. Use cross quality filter to only accept high-quality crossovers (threshold 50+ for moderate, 70+ for high quality).
Alerts:
Set up alerts for your preferred signal types. Enable alert cooldown (default enabled, 5 bars) to prevent alert spam. Use alert type filter to only evaluate specific alert types (All, MACD Cross, Zero Line, Divergence, Secondary Timeframe, Histogram MA, Histogram Zero, StochMACD, Histogram BB, Volume Events, OB/OS, Strong Top/Bottom). Each signal type has its own alert condition, so you can be selective about which signals trigger alerts.
Visual Elements and Signal Markers
The script uses various visual markers to indicate signals and conditions:
- MACD Line: Green when above signal (bullish), red when below (bearish) if dynamic colors enabled. Optional black outline for enhanced visibility
- Signal Line: Orange line with optional black outline for enhanced visibility
- Histogram: Color-coded based on direction and momentum (green for bullish rising, lime for bullish falling, red for bearish falling, orange for bearish rising)
- Zero Line: Horizontal reference line at MACD = 0
- Fill to Zero: Green/red semi-transparent fill between MACD line and zero line showing bullish/bearish territory
- Fill Between OB/OS: Blue semi-transparent fill between overbought/oversold thresholds highlighting neutral zone
- OB/OS Background Colors: Background coloring when MACD enters overbought/oversold zones
- Background Colors: Dynamic or monotone backgrounds indicating MACD state, or custom chart background
- Divergence Labels: "🐂" for bullish, "🐻" for bearish, "H Bull" for hidden bullish, "H Bear" for hidden bearish
- Divergence Lines: Colored lines connecting pivot points when divergences are detected
- Volume Climax Markers: ⚡ symbol for extremely high volume
- Volume Dry-Up Markers: 💧 symbol for extremely low volume
- Buy/Sell Strength Labels: Show signal strength percentage (e.g., "Buy Strength: 75%")
- Strong Top/Bottom Labels: "sTop" and "sBottom" for extreme level recoveries
- Secondary MACD Lines: Purple lines showing higher timeframe MACD
- Histogram MA: Orange line showing histogram moving average
- Histogram BB: Blue bands around histogram showing extreme zones
- StochMACD Lines: %K and %D lines with overbought/oversold thresholds
- Regression Forecast: Dotted blue lines extending forward with optional confidence bands
Signal Priority and Interpretation
Signals are generated independently and can occur simultaneously. Higher-priority signals generally indicate stronger setups:
1. MACD Cross with Multiple Filters - Highest priority: Requires MACD crossover plus all enabled filters (histogram, signal strength, cross quality) and secondary timeframe confirmation if enabled. These are the most reliable signals.
2. Zero-Line Cross - High priority: Indicates momentum shift. Can provide early warning signals before MACD crosses the signal line.
3. Divergence Signals - Medium-High priority: Pivot-based divergence is more reliable than simple divergence. Hidden divergence indicates continuation rather than reversal.
4. MACD Cross with Basic Filters - Medium priority: MACD crosses signal line with basic histogram filter. Less reliable alone but useful when combined with other confirmations.
Best practice: Wait for multiple confirmations. For example, a MACD crossover combined with divergence, volume confirmation, and secondary timeframe alignment provides the strongest setup.
Chart Requirements
For proper script functionality and compliance with TradingView requirements, ensure your chart displays:
- Symbol name: The trading pair or instrument name should be visible
- Timeframe: The chart timeframe should be clearly displayed
- Script name: "Ultimate MACD " should be visible in the indicator title
These elements help traders understand what they're viewing and ensure proper script identification. The script automatically includes this information in the indicator title and chart labels.
Performance Considerations
The script is optimized for performance:
- Calculations use efficient Pine Script functions (ta.ema, ta.sma, etc.) which are optimized by TradingView
- Conditional execution: Features only calculate when enabled
- Label management: Old labels are automatically deleted to prevent accumulation
- Array management: Divergence label arrays are limited to prevent memory accumulation
The script should perform well on all timeframes. On very long historical data with many enabled features, performance may be slightly slower, but it remains usable.
Known Limitations and Considerations
- Dynamic OB/OS levels can vary significantly based on recent MACD volatility. In very volatile markets, levels may be wider; in calm markets, they may be narrower.
- Volume confirmation requires sufficient historical volume data. On new instruments or very short timeframes, volume calculations may be less reliable.
- Higher timeframe MACD uses request.security() which may have slight delays on some data feeds.
- Stochastic MACD requires the histogram to have sufficient history. Very short periods on new charts may produce less reliable StochMACD values initially.
- Divergence detection requires sufficient historical data to identify pivot points. Very short lookback periods may produce false positives.
Practical Use Cases
The indicator can be configured for different trading styles and timeframes:
Swing Trading:
Use MACD(12,26,9) with secondary timeframe confirmation. Enable divergence detection. Use signal strength filter (threshold 50+) and cross quality filter (threshold 50+) for higher-quality signals. Enable histogram analysis tools for additional context.
Day Trading:
Use MACD(8,17,7) or use "Day Trading" preset with minimal histogram smoothing for faster signals. Enable zero-line cross alerts for early signals. Use volume confirmation with threshold 1.2-1.5. Enable histogram MA for momentum tracking.
Trend Following:
Use MACD(12,26,9) or longer periods (15,30,12) for smoother signals. Enable secondary timeframe confirmation for trend alignment. Hidden divergence signals are useful for trend continuation entries. Use cross quality filter to identify high-quality crossovers.
Reversal Trading:
Focus on divergence detection (pivot-based for accuracy) combined with zero-line crosses. Enable volume confirmation. Use histogram Bollinger Bands to identify extreme histogram zones. Enable StochMACD for overbought/oversold identification.
Multi-Timeframe Analysis:
Enable secondary timeframe MACD to see context from larger timeframes. For example, use daily MACD on hourly charts to understand the larger trend context. Enable secondary confirmation to require higher timeframe alignment for signals.
Practical Tips and Best Practices
Getting Started:
Start with default settings and observe MACD behavior. The default configuration (MACD 12,26,9 with EMA) is balanced and works well across different markets. After observing behavior, customize settings to match your trading style. Consider using configuration presets for quick setup.
Reducing Repainting:
All signals are based on confirmed bars, minimizing repainting. The script uses confirmed bar data for all calculations to ensure backtesting accuracy.
Signal Quality:
MACD crosses with multiple filters provide the highest-quality signals because they require alignment across multiple indicators. These signals have lower frequency but higher reliability. Use signal strength scores to identify the strongest signals (70+). Use cross quality scores to identify high-quality crossovers (70+).
Filter Combinations:
Start with histogram filter for basic momentum alignment, then add signal strength filter for moderate signals, then cross quality filter for high-quality crossovers. Combining all filters significantly reduces false signals but also reduces signal frequency. Find your balance based on your risk tolerance.
Volume Filtering:
Set volume threshold to 1.0 (default, effectively disabled) or lower to effectively disable volume filtering if you trade instruments with unreliable volume data or want to test without volume confirmation. Standard confirmation uses 1.2-1.5 threshold.
MACD Period Selection:
Standard MACD(12,26,9) provides balanced signals suitable for most trading. Shorter periods (8,17,7) for faster signals, longer (15,30,12) for smoother signals. Adjust based on your timeframe and trading style. Consider using configuration presets for optimized settings.
Moving Average Type:
EMA provides balanced responsiveness with smoothness. RMA is smoother and less responsive. WMA gives more weight to recent prices. SMA gives equal weight to all periods. Choose based on your preference for responsiveness vs. smoothness.
Divergence:
Pivot-based divergence is more reliable than simple divergence because it uses actual pivot points. Hidden divergence indicates continuation rather than reversal, useful for trend-following strategies. Adjust pivot lookback parameters to control sensitivity.
Dynamic Thresholds:
Dynamic OB/OS thresholds automatically adapt to volatility. In volatile markets, thresholds widen; in calm markets, they narrow. Adjust the multipliers to fine-tune sensitivity. Enable OB/OS background colors for visual indication.
Zero-Line Crosses:
Zero-line crosses indicate momentum shifts and can provide early warning signals before MACD crosses the signal line. Enable alerts for zero-line crosses to catch these early signals.
Alert Management:
Enable alert cooldown (default enabled, 5 bars) to prevent alert spam. Use alert type filter to only evaluate specific alert types. Signal debounce (default enabled, 3 bars) prevents duplicate MACD cross signals during choppy markets.
Technical Specifications
- Pine Script Version: v6
- Indicator Type: Non-overlay (displays in separate panel below price chart)
- Repainting Behavior: Minimal - all signals are based on confirmed bars, ensuring accurate backtesting results
- Performance: Optimized with conditional execution. Features only calculate when enabled.
- Compatibility: Works on all timeframes (1 minute to 1 month) and all instruments (stocks, forex, crypto, futures, etc.)
- Edge Case Handling: All calculations include safety checks for division by zero, NA values, and boundary conditions. Alert cooldowns and signal debounce handle edge cases where conditions never occurred or values are NA.
Technical Notes
- All MACD values respect percentage mode conversion when enabled
- Volume confirmation uses cached volume SMA for performance
- Label arrays (divergence) are automatically limited to prevent memory accumulation
- Background coloring: OB/OS backgrounds are drawn on top of main background to ensure visibility
- All calculations are optimized with conditional execution - features only calculate when enabled (performance optimization)
- Signal strength calculation combines multiple factors into a single score for easy filtering
- Cross quality calculation rates crossover quality based on angle, volume, and distance from zero
- Secondary timeframe MACD uses request.security() for higher timeframe data access
- Histogram analysis features (Bollinger Bands, MA, StochMACD) provide additional context beyond basic MACD signals
- Statistics table dynamically adjusts to show only enabled features, keeping it clean and relevant
- Divergence detection uses MACD line (not histogram) for more reliable signals
- Configuration presets automatically optimize MACD parameters for different trading styles
- Smart label placement: Labels appear on current bar at confirmation, using strength from tracked extreme point
- Label spacing uses effective distance (base distance × spacing multiplier) for better distribution
- Zero line polarity enforcement ensures Buy labels only appear when tracked extreme MACD < 0, Sell labels only when tracked extreme MACD > 0
- Label finalization requires MACD exit from OB/OS zone, sufficient bars passed, and recovery/decline percentage confirmation
- Strength-based filtering automatically compares and keeps only the strongest label when multiple signals are close together
- Enhanced visualization: Line outlines drawn behind main lines for superior visibility (black default, configurable)
- Enhanced visualization: Fill between MACD and zero line provides instant visual feedback (green above, red below)
- Enhanced visualization: Fill between OB/OS thresholds highlights neutral zone when dynamic levels are active
- Custom chart background overrides background mode when enabled, allowing theme-consistent indicator panels
